
Helm v3.17 Take Ownership Flag: Fix Release Conflicts

Helm v3.17 Take Ownership Flag: Fix Release Conflicts

Helm has long been the standard for managing Kubernetes applications using packaged charts, bringing a level of reproducibility and automation to the deployment process. However, some operational tasks, such as renaming a release or migrating objects between charts, have traditionally required cumbersome workarounds. With the introduction of the --take-ownership flag in Helm v3.17 (released in January 2025), a long-standing pain point is finally addressed—at least partially.

Related reading: Helm dependencies: condition, alias and version rules.

The take-ownership feature represents the continuing evolution of Helm. Learn about this and other cutting-edge capabilities in our Helm Charts Package Management Guide

In this post, we will explore:

  • What the --take-ownership flag does
  • Why it was needed
  • The caveats and limitations
  • Real-world use cases where it helps
  • When not to use it

Understanding Helm Release Ownership and Object Management

When Helm installs or upgrades a chart, it injects metadata—labels and annotations—into every managed Kubernetes object. These include:

app.kubernetes.io/managed-by: Helm
meta.helm.sh/release-name: my-release
meta.helm.sh/release-namespace: default

This metadata serves an important role: Helm uses it to track and manage resources associated with each release. As a safeguard, Helm does not allow another release to modify objects it does not own and when you trying that you will see messages like the one below:

Error: Unable to continue with install: Service "provisioner-agent" in namespace "test-my-ns" exists and cannot be imported into the current release: invalid ownership metadata; annotation validation error: key "meta.helm.sh/release-name" must equal "dp-core-infrastructure11": current value is "dp-core-infrastructure"

While this protects users from accidental overwrites, it creates limitations for advanced use cases.

Why --take-ownership Was Needed

Let’s say you want to:

  • Rename an existing Helm release from api-v1 to api.
  • Move a ConfigMap or Service from one chart to another.
  • Rebuild state during GitOps reconciliation when previous Helm metadata has drifted.

Previously, your only option was to:

  1. Uninstall the existing release.
  2. Reinstall under the new name.

This approach introduces downtime, and in production systems, that’s often not acceptable.

What the Flag Does

helm upgrade my-release ./my-chart --take-ownership

When this flag is passed, Helm will:

  • Skip the ownership validation for existing objects.
  • Override the labels and annotations to associate the object with the current release.

In practice, this allows you to claim ownership of resources that previously belonged to another release, enabling seamless handovers.

⚠️ What It Doesn’t Do

This flag does not:

  • Clean up references from the previous release.
  • Protect you from future uninstalls of the original release (which might still remove shared resources).
  • Allow you to adopt completely unmanaged Kubernetes resources (those not initially created by Helm).

In short, it’s a mechanism for bypassing Helm’s ownership checks, not a full lifecycle manager.

Real-World Helm Take Ownership Use Cases

Let’s go through common scenarios where this feature is useful.

✅ 1. Renaming a Release Without Downtime

Before:

helm uninstall old-name
helm install new-name ./chart

Now:

helm upgrade new-name ./chart --take-ownership

✅ 2. Migrating Objects Between Charts

You’re refactoring a large chart into smaller, modular ones and need to reassign certain Service or Secret objects.

This flag allows the new release to take control of the object without deleting or recreating it.

✅ 3. GitOps Drift Reconciliation

If objects were deployed out-of-band or their metadata changed unintentionally, GitOps tooling using Helm can recover without manual intervention using --take-ownership.

Best Practices and Recommendations

  • Use this flag intentionally, and document where it’s applied.
  • If possible, remove the previous release after migration to avoid confusion.
  • Monitor Helm’s behavior closely when managing shared objects.
  • For non-Helm-managed resources, continue to use kubectl annotate or kubectl label to manually align metadata.

Conclusion

The --take-ownership flag is a welcomed addition to Helm’s CLI arsenal. While not a universal solution, it smooths over many of the rough edges developers and SREs face during release evolution and GitOps adoption.

It brings a subtle but powerful improvement—especially in complex environments where resource ownership isn’t static.

Stay updated with Helm releases, and consider this flag your new ally in advanced release engineering.

The Modern Way: helm upgrade –take-ownership

Since Helm 3.17, most of the manual adoption workflow below is one flag:

helm upgrade --install myrelease ./mychart --take-ownership

With --take-ownership, Helm skips the ownership check that normally fails with “invalid ownership metadata; annotation validation error” and rewrites the ownership metadata to point at the new release. The resources’ spec is untouched — only the Helm bookkeeping changes. Two caveats: it applies to every conflicting resource in the chart (there is no per-resource opt-in), and it will happily steal resources from another Helm release, not just from kubectl-created objects — so run it with --dry-run first in anything shared.

Manual Adoption: The Three Ownership Markers

On older Helm versions (or when you want per-resource control), adoption means setting the three markers Helm checks before managing a resource:

kubectl label   deployment myapp "app.kubernetes.io/managed-by=Helm"
kubectl annotate deployment myapp "meta.helm.sh/release-name=myrelease"
kubectl annotate deployment myapp "meta.helm.sh/release-namespace=default"

After those three, the next helm upgrade treats the resource as its own and reconciles it against the chart template. This is the route to migrate kubectl-managed or kustomize-managed infrastructure into a chart incrementally, one resource at a time, without deleting anything.

Frequently Asked Questions

What does the Helm u002du002dtake-ownership flag do?

The u003ccodeu003eu002du002dtake-ownershipu003c/codeu003e flag allows Helm to bypass ownership validation and claim control of Kubernetes resources that belong to another release. It updates the u003cstrongu003emeta.helm.sh/release-nameu003c/strongu003e annotation to associate objects with the current release, enabling zero-downtime release renames and chart migrations.

When should I use Helm take ownership?

Use u003ccodeu003eu002du002dtake-ownershipu003c/codeu003e when renaming releases without downtime, migrating objects between charts, or fixing GitOps drift. It’s ideal for u003cstrongu003eproduction environmentsu003c/strongu003e where uninstall/reinstall cycles aren’t acceptable. Always document usage and clean up previous releases afterward.

What are the limitations of Helm take ownership?

The flag u003cstrongu003edoesn’t clean upu003c/strongu003e references from previous releases or protect against future uninstalls of the original release. It only works with Helm-managed resources, not completely unmanaged Kubernetes objects. Manual cleanup of old releases is still required.

Is Helm take ownership safe for production use?

Yes, but use it u003cstrongu003eintentionally and carefullyu003c/strongu003e. The flag bypasses Helm’s safety checks, so ensure you understand the ownership implications. Test in staging first, document all usage, and monitor for conflicts. Remove old releases after successful migration to avoid confusion.

Which Helm version introduced the take ownership flag?

The u003ccodeu003eu002du002dtake-ownershipu003c/codeu003e flag was introduced in u003cstrongu003eHelm v3.17u003c/strongu003e, released in January 2025. This feature addresses long-standing pain points with release renaming and chart migrations that previously required downtime-inducing uninstall/reinstall cycles.

Kyverno: A Detailed Way of Enforcing Standard and Custom Policies

Kyverno: A Detailed Way of Enforcing Standard and Custom Policies

In the Kubernetes ecosystem, security and governance are key aspects that need continuous attention. While Kubernetes offers some out-of-the-box (OOTB) security features such as Pod Security Admission (PSA), these might not be sufficient for complex environments with varying compliance requirements. This is where Kyverno comes into play, providing a powerful yet flexible solution for managing and enforcing policies across your cluster.

Related reading: Kubernetes security best practices.

In this post, we will explore the key differences between Kyverno and PSA, explain how Kyverno can be used in different use cases, and show you how to install and deploy policies with it. Although custom policy creation will be covered in a separate post, we will reference some pre-built policies you can use right away.

What Is Kyverno?

Kyverno is a policy engine for Kubernetes that lets you validate, mutate and generate cluster resources using policies written as plain YAML — no new programming language required. It runs as an admission controller: when someone applies a resource, Kyverno intercepts the request and either allows it, rejects it, silently fixes it, or creates additional resources alongside it, according to the rules you have defined.

The name means “govern” in Greek, and that is a fair description of the job. Typical uses are enforcing that every pod sets resource limits, blocking images from untrusted registries, requiring specific labels on namespaces, automatically injecting a NetworkPolicy into every new namespace, or verifying image signatures before a workload is admitted.

Three properties are worth knowing before you evaluate it:

  • Policies are Kubernetes resources. A Kyverno policy is a ClusterPolicy or Policy object written in YAML, so it goes through the same review, GitOps and RBAC machinery as the rest of your manifests.
  • It does more than say no. Validation is only one of three modes. Kyverno can also mutate (patch a resource on the way in) and generate (create related resources automatically), which is where most of its day-to-day value ends up coming from.
  • It is Kubernetes-only by design. That is a deliberate trade-off, and it is the main axis on which it differs from OPA Gatekeeper — see the comparison below.

The current release at the time of writing is Kyverno v1.18.2 (July 2026), and recent versions support both YAML-based and CEL-based policy expressions.

Kyverno vs OPA Gatekeeper: Which Policy Engine?

This is the comparison most teams actually need to make, and after several years of both projects converging it is rarely about raw capability. The short version: choose Kyverno if your policies are Kubernetes-only and you want them in YAML; choose OPA Gatekeeper if you need maximum expressiveness or want to reuse the same policy language outside Kubernetes.

KyvernoOPA Gatekeeper
Policy languageYAML (plus CEL); nothing new to learnRego, via ConstraintTemplates and Constraints
Learning curveLow — it looks like the manifests you already writeHigher — Rego is a genuine language to learn
Validate✅ first-class✅ first-class, its strongest area
Mutate✅ first-class policy type✅ added later, via dedicated resources rather than Rego
Generate resources✅ native❌ not a design goal
ScopeKubernetes onlyKubernetes, plus APIs, microservices, Terraform — same Rego everywhere
Complex programmatic logicWorkable, but YAML shows its limitsWhere Rego pulls ahead
CNCF maturityGraduatedGraduated (part of Open Policy Agent)
Current releasev1.18.2 (Jul 2026)v3.23.0 (Jul 2026)

There is now a third option that did not exist when this debate started: ValidatingAdmissionPolicy with CEL, built into Kubernetes itself. It needs no extra components at all, so if a rule can be expressed in CEL it is worth reaching for first. The limitation is that CEL cannot make external calls or hold state — so image-signature verification, cross-resource lookups, mutation and generation still belong to Kyverno or Gatekeeper. In practice many clusters end up with native CEL policies for the simple rules and Kyverno for everything else.

Who Maintains Kyverno? Governance and Commercial Support

Kyverno is a CNCF Graduated project — the same maturity tier as Kubernetes, Prometheus and Envoy, and the highest the foundation awards. That matters for the question every platform team eventually asks: the project is not owned by a single vendor who can change the licence, and graduation requires a demonstrated governance model, security audit and a healthy contributor base.

It was created by Nirmata, who remain the most active contributor and offer commercial support and long-term support around it. If you need a support contract, an LTS commitment or consulting, Nirmata is the primary vendor, and several others also provide commercial Kyverno support — Giant Swarm, InfraCloud, BlakYaks and Kodekloud among them. The open-source project itself is free and Apache-2.0, and nothing in the upstream distribution is gated behind a commercial tier.

What is Pod Security Admission (PSA)?

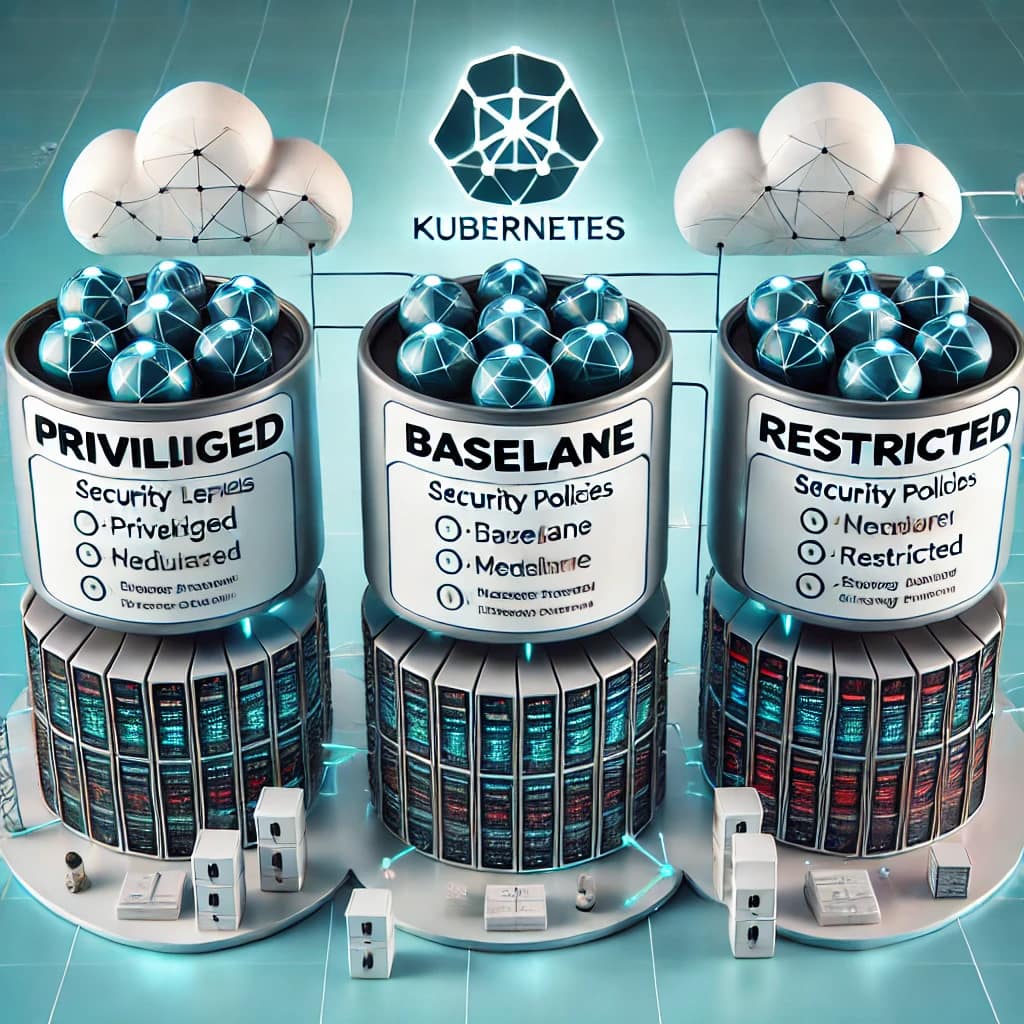
Kubernetes introduced Pod Security Admission (PSA) as a replacement for the now deprecated PodSecurityPolicy (PSP). PSA focuses on enforcing three predefined levels of security: Privileged, Baseline, and Restricted. These levels control what pods are allowed to run in a namespace based on their security context configurations.

  • Privileged: Minimal restrictions, allowing privileged containers and host access.
  • Baseline: Applies standard restrictions, disallowing privileged containers and limiting host access.
  • Restricted: The strictest level, ensuring secure defaults and enforcing best practices for running containers.

While PSA is effective for basic security requirements, it lacks flexibility when enforcing fine-grained or custom policies. We have a full article covering this topic that you can read here.

Kyverno vs. PSA: Key Differences

Kyverno extends beyond the capabilities of PSA by offering more granular control and flexibility. Here’s how it compares:

  1. Policy Types: While PSA focuses solely on security, Kyverno allows the creation of policies for validation, mutation, and generation of resources. This means you can modify or generate new resources, not just enforce security rules.
  2. Customizability: Kyverno supports custom policies that can enforce your organization’s compliance requirements. You can write policies that govern specific resource types, such as ensuring that all deployments have certain labels or that container images come from a trusted registry.
  3. Policy as Code: Kyverno policies are written in YAML, allowing for easy integration with CI/CD pipelines and GitOps workflows. This makes policy management declarative and version-controlled, which is not the case with PSA.
  4. Audit and Reporting: With Kyverno, you can generate detailed audit logs and reports on policy violations, giving administrators a clear view of how policies are enforced and where violations occur. PSA lacks this built-in reporting capability.
  5. Enforcement and Mutation: While PSA primarily enforces restrictions on pods, Kyverno allows not only validation of configurations but also modification of resources (mutation) when required. This adds an additional layer of flexibility, such as automatically adding annotations or labels.

When to Use Kyverno Over PSA

While PSA might be sufficient for simpler environments, Kyverno becomes a valuable tool in scenarios requiring:

  • Custom Compliance Rules: For example, enforcing that all containers use a specific base image or restricting specific container capabilities across different environments.
  • CI/CD Integrations: Kyverno can integrate into your CI/CD pipelines, ensuring that resources comply with organizational policies before they are deployed.
  • Complex Governance: When managing large clusters with multiple teams, Kyverno’s policy hierarchy and scope allow for finer control over who can deploy what and how resources are configured.

If your organization needs a more robust and flexible security solution, Kyverno is a better fit compared to PSA’s more generic approach.

Installing Kyverno

To start using Kyverno, you’ll need to install it in your Kubernetes cluster. This is a straightforward process using Helm, which makes it easy to manage and update.

Step-by-Step Installation

Add the Kyverno Helm repository:

    helm repo add kyverno https://kyverno.github.io/kyverno/

    Update Helm repositories:

      helm repo update

      Install Kyverno in your Kubernetes cluster:

        helm install kyverno kyverno/kyverno --namespace kyverno --create-namespace

        Verify the installation:

          kubectl get pods -n kyverno

          After installation, Kyverno will begin enforcing policies across your cluster, but you’ll need to deploy some policies to get started.

          Installing the Kyverno CLI

          Separate from the in-cluster controller, Kyverno ships a CLI (kyverno) used to test and validate policies before they reach a cluster. It is the piece that makes policies reviewable in a pull request rather than discovered in production.

          # macOS / Linux (Homebrew)
          brew install kyverno
          
          # Krew (as a kubectl plugin)
          kubectl krew install kyverno
          
          # Direct binary
          curl -LO https://github.com/kyverno/kyverno/releases/latest/download/kyverno-cli_linux_x86_64.tar.gz
          tar -xvf kyverno-cli_linux_x86_64.tar.gz && sudo mv kyverno /usr/local/bin/

          The two commands worth knowing immediately:

          # Apply a policy against manifests without touching a cluster
          kyverno apply ./policies/ --resource ./manifests/
          
          # Run the policy test suite defined in kyverno-test.yaml
          kyverno test ./policies/

          kyverno apply answers “would this policy have blocked this manifest?” and prints a policy report; kyverno test runs declarative test cases so policies have regression coverage like any other code. Wiring both into CI is covered step by step in integrating the Kyverno CLI into CI/CD pipelines with GitHub Actions.

          The Kyverno Policy Library

          Before writing anything yourself, check the official Kyverno policy library at kyverno.io/policies. It carries several hundred ready-made policies grouped by category — Pod Security Standards equivalents, best-practice rules, multi-tenancy controls, image verification, and cleanup policies. Most teams find that their first ten policies already exist there, and the realistic starting point is to adopt the Pod Security Standards set in audit mode, see what your cluster is already violating, and only then start writing custom rules.

          Deploying Policies with Kyverno

          Kyverno policies are written in YAML, just like Kubernetes resources, which makes them easy to read and manage. You can find several ready-to-use policies from the Kyverno Policy Library, or create your own to match your requirements.

          Here is an example of a simple validation policy that ensures all pods use trusted container images from a specific registry:

          apiVersion: kyverno.io/v1
          kind: ClusterPolicy
          metadata:
            name: require-trusted-registry
          spec:
            validationFailureAction: enforce
            rules:
            - name: check-registry
              match:
                resources:
                  kinds:
                  - Pod
              validate:
                message: "Only images from 'myregistry.com' are allowed."
                pattern:
                  spec:
                    containers:
                    - image: "myregistry.com/*"

          This policy will automatically block the deployment of any pod that uses an image from a registry other than myregistry.com.

          Applying the Policy

          To apply the above policy, save it to a YAML file (e.g., trusted-registry-policy.yaml) and run the following command:

          kubectl apply -f trusted-registry-policy.yaml

          Once applied, Kyverno will enforce this policy across your cluster.

          Viewing Kyverno Policy Reports

          Kyverno generates detailed reports on policy violations, which are useful for audits and tracking policy compliance. To check the reports, you can use the following commands:

          List all Kyverno policy reports:

            kubectl get clusterpolicyreport

            Describe a specific policy report to get more details:

              kubectl describe clusterpolicyreport <report-name>

              These reports can be integrated into your monitoring tools to trigger alerts when critical violations occur.

              Frequently Asked Questions

              What is Kyverno used for?

              Kyverno is a Kubernetes policy engine used to validate, mutate and generate cluster resources. Typical uses are enforcing that pods declare resource limits, blocking images from untrusted registries, requiring labels on namespaces, automatically generating a NetworkPolicy or ConfigMap in every new namespace, and verifying image signatures before a workload is admitted. Policies are written as YAML and applied as Kubernetes objects.

              Kyverno vs OPA Gatekeeper: which should I use?

              Use Kyverno if your policies only target Kubernetes and you want them written in YAML with no new language to learn — it also handles mutation and resource generation natively. Use OPA Gatekeeper if you need highly expressive or programmatic policy logic, or if you want to reuse the same Rego policies outside Kubernetes (APIs, microservices, Terraform). Both are CNCF Graduated and have converged on feature parity for core admission control, so the decision is usually about language and scope rather than capability.

              Is Kyverno free? Who is the company behind it?

              The Kyverno project is free and open source under the Apache-2.0 licence, and it is a CNCF Graduated project, so it is not controlled by a single vendor. It was created by Nirmata, who remain the largest contributor and offer commercial support and long-term support. Several other vendors also provide commercial Kyverno support, including Giant Swarm, InfraCloud, BlakYaks and Kodekloud.

              How do I install the Kyverno CLI?

              The quickest routes are brew install kyverno on macOS or Linux, or kubectl krew install kyverno to use it as a kubectl plugin. Binaries for each platform are also published on the GitHub releases page. The CLI is separate from the in-cluster controller: it is used to run kyverno apply and kyverno test against manifests in CI, before policies ever reach a cluster.

              Do I still need Kyverno now that Kubernetes has ValidatingAdmissionPolicy?

              For simple rules, often not — ValidatingAdmissionPolicy with CEL is built into Kubernetes, needs no extra components, and should be your first choice when the rule can be expressed in CEL. But CEL cannot make external calls or maintain state, and it only validates. Image-signature verification, cross-resource lookups, mutating resources on admission and generating new resources all still require Kyverno or Gatekeeper. Many clusters run both.

              What is the difference between Kyverno and Pod Security Admission?

              Pod Security Admission is built into Kubernetes and enforces the three fixed Pod Security Standards profiles (privileged, baseline, restricted) at namespace level. It is simple but not extensible — you cannot add a rule of your own. Kyverno is a general policy engine: it can reproduce the PSS profiles and then go further with custom rules, mutation and generation, and it applies to any resource type rather than pods alone.

              Conclusion

              Kyverno offers a flexible and powerful way to enforce policies in Kubernetes, making it an essential tool for organizations that need more than the basic capabilities provided by PSA. Whether you need to ensure compliance with internal security standards, automate resource modifications, or integrate policies into CI/CD pipelines, Kyverno’s extensive feature set makes it a go-to choice for Kubernetes governance.

              For now, start with the out-of-the-box policies available in Kyverno’s library. In future posts, we’ll dive deeper into creating custom policies tailored to your specific needs.

              📚 Want to dive deeper into Kubernetes? This article is part of our comprehensive Kubernetes Architecture Patterns guide, where you’ll find all fundamental and advanced concepts explained step by step.

              Kubernetes Pod Security Admission Explained: Enforcing PSA Policies the Right Way

              Kubernetes Pod Security Admission Explained: Enforcing PSA Policies the Right Way

              In Kubernetes, security is a key concern, especially as containers and microservices grow in complexity. One of the essential features of Kubernetes for policy enforcement is Pod Security Admission (PSA), which replaces the deprecated Pod Security Policies (PSP). PSA provides a more straightforward and flexible approach to enforce security policies, helping administrators safeguard clusters by ensuring that only compliant pods are allowed to run.

              Related reading: the 2026 Kubernetes hardening guide.

              This article will guide you through PSA, the available Pod Security Standards, how to configure them, and how to apply security policies to specific namespaces using labels.

              What is Pod Security Admission (PSA)?

              PSA is a built-in admission controller introduced in Kubernetes 1.23 to replace Pod Security Policies (PSPs). PSPs had a steep learning curve and could become cumbersome when scaling security policies across various environments. PSA simplifies this process by applying Kubernetes Pod Security Standards based on predefined security levels without needing custom logic for each policy.

              With PSA, cluster administrators can restrict the permissions of pods by using labels that correspond to specific Pod Security Standards. PSA operates at the namespace level, enabling better granularity in controlling security policies for different workloads.

              Pod Security Standards

              Kubernetes provides three key Pod Security Standards in the PSA framework:

              • Privileged: No restrictions; permits all features and is the least restrictive mode. This is not recommended for production workloads but can be used in controlled environments or for workloads requiring elevated permissions.
              • Baseline: Provides a good balance between usability and security, restricting the most dangerous aspects of pod privileges while allowing common configurations. It is suitable for most applications that don’t need special permissions.
              • Restricted: The most stringent level of security. This level is intended for workloads that require the highest level of isolation and control, such as multi-tenant clusters or workloads exposed to the internet.

              Each standard includes specific rules to limit pod privileges, such as disallowing privileged containers, restricting access to the host network, and preventing changes to certain security contexts.

              Setting Up Pod Security Admission (PSA)

              To enable PSA, you need to label your namespaces based on the security level you want to enforce. The label format is as follows:

              kubectl label --overwrite ns  pod-security.kubernetes.io/enforce=<value>

              For example, to enforce a restricted security policy on the production namespace, you would run:

              kubectl label --overwrite ns production pod-security.kubernetes.io/enforce=restricted

              In this example, Kubernetes will automatically apply the rules associated with the restricted policy to all pods deployed in the production namespace.

              Additional PSA Modes

              PSA also provides additional modes for greater control:

              • Audit: Logs a policy violation but allows the pod to be created.
              • Warn: Issues a warning but permits the pod creation.
              • Enforce: Blocks pod creation if it violates the policy.

              To configure these modes, use the following labels:

              kubectl label --overwrite ns      pod-security.kubernetes.io/enforce=baseline     pod-security.kubernetes.io/audit=restricted     pod-security.kubernetes.io/warn=baseline

              This setup enforces the baseline standard while issuing warnings and logging violations for restricted-level rules.

              Example: Configuring Pod Security in a Namespace

              Let’s walk through an example of configuring baseline security for the dev namespace. First, you need to apply the PSA labels:

              kubectl create namespace dev
              kubectl label --overwrite ns dev pod-security.kubernetes.io/enforce=baseline

              Now, any pod deployed in the dev namespace will be checked against the baseline security standard. If a pod violates the baseline policy (for instance, by attempting to run a privileged container), it will be blocked from starting.

              You can also combine warn and audit modes to track violations without blocking pods:

              kubectl label --overwrite ns dev     pod-security.kubernetes.io/enforce=baseline     pod-security.kubernetes.io/warn=restricted     pod-security.kubernetes.io/audit=privileged

              In this case, PSA will allow pods to run if they meet the baseline policy, but it will issue warnings for restricted-level violations and log any privileged-level violations.

              Applying Policies by Default

              One of the strengths of PSA is its simplicity in applying policies at the namespace level, but administrators might wonder if there’s a way to apply a default policy across new namespaces automatically. As of now, Kubernetes does not natively provide an option to apply PSA policies globally by default. However, you can use admission webhooks or automation tools such as OPA Gatekeeper or Kyverno to enforce default policies for new namespaces.

              Conclusion

              Pod Security Admission (PSA) simplifies policy enforcement in Kubernetes clusters, making it easier to ensure compliance with security standards across different environments. By configuring Pod Security Standards at the namespace level and using labels, administrators can control the security level of workloads with ease. The flexibility of PSA allows for efficient security management without the complexity associated with the older Pod Security Policies (PSPs).

              For more details on configuring PSA and Pod Security Standards, check the official Kubernetes PSA documentation and Pod Security Standards documentation.

              📚 Want to dive deeper into Kubernetes? This article is part of our comprehensive Kubernetes Architecture Patterns guide, where you’ll find all fundamental and advanced concepts explained step by step.

              Helm Hooks Explained: Complete Guide to Using Hooks in Helm Charts

              Helm Hooks Explained: Complete Guide to Using Hooks in Helm Charts

              Helm hooks are a powerful yet often misunderstood feature ofHelm Hooks: Complete Guide to Using Hooks in Helm Charts

              Helm hooks are a powerful—but often misunderstood—feature of Helm, the Kubernetes package manager. They allow you to execute Kubernetes resources at specific points in the Helm release lifecycle, enabling advanced deployment workflows, validations, migrations, and cleanups.

              In this complete guide to Helm hooks, you’ll learn:

              • What Helm hooks are and how they work internally
              • All available Helm hooks and when to use each one
              • Real-world use cases with practical examples
              • Best practices and common pitfalls when working with Helm hooks in Kubernetes

              If you build or maintain Helm charts in production, understanding Helm hooks is essential.

              What Are Helm Hooks?

              Helm hooks are Kubernetes resources annotated with special metadata that instruct Helm to execute them at specific lifecycle events, such as:

              • Before or after an install
              • Before or after an upgrade
              • Before or after a rollback
              • During deletion
              • When running tests

              From a technical perspective, Helm hooks are implemented using annotations on standard Kubernetes resources (most commonly Job objects).

              Helm evaluates these annotations during a Helm operation and executes the hooked resources outside the normal install/upgrade flow, giving you fine-grained lifecycle control.

              Available Helm Hooks and Use Cases

              Helm provides several hooks that correspond to different lifecycle stages. Below is a detailed breakdown of all Helm hooks, including execution timing and common use cases.

              1. pre-install

              Execution timing
              After templates are rendered, but before any Kubernetes resources are created.

              Typical use cases

              • Creating prerequisites (ConfigMaps, Secrets)
              • Performing environment validation
              • Preparing external dependencies
              apiVersion: batch/v1
              kind: Job
              metadata:
                name: setup-config
                annotations:
                  "helm.sh/hook": pre-install
              spec:
                template:
                  spec:
                    containers:
                      - name: config-creator
                        image: busybox
                        command: ['sh', '-c', 'echo "config data" > /config/config.txt']
                    restartPolicy: Never

              2. post-install

              Execution timing
              After all resources have been successfully created.

              Typical use cases

              • Database initialization
              • Data seeding
              • Post-deployment verification
              apiVersion: batch/v1
              kind: Job
              metadata:
                name: init-database
                annotations:
                  "helm.sh/hook": post-install
              spec:
                template:
                  spec:
                    containers:
                      - name: db-init
                        image: busybox
                        command: ['sh', '-c', 'init-db-command']
                    restartPolicy: Never

              3. pre-delete

              Execution timing
              Triggered before Helm deletes any resources.

              Typical use cases

              • Backups
              • Graceful shutdowns
              • External cleanup preparation
              apiVersion: batch/v1
              kind: Job
              metadata:
                name: backup-before-delete
                annotations:
                  "helm.sh/hook": pre-delete
              spec:
                template:
                  spec:
                    containers:
                      - name: backup
                        image: busybox
                        command: ['sh', '-c', 'backup-command']
                    restartPolicy: Never

              4. post-delete

              Execution timing
              After all release resources have been deleted.

              Typical use cases

              • Cleaning up cloud resources
              • Removing external state
              • Audit logging
              apiVersion: batch/v1
              kind: Job
              metadata:
                name: cleanup
                annotations:
                  "helm.sh/hook": post-delete
              spec:
                template:
                  spec:
                    containers:
                      - name: cleanup
                        image: busybox
                        command: ['sh', '-c', 'cleanup-command']
                    restartPolicy: Never

              5. pre-upgrade

              Execution timing
              Before Helm applies any upgrade changes.

              Typical use cases

              • Schema validation
              • Pre-upgrade checks
              • Compatibility verification
              apiVersion: batch/v1
              kind: Job
              metadata:
                name: pre-upgrade-check
                annotations:
                  "helm.sh/hook": pre-upgrade
              spec:
                template:
                  spec:
                    containers:
                      - name: upgrade-check
                        image: busybox
                        command: ['sh', '-c', 'upgrade-check-command']
                    restartPolicy: Never

              6. post-upgrade

              Execution timing
              After all upgraded resources are applied.

              Typical use cases

              • Data migrations
              • Smoke tests
              • Post-upgrade validation
              apiVersion: batch/v1
              kind: Job
              metadata:
                name: post-upgrade-verify
                annotations:
                  "helm.sh/hook": post-upgrade
              spec:
                template:
                  spec:
                    containers:
                      - name: verification
                        image: busybox
                        command: ['sh', '-c', 'verify-upgrade']
                    restartPolicy: Never

              7. pre-rollback

              Execution timing
              Before Helm reverts to a previous release revision.

              Typical use cases

              • Data snapshots
              • Notifications
              • Rollback preparation
              apiVersion: batch/v1
              kind: Job
              metadata:
                name: pre-rollback-backup
                annotations:
                  "helm.sh/hook": pre-rollback
              spec:
                template:
                  spec:
                    containers:
                      - name: backup
                        image: busybox
                        command: ['sh', '-c', 'rollback-backup']
                    restartPolicy: Never

              8. post-rollback

              Execution timing
              After rollback resources are restored.

              Typical use cases

              • State verification
              • Alerting
              • Post-incident actions
              apiVersion: batch/v1
              kind: Job
              metadata:
                name: post-rollback-verify
                annotations:
                  "helm.sh/hook": post-rollback
              spec:
                template:
                  spec:
                    containers:
                      - name: verify
                        image: busybox
                        command: ['sh', '-c', 'verify-rollback']
                    restartPolicy: Never

              9. test

              Execution timing
              Executed only when running helm test.

              Typical use cases

              • Integration tests
              • Health checks
              • End-to-end validation
              apiVersion: batch/v1
              kind: Job
              metadata:
                name: test-application
                annotations:
                  "helm.sh/hook": test
              spec:
                template:
                  spec:
                    containers:
                      - name: test
                        image: busybox
                        command: ['sh', '-c', 'run-tests']
                    restartPolicy: Never

              Helm Hook Annotations Explained

              Helm provides additional annotations to control hook behavior:

              • helm.sh/hook-weight
                Controls execution order. Lower values run first.
              • helm.sh/hook-delete-policy
                Determines when hook resources are deleted:
                • hook-succeeded
                • hook-failed
                • before-hook-creation
              • helm.sh/resource-policy: keep
                Prevents Helm from deleting the resource, useful for debugging.

              These annotations are critical for avoiding orphaned jobs and unexpected hook behavior.

              Best Practices for Using Helm Hooks

              ✔ Use hooks sparingly — avoid overloading charts with logic
              ✔ Prefer idempotent hook jobs
              ✔ Always define restartPolicy: Never for Jobs
              ✔ Clean up hook resources with hook-delete-policy
              ✔ Avoid using hooks for core application logic

              Conclusion

              Helm hooks give you precise control over the Kubernetes deployment lifecycle, making them invaluable for advanced Helm charts and production workflows. When used correctly, they enable safer upgrades, cleaner rollbacks, and more reliable deployments.

              FAQ & Takeaways

              What are Helm hooks?

              Helm hooks are Kubernetes resources annotated so that Helm executes them at specific points in the release lifecycle (e.g., before or after install, upgrade, delete). They allow you to prepare prerequisites, run jobs, or clean up resources.

              How do I use Helm hooks in my Helm charts?

              You add helm.sh/hook annotations to Kubernetes manifests in your chart. These annotations tell Helm when to run the resource (pre-install, post-install, pre-delete, etc.). Jobs are commonly used to implement hook tasks.

              When should I use pre-install vs post-install hooks?

              Use a pre-install hook when you need to create prerequisites (like ConfigMaps or Secrets) or validate the environment before deploying. Use a post-install hook when you need to initialize a database, seed data, or run verification jobs after the chart is installed.

              Are Helm hooks removed automatically?

              By default, hook resources are deleted after execution, but you can control this with the helm.sh/hook-delete-policy annotation (e.g., hook-succeeded, hook-failed, before-hook-creation) or keep them for debugging with helm.sh/resource-policy: keep.

              What is the difference between Helm hooks and Helm tests?

              Helm hooks run automatically at specified lifecycle events (install, upgrade, delete, rollback), whereas Helm tests run only when you invoke helm test. Tests are used to validate the health or functionality of your deployment.

              To deepen your Helm expertise, check out our
              👉 comprehensive Helm charts guide

              Advanced Helm Commands and Flags Every Kubernetes Engineer Should Know

              Advanced Helm Commands and Flags Every Kubernetes Engineer Should Know

              Managing Kubernetes resources effectively can sometimes feel overwhelming, but Helm, the Kubernetes package manager, offers several commands and flags that make the process smoother and more intuitive. In this article, we’ll dive into some lesser-known Helm commands and flags, explaining their uses, benefits, and practical examples.

              These advanced commands are essential for mastering Helm in production. For the complete toolkit including fundamentals, testing, and deployment patterns, visit our Helm package management guide.

              1. helm get values: Retrieving Deployed Chart Values

              The helm get values command is essential when you need to see the configuration values of a deployed Helm chart. This is particularly useful when you have a chart deployed but lack access to its original configuration file. With this command, you can achieve an “Infrastructure as Code” approach by capturing the current state of your deployment.

              Usage:

              helm get values <release-name> [flags]

              Example:

              To get the values of a deployed chart named my-release:

              helm get values my-release --namespace my-namespace

              This command outputs the current values used for the deployment, which is valuable for documentation, replicating the environment, or modifying deployments.

              2. Understanding helm upgrade Flags: --reset-values, --reuse-values, and --reset-then-reuse

              The helm upgrade command is typically used to upgrade or modify an existing Helm release. However, the behavior of this command can be finely tuned using several flags: --reset-values, --reuse-values, and --reset-then-reuse.

              • --reset-values: Ignores the previous values and uses only the values provided in the current command. Use this flag when you want to override the existing configuration entirely.

              Example Scenario: You are deploying a new version of your application, and you want to ensure that no old values are retained.

                helm upgrade my-release my-chart --reset-values --set newKey=newValue
              • --reuse-values: Reuses the previous release’s values and merges them with any new values provided. This flag is useful when you want to keep most of the old configuration but apply a few tweaks.

              Example Scenario: You need to add a new environment variable to an existing deployment without affecting the other settings.

                helm upgrade my-release my-chart --reuse-values --set newEnv=production
              • --reset-then-reuse: A combination of the two. It resets to the original values and then merges the old values back, allowing you to start with a clean slate while retaining specific configurations.

              Example Scenario: Useful in complex environments where you want to ensure the chart is using the original default settings but retain some custom values.

                helm upgrade my-release my-chart --reset-then-reuse --set version=2.0

              3. helm lint: Ensuring Chart Quality in CI/CD Pipelines

              The helm lint command checks Helm charts for syntax errors, best practices, and other potential issues. This is especially useful when integrating Helm into a CI/CD pipeline, as it ensures your charts are reliable and adhere to best practices before deployment.

              Usage:

              helm lint <chart-path> [flags]
              • <chart-path>: Path to the Helm chart you want to validate.

              Example:

              helm lint ./my-chart/

              This command scans the my-chart directory for issues like missing fields, incorrect YAML structure, or deprecated usage. If you’re automating deployments, integrating helm lint into your pipeline helps catch problems early. By adding this command in your CICD pipeline, you ensure that any syntax or structural issues are caught before proceeding to build or deployment stages. You can lear more about helm testing in the linked article

              4. helm rollback: Reverting to a Previous Release

              The helm rollback command allows you to revert a release to a previous version. This can be incredibly useful in case of a failed upgrade or deployment, as it provides a way to quickly restore a known good state.

              Usage:

              helm rollback <release-name> [revision] [flags]
              • [revision]: The revision number to which you want to roll back. If omitted, Helm will roll back to the previous release by default.

              Example:

              To roll back a release named my-release to its previous version:

              helm rollback my-release

              To roll back to a specific revision, say revision 3:

              helm rollback my-release 3

              This command can be a lifesaver when a recent change breaks your application, allowing you to quickly restore service continuity while investigating the issue.

              5. helm verify: Validating a Chart Before Use

              The helm verify command checks the integrity and validity of a chart before it is deployed. This command ensures that the chart’s package file has not been tampered with or corrupted. It’s particularly useful when you are pulling charts from external repositories or using charts shared across multiple teams.

              Usage:

              helm verify <chart-path>

              Example:

              To verify a downloaded chart named my-chart:

              helm verify ./my-chart.tgz

              If the chart passes the verification, Helm will output a success message. If it fails, you’ll see details of the issues, which could range from missing files to checksum mismatches.

              Conclusion

              Leveraging these advanced Helm commands and flags can significantly enhance your Kubernetes management capabilities. Whether you are retrieving existing deployment configurations, fine-tuning your Helm upgrades, or ensuring the quality of your charts in a CI/CD pipeline, these tricks help you maintain a robust and efficient Kubernetes environment.

              Five More Flags Worth Knowing

              helm template --show-only templates/deployment.yaml renders a single template instead of the whole chart — the fastest way to debug one manifest without scrolling through hundreds of lines.

              helm get manifest myrelease --revision 3 shows exactly what revision 3 deployed. Combined with diff <(helm get manifest r --revision 3) <(helm get manifest r --revision 4) you get a precise answer to “what changed between these two upgrades”.

              helm status myrelease -o json makes release state scriptable — jq -r .info.status in CI gates is cleaner than parsing human output.

              helm lint --strict turns warnings into errors. Without --strict, lint passes charts that will annoy you later; in CI there is no reason not to use it.

              --post-renderer pipes Helm’s rendered output through any executable before applying — the standard escape hatch for applying kustomize patches to third-party charts you do not control, without forking them.

              And one plugin that saves upgrades: mapkubeapis (helm plugin install https://github.com/helm/helm-mapkubeapis) rewrites release metadata that references Kubernetes APIs removed in newer versions — the fix for upgrades failing with “unable to build kubernetes objects” after a cluster upgrade.

              Frequently Asked Questions

              How do I see what a Helm release will change before applying it?

              Use helm diff upgrade (from the helm-diff plugin) to see a rendered diff against the live release, or helm upgrade --dry-run --debug for the rendered manifests. For a diff against what is actually running in the cluster, helm get manifest piped to kubectl diff -f - works without plugins.

              What does helm upgrade –reuse-values actually do?

              It merges your new --set/-f overrides on top of the values stored from the previous release, ignoring any changes in the chart’s default values.yaml. That last part surprises people: after a chart version bump, new defaults do not apply. Prefer --reset-then-reuse-values or explicit values files in CI.

              How can I roll back a Helm release to a specific revision?

              helm history <release> lists revisions; helm rollback <release> <revision> restores one. The rollback itself creates a new revision, so the history is never rewritten — and --cleanup-on-fail removes resources created by the failed upgrade.

              How do I get the values a deployed release was installed with?

              helm get values <release> shows the user-supplied values; add --all to include chart defaults. Combined with helm get manifest, that reconstructs exactly what was deployed and why.

              Exposing TCP Ports with Istio Ingress Gateway in Kubernetes (Step-by-Step Guide)

              Exposing TCP Ports with Istio Ingress Gateway in Kubernetes (Step-by-Step Guide)

              Istio has become an essential tool for managing HTTP traffic within Kubernetes clusters, offering advanced features such as Canary Deployments, mTLS, and end-to-end visibility. However, some tasks, like exposing a TCP port using the Istio IngressGateway, can be challenging if you’ve never done it before. This article will guide you through the process of exposing TCP ports with Istio Ingress Gateway, complete with real-world examples and practical use cases.

              Understanding the Context

              Istio is often used to manage HTTP traffic in Kubernetes, providing powerful capabilities such as traffic management, security, and observability. The Istio IngressGateway serves as the entry point for external traffic into the Kubernetes cluster, typically handling HTTP and HTTPS traffic. However, Istio also supports TCP traffic, which is necessary for use cases like exposing databases or other non-HTTP services running in the cluster to external consumers.

              Exposing a TCP port through Istio involves configuring the IngressGateway to handle TCP traffic and route it to the appropriate service. This setup is particularly useful in scenarios where you need to expose services like TIBCO EMS or Kubernetes-based databases to other internal or external applications.

              Steps to Expose a TCP Port with Istio IngressGateway

              1.- Modify the Istio IngressGateway Service:

              Before configuring the Gateway, you must ensure that the Istio IngressGateway service is configured to listen on the new TCP port. This step is crucial if you’re using a NodePort service, as this port needs to be opened on the Load Balancer.

                 apiVersion: v1
                 kind: Service
                 metadata:
               name: istio-ingressgateway
               namespace: istio-system
                 spec:
               ports:
               - name: http2
                 port: 80
                 targetPort: 80
               - name: https
                 port: 443
                 targetPort: 443
               - name: tcp
                 port: 31400
                 targetPort: 31400
                 protocol: TCP
              

              2.- Update the Istio IngressGateway service to include the new port 31400 for TCP traffic.

              Configure the Istio IngressGateway: After modifying the service, configure the Istio IngressGateway to listen on the desired TCP port.

              apiVersion: networking.istio.io/v1beta1
              kind: Gateway
              metadata:
                name: tcp-ingress-gateway
                namespace: istio-system
              spec:
                selector:
              istio: ingressgateway
                servers:
                - port:
              	  number: 31400
              	  name: tcp
              	  protocol: TCP
              	hosts:
              	- "*"
              

              In this example, the IngressGateway is configured to listen on port 31400 for TCP traffic.

              3.- Create a Service and VirtualService:

              After configuring the gateway, you need to create a Service that represents the backend application and a VirtualService to route the TCP traffic.

              apiVersion: v1
              kind: Service
              metadata:
                name: tcp-service
                namespace: default
              spec:
                ports:
                - port: 31400
              	targetPort: 8080
              	protocol: TCP
                selector:
              app: tcp-app
              

              The Service above maps port 31400 on the IngressGateway to port 8080 on the backend application.

              apiVersion: networking.istio.io/v1beta1
              kind: VirtualService
              metadata:
                name: tcp-virtual-service
                namespace: default
              spec:
                hosts:
                - "*"
                gateways:
                - tcp-ingress-gateway
                tcp:
                - match:
              	- port: 31400
              	route:
              	- destination:
              		host: tcp-service
              		port:
              		  number: 8080
              

              The VirtualService routes TCP traffic coming to port 31400 on the gateway to the tcp-service on port 8080.

              4.- Apply the Configuration

              Apply the above configurations using kubectl to create the necessary Kubernetes resources.

              kubectl apply -f istio-ingressgateway-service.yaml
              kubectl apply -f tcp-ingress-gateway.yaml
              kubectl apply -f tcp-service.yaml
              kubectl apply -f tcp-virtual-service.yaml
              

              After applying these configurations, the Istio IngressGateway will expose the TCP port to external traffic.

              Practical Use Cases

              • Exposing TIBCO EMS Server: One common scenario is exposing a TIBCO EMS (Enterprise Message Service) server running within a Kubernetes cluster to other internal applications or external consumers. By configuring the Istio IngressGateway to handle TCP traffic, you can securely expose EMS’s TCP port, allowing it to communicate with services outside the Kubernetes environment.
              • Exposing Databases: Another use case is exposing a database running within Kubernetes to external services or different clusters. By exposing the database’s TCP port through the Istio IngressGateway, you enable other applications to interact with it, regardless of their location.
              • Exposing a Custom TCP-Based Service: Suppose you have a custom application running within Kubernetes that communicates over TCP, such as a game server or a custom TCP-based API service. You can use the Istio IngressGateway to expose this service to external users, making it accessible from outside the cluster.

              Conclusion

              Exposing TCP ports using the Istio IngressGateway can be a powerful technique for managing non-HTTP traffic in your Kubernetes cluster. With the steps outlined in this article, you can confidently expose services like TIBCO EMS, databases, or custom TCP-based applications to external consumers, enhancing the flexibility and connectivity of your applications.

              ConfigMap Optional Values in Kubernetes: Avoid CreateContainerConfigError

              ConfigMap Optional Values in Kubernetes: Avoid CreateContainerConfigError

              Kubernetes ConfigMaps are a powerful tool for managing configuration data separately from application code. However, they can sometimes lead to issues during deployment, particularly when a ConfigMap referenced in a Pod specification is missing, causing the application to fail to start. This is a common scenario that can lead to a CreateContainerConfigError and halt your deployment pipeline.

              Understanding the Problem

              When a ConfigMap is referenced in a Pod’s specification, Kubernetes expects the ConfigMap to be present. If it is not, Kubernetes will not start the Pod, leading to a failed deployment. This can be problematic in situations where certain configuration data is optional or environment-specific, such as proxy settings that are only necessary in certain environments.

              Making ConfigMap Values Optional

              Kubernetes provides a way to define ConfigMap items as optional, allowing your application to start even if the ConfigMap is not present. This can be particularly useful for environment variables that only need to be set under certain conditions.

              Here’s a basic example of how to make a ConfigMap optional:

              apiVersion: v1
              kind: Pod
              metadata:
                name: example-pod
              spec:
                containers:
                - name: example-container
                  image: nginx
                  env:
                  - name: OPTIONAL_ENV_VAR
                    valueFrom:
                      configMapKeyRef:
                        name: example-configmap
                        key: optional-key
                        optional: true
              

              In this example:

              • name: example-configmap refers to the ConfigMap that might or might not be present.
              • optional: true ensures that the Pod will still start even if example-configmap or the optional-key within it is missing.

              Practical Use Case: Proxy Configuration

              A common use case for optional ConfigMap values is setting environment variables for proxy configuration. In many enterprise environments, proxy settings are only required in certain deployment environments (e.g., staging, production) but not in others (e.g., local development).

              apiVersion: v1
              kind: ConfigMap
              metadata:
                name: proxy-config
              data:
                HTTP_PROXY: "http://proxy.example.com"
                HTTPS_PROXY: "https://proxy.example.com"
              

              In your Pod specification, you could reference these proxy settings as optional:

              apiVersion: v1
              kind: Pod
              metadata:
                name: app-pod
              spec:
                containers:
                - name: app-container
                  image: my-app-image
                  env:
                  - name: HTTP_PROXY
                    valueFrom:
                      configMapKeyRef:
                        name: proxy-config
                        key: HTTP_PROXY
                        optional: true
                  - name: HTTPS_PROXY
                    valueFrom:
                      configMapKeyRef:
                        name: proxy-config
                        key: HTTPS_PROXY
                        optional: true
              

              In this setup, if the proxy-config ConfigMap is missing, the application will still start, simply without the proxy settings.

              Sample Application

              Let’s walk through a simple example to demonstrate this concept. We will create a deployment for an application that uses optional configuration values.

              1. Create the ConfigMap (Optional):
              apiVersion: v1
              kind: ConfigMap
              metadata:
                name: app-config
              data:
                GREETING: "Hello, World!"
              
              1. Deploy the Application:
              apiVersion: apps/v1
              kind: Deployment
              metadata:
                name: hello-world-deployment
              spec:
                replicas: 1
                selector:
                  matchLabels:
                    app: hello-world
                template:
                  metadata:
                    labels:
                      app: hello-world
                  spec:
                    containers:
                    - name: hello-world
                      image: busybox
                      command: ["sh", "-c", "echo $GREETING"]
                      env:
                      - name: GREETING
                        valueFrom:
                          configMapKeyRef:
                            name: app-config
                            key: GREETING
                            optional: true
              
              1. Deploy and Test:
              2. Deploy the application using kubectl apply -f <your-deployment-file>.yaml.
              3. If the app-config ConfigMap is present, the Pod will output “Hello, World!”.
              4. If the ConfigMap is missing, the Pod will start, but no greeting will be echoed.

              Conclusion

              Optional ConfigMap values are a simple yet effective way to make your Kubernetes deployments more resilient and adaptable to different environments. By marking ConfigMap keys as optional, you can prevent deployment failures and allow your applications to handle missing configuration gracefully.

              📚 Want to dive deeper into Kubernetes? This article is part of our comprehensive Kubernetes Architecture Patterns guide, where you’ll find all fundamental and advanced concepts explained step by step.

              Enable ECS Logging in TIBCO BusinessWorks with Logback

              Enable ECS Logging in TIBCO BusinessWorks with Logback

              TIBCO BW ECS Logging Support is becoming one demanded feature based on the increased usage of the Elastic Common Schema for the log aggregation solution based on the Elastic stack (previously known as ELK stack)

              This article is part of my comprehensive TIBCO Integration Platform Guide where you can find more patterns and best practices for TIBCO integration platforms.

              We have already commented a lot about the importance of log aggregation solutions and their benefits, especially when discussing container architecture. Because of that, today, we will focus on how we can adapt our BW applications to support this new logging format.

              Because the first thing that we need to know is the following statement: Yes, this can be done. And it can be done non-dependant on your deployment model. So, the solution provided here works for both on-premises solutions as well as container deployments using BWCE.

              TIBCO BW Logging Background

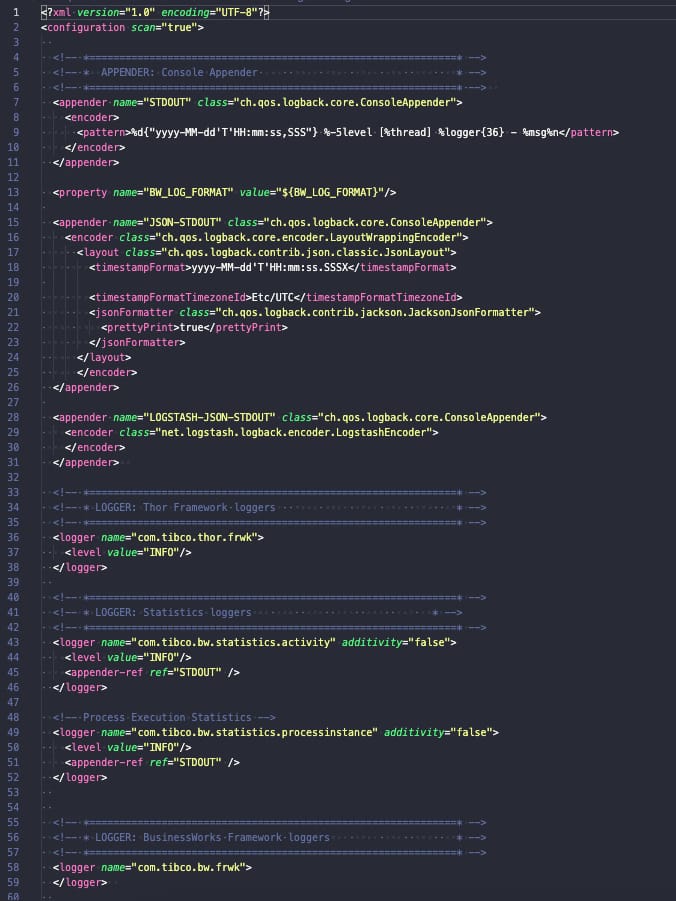
              TIBCO BusinessWorks (container or not) relies on its logging capabilities in the logback library, and this library is configured using a file named logback.xml that could have the configuration that you need, as you can see in the picture below:

              BW ECS Logging: Sample of Logback.xml default config

              Logback is a well-known library for Java-based developments and has an architecture based on a core solution and plug-ins that extend its current capabilities. It’s this plug-in approach that we are going to do to support ECS.

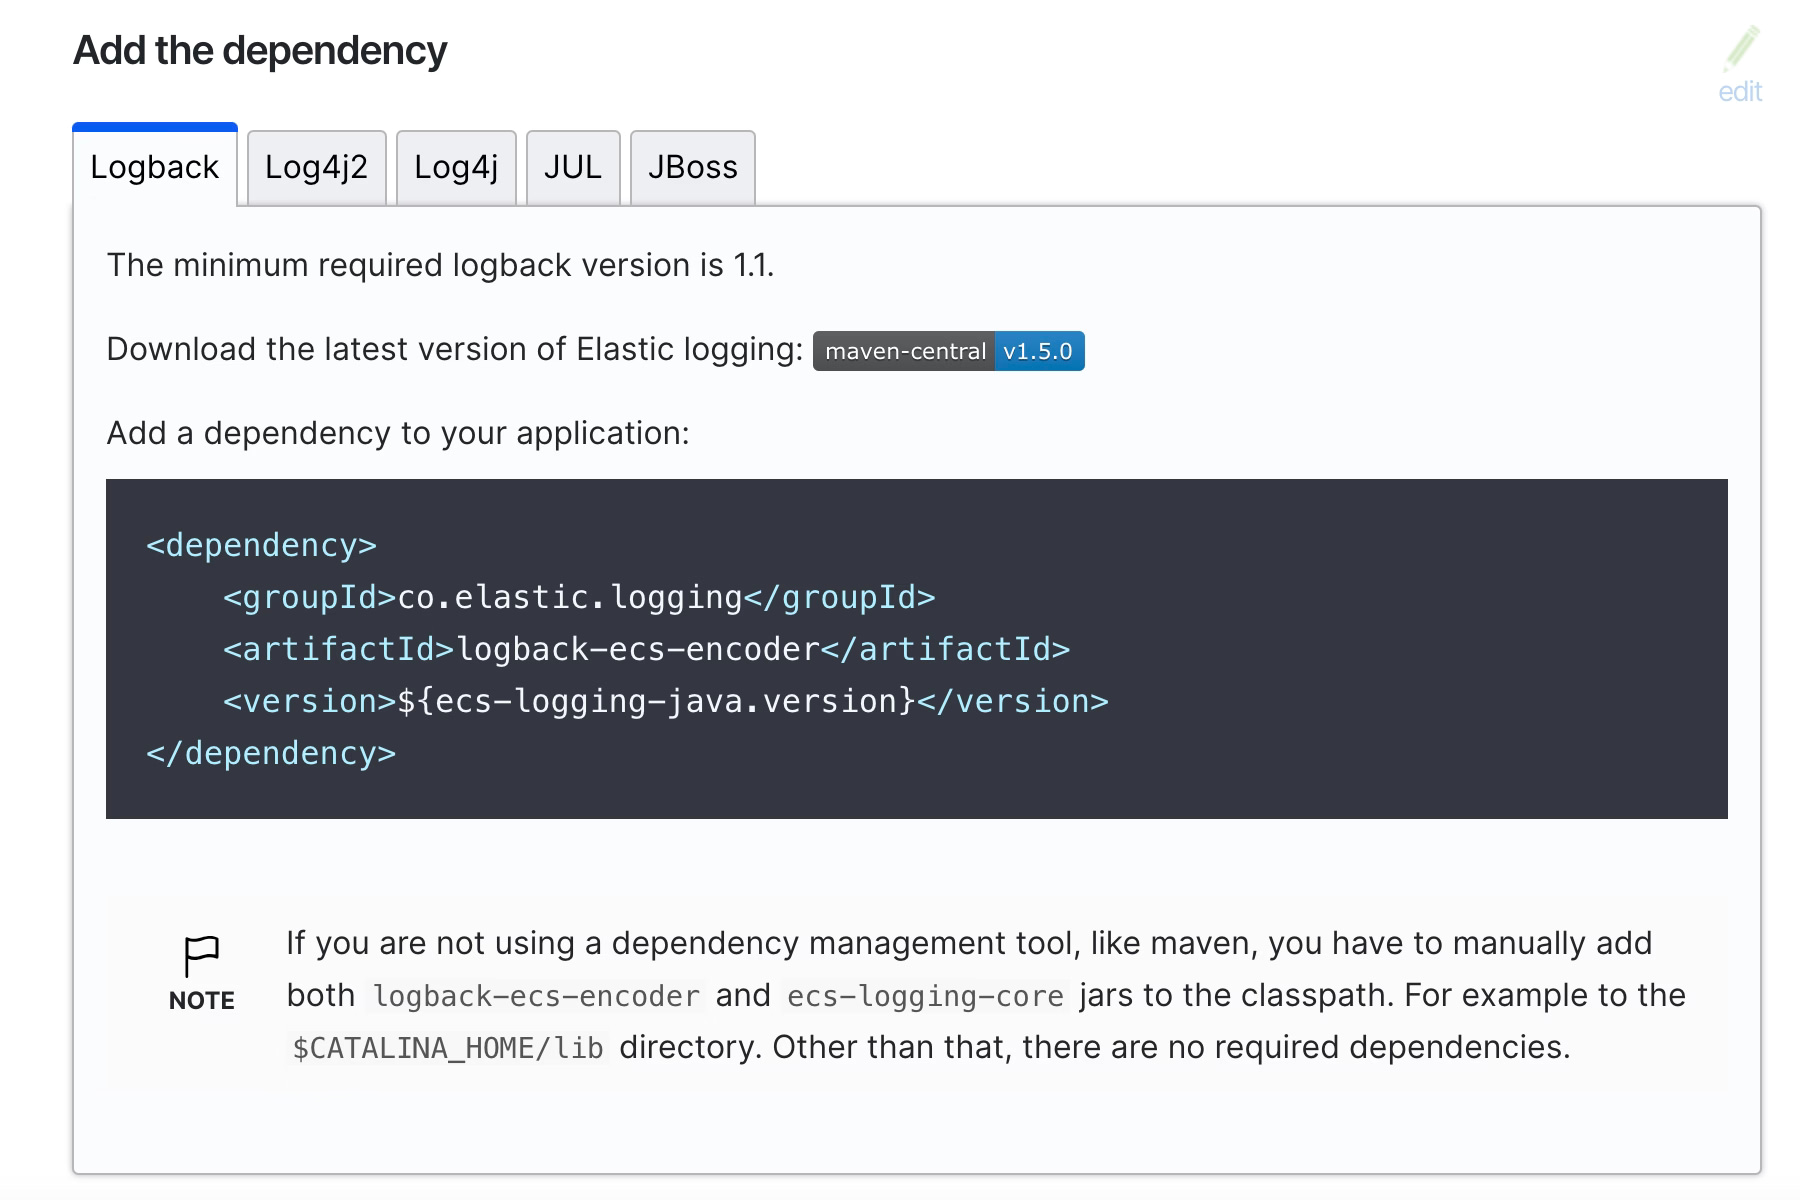
              Even in the ECS Official documentation covers the configuration of enabling this logging configuration when using the Logback solution as you can see in the picture below and this official link:

              BW ECS Logging: ECS Java Dependency Information

              In our case, we don’t need to add the dependency anywhere but just download the dependency, as we will need to include to the existing OSGI bundles for the TIBCO BW installation. We will need just two files that are the following ones:

              • ecs-logging-core-1.5.0.jar
              • logback-ecs-encoder-1.5.0.jar

              At the moment of writing this article, current versions are 1.5.0 for each of them, but keep a look to make sure you’re using a recent version of this software to avoid any problems with support and vulnerabilities.

              Once we have these libraries, we need to add it to the BW system installation, and we need to do it differently if we are using a TIBCO on-premises installation or a TIBCO BW base installation. To be honest, the things we need to do are the same; the process of doing it is different.

              Because, in the end, what we need to do is just a simple task. Include these JAR files as part of the current logback OSGI bundle that TIBCO BW loads. So, let’s see how we can do that and start with an on-premises installation. We will use the TIBCO BWCE 2.8.2 version as an example, but similar steps will be required for other versions.

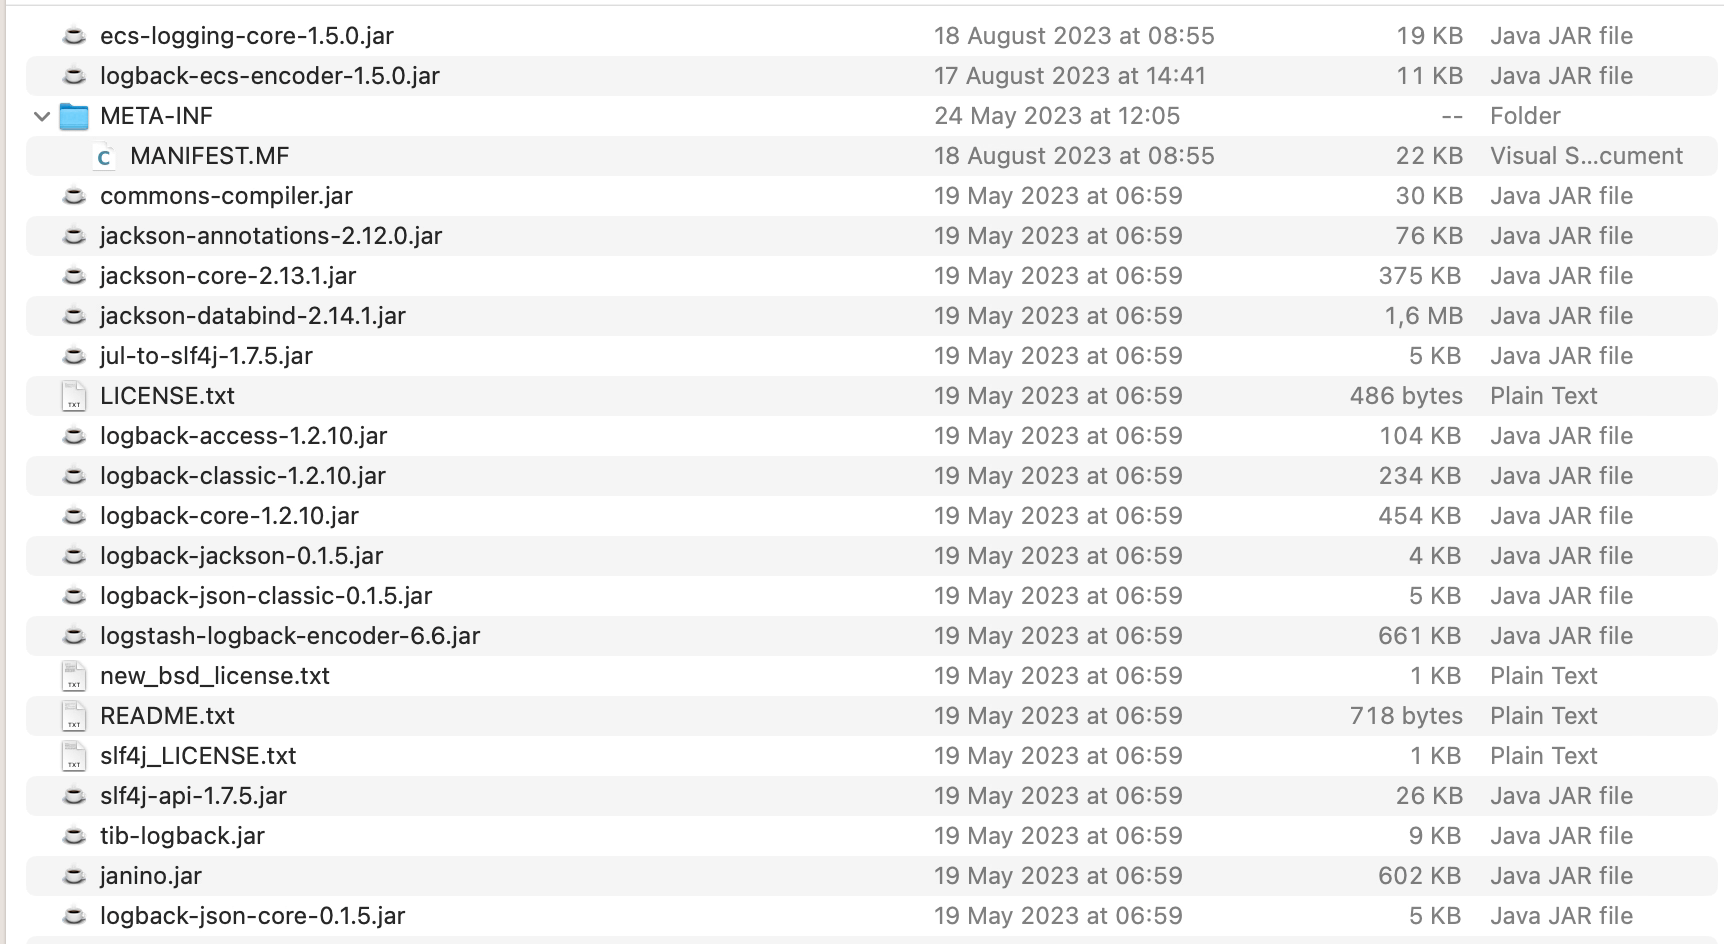
              On-premise installation is the easiest way to do it, but just because it has fewer steps than when we are doing it in a TIBCO BWCE base image. So, in this case, we will go to the following location: <TIBCO_HOME>/bwce/2.8/system/shared/com.tibco.tpcl.logback_1.2.1600.002/

              • We will place the download JARs in that folder
              BW ECS Logging: JAR location
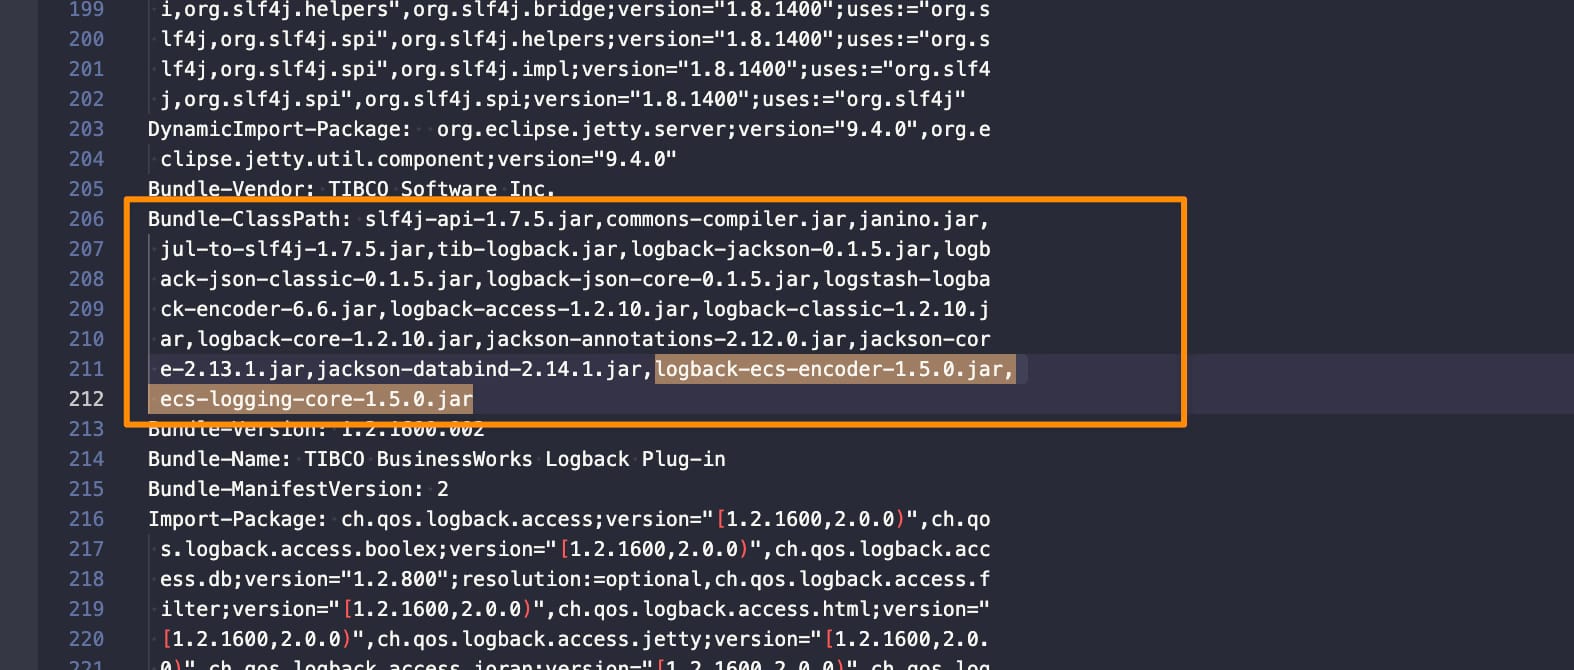
              • We will open the META-INF/MANIFEST.MF and do the following modifications:
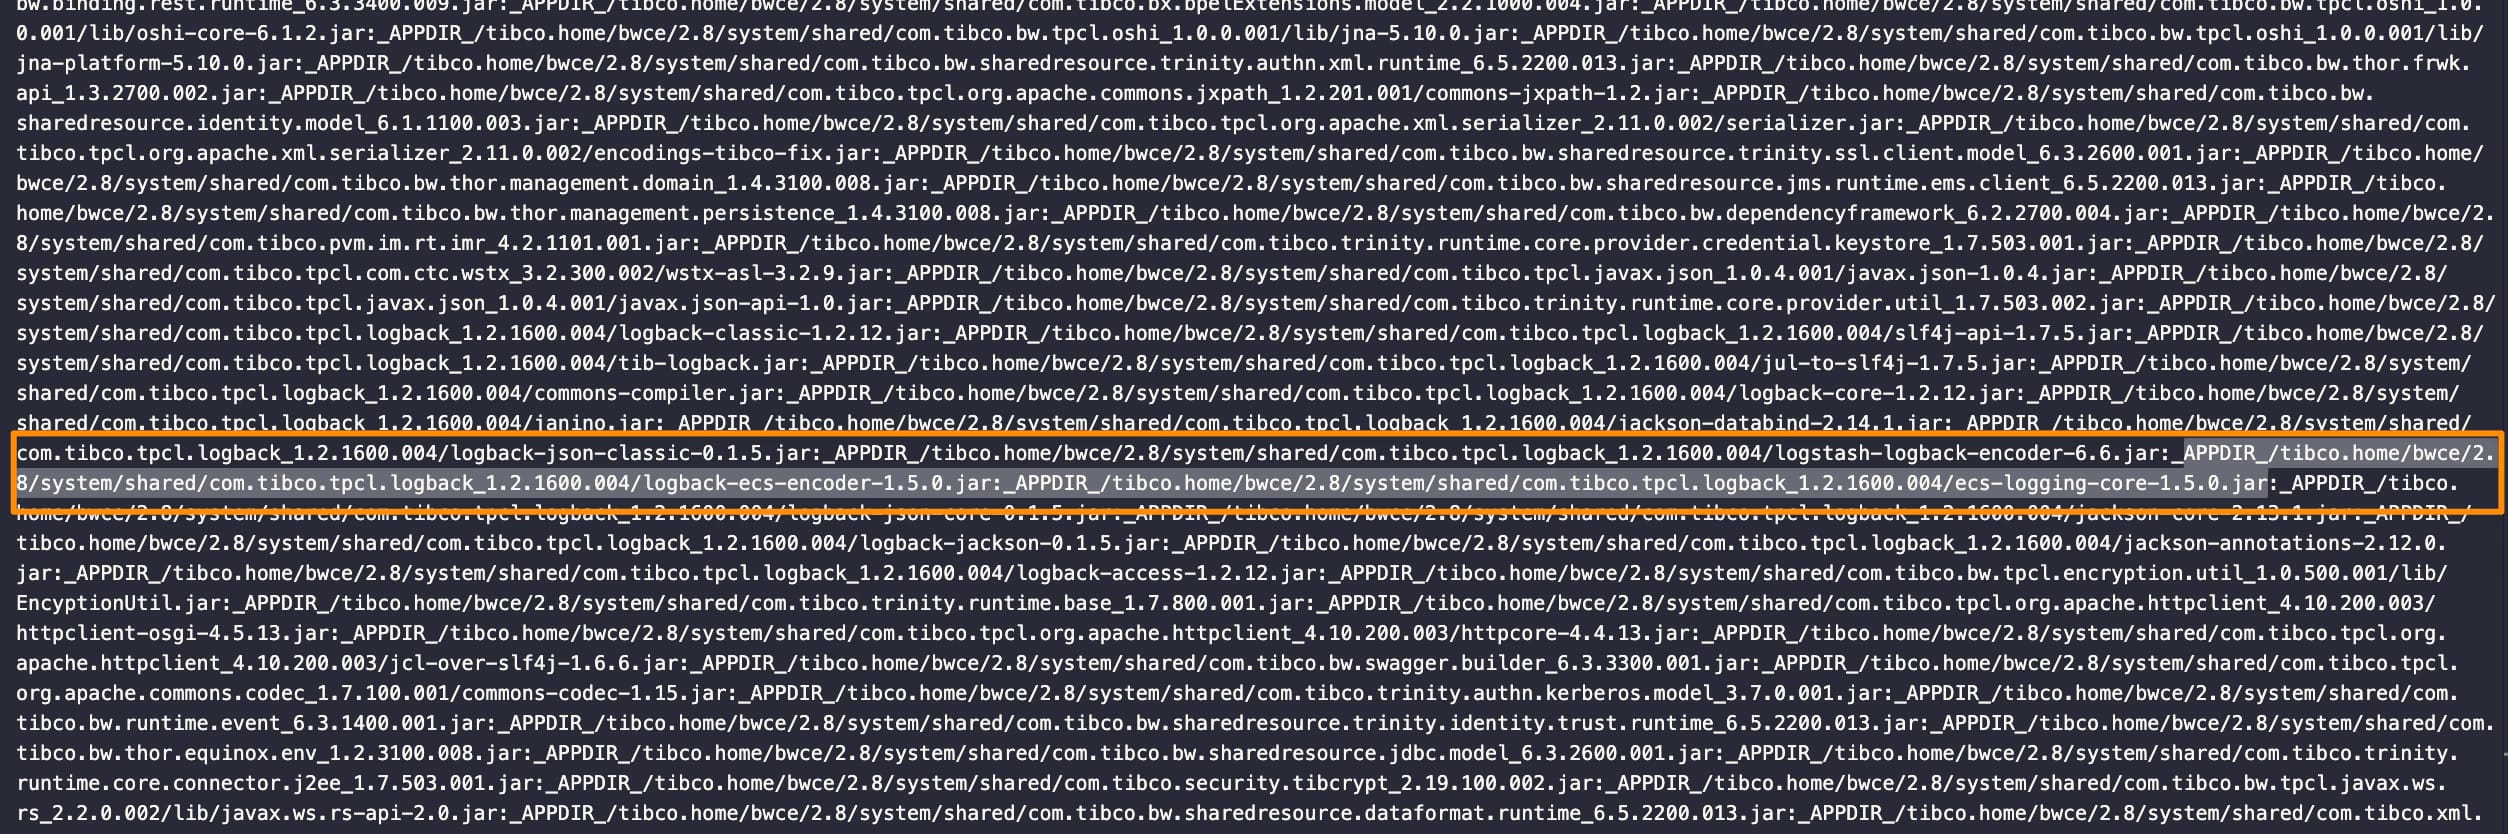
                • Add those JARs to the Bundle-Classpath section:
              BW ECS Logging: Bundle-Classpath changes
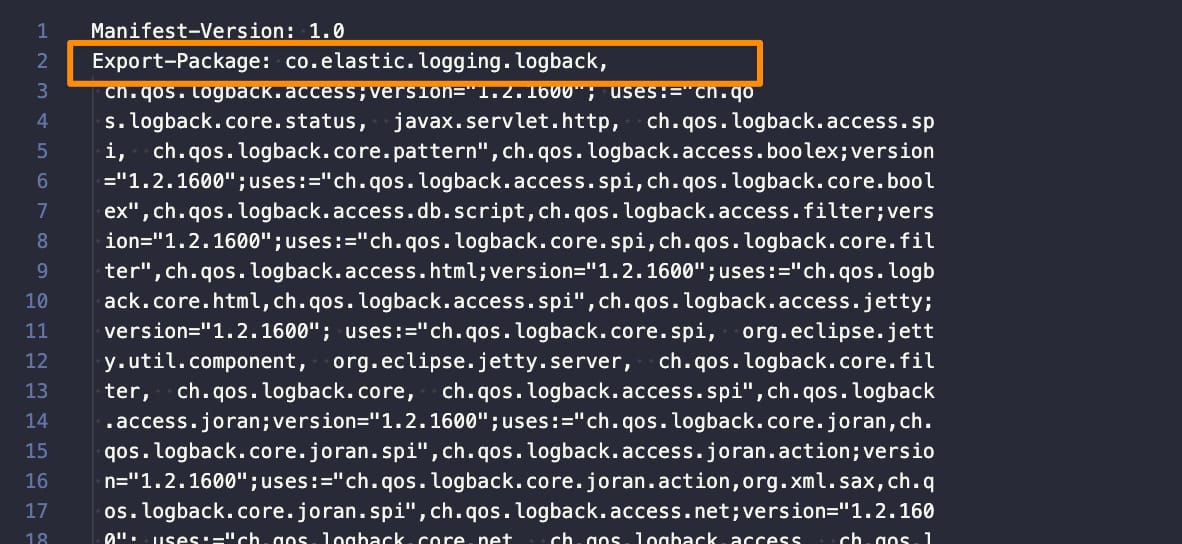
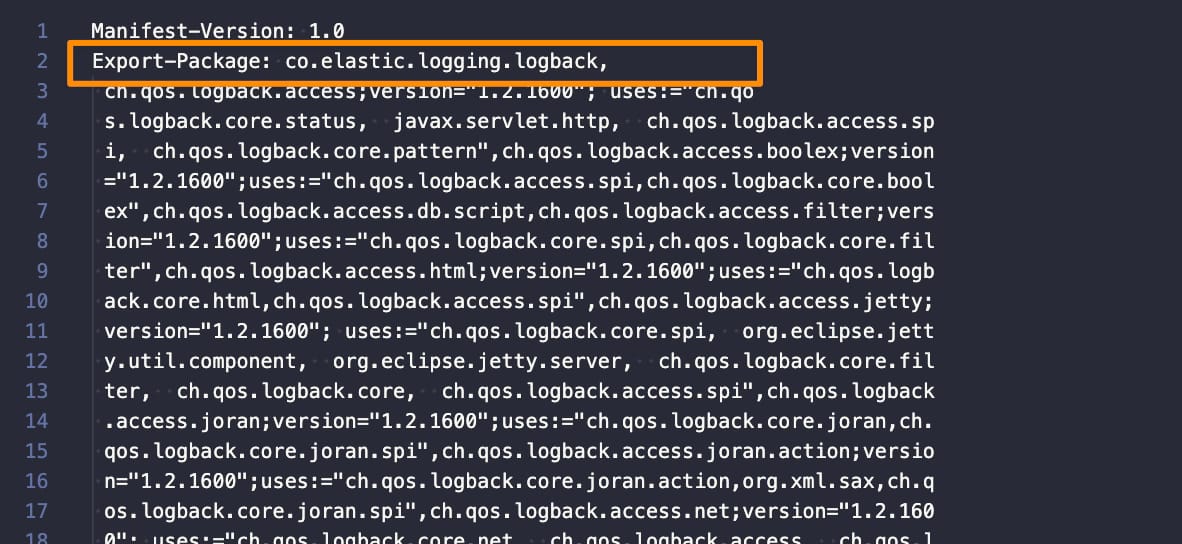
              • Include the following package (co.elastic.logging.logback) as part of the exported packages by adding it to the Exported-packagesection:
              BW ECS Logging: Export-Package changes

              Once this is done, our TIBCO BW installation supports ECS format. and we just need to configure the logback.xml to use it, and we can do that relying on the official documentation on the ECS page. We need to include the following encoder, as shown below:

               <encoder class="co.elastic.logging.logback.EcsEncoder">
                  <serviceName>my-application</serviceName>
                  <serviceVersion>my-application-version</serviceVersion>
                  <serviceEnvironment>my-application-environment</serviceEnvironment>
                  <serviceNodeName>my-application-cluster-node</serviceNodeName>
              </encoder>
              

              For example, if we modify the default logback.xml configuration file with this information, we will have something like this:

              <?xml version="1.0" encoding="UTF-8"?>
              <configuration scan="true">
                
                <!-- *=============================================================* -->
                <!-- *  APPENDER: Console Appender                                 * -->
                <!-- *=============================================================* -->  
                <appender name="STDOUT" class="ch.qos.logback.core.ConsoleAppender">
                  <encoder class="co.elastic.logging.logback.EcsEncoder">
                    <serviceName>a</serviceName>
                    <serviceVersion>b</serviceVersion>
                    <serviceEnvironment>c</serviceEnvironment>
                    <serviceNodeName>d</serviceNodeName>
                </encoder>
                </appender>


                <!-- *=============================================================* -->
                <!-- * LOGGER: Thor Framework loggers                              * -->
                <!-- *=============================================================* -->
                <logger name="com.tibco.thor.frwk">
                  <level value="INFO"/>
                </logger>


                <!-- *=============================================================* -->
                <!-- * LOGGER: BusinessWorks Framework loggers                     * -->
                <!-- *=============================================================* -->
                <logger name="com.tibco.bw.frwk">
                  <level value="WARN"/>
                </logger>  
                
                <logger name="com.tibco.bw.frwk.engine">
                  <level value="INFO"/>
                </logger>   
                
                
                <!-- *=============================================================* -->
                <!-- * LOGGER: BusinessWorks Engine loggers                        * -->
                <!-- *=============================================================* --> 
                <logger name="com.tibco.bw.core">
                  <level value="WARN"/>
                </logger>
                
                <logger name="com.tibco.bx">
                  <level value="ERROR"/>
                </logger>
              
                <logger name="com.tibco.pvm">
                  <level value="ERROR"/>
                </logger>
                
                <logger name="configuration.management.logger">
                  <level value="INFO"/>
                </logger>
                
                
                <!-- *=============================================================* -->
                <!-- * LOGGER: BusinessWorks Palette and Activity loggers          * -->
                <!-- *=============================================================* -->
                
                <!-- Default Log activity logger -->
                <logger name="com.tibco.bw.palette.generalactivities.Log">
                  <level value="DEBUG"/>
                </logger>
                
                <logger name="com.tibco.bw.palette">
                  <level value="ERROR"/>
                </logger>


                <!-- *=============================================================* -->
                <!-- * LOGGER: BusinessWorks Binding loggers                       * -->
                <!-- *=============================================================* -->
                
                <!-- SOAP Binding logger -->
                <logger name="com.tibco.bw.binding.soap">
                  <level value="ERROR"/>
                </logger>
                
                <!-- REST Binding logger -->
                <logger name="com.tibco.bw.binding.rest">
                  <level value="ERROR"/>
                </logger>


                <!-- *=============================================================* -->
                <!-- * LOGGER: BusinessWorks Shared Resource loggers               * -->
                <!-- *=============================================================* --> 
                <logger name="com.tibco.bw.sharedresource">
                  <level value="ERROR"/>
                </logger>


                <!-- *=============================================================* -->
                <!-- * LOGGER: BusinessWorks Schema Cache loggers                  * -->
                <!-- *=============================================================* -->
                <logger name="com.tibco.bw.cache.runtime.xsd">
                  <level value="ERROR"/>
                </logger> 
                
                <logger name="com.tibco.bw.cache.runtime.wsdl">
                  <level value="ERROR"/>
                </logger> 


                <!-- *=============================================================* -->
                <!-- * LOGGER: BusinessWorks Governance loggers                    * -->
                <!-- *=============================================================* -->  
                <!-- Governance: Policy Director logger1 --> 
                <logger name="com.tibco.governance">
                  <level value="ERROR"/>
                </logger>
                 
                <logger name="com.tibco.amx.governance">
                  <level value="WARN"/>
                </logger>
                 
                <!-- Governance: Policy Director logger2 -->
                <logger name="com.tibco.governance.pa.action.runtime.PolicyProperties">
                  <level value="ERROR"/>
                </logger>
                
                <!-- Governance: SPM logger1 -->
                <logger name="com.tibco.governance.spm">
                  <level value="ERROR"/>
                </logger>
                
                <!-- Governance: SPM logger2 -->
                <logger name="rta.client">
                  <level value="ERROR"/>
                </logger>


                <!-- *=============================================================* -->
                <!-- * LOGGER: BusinessWorks Miscellaneous Loggers                 * -->
                <!-- *=============================================================* --> 
                <logger name="com.tibco.bw.platformservices">
                  <level value="INFO"/>
                </logger>
                
                <logger name="com.tibco.bw.core.runtime.statistics">
                  <level value="ERROR"/>
                </logger>


                <!-- *=============================================================* -->
                <!-- * LOGGER: Other loggers                                       * -->
                <!-- *=============================================================* -->  
                <logger name="org.apache.axis2">
                  <level value="ERROR"/>
                </logger>
              
                <logger name="org.eclipse">
                  <level value="ERROR"/>
                </logger>
                
                <logger name="org.quartz">
                  <level value="ERROR"/>
                </logger>
                
                <logger name="org.apache.commons.httpclient.util.IdleConnectionHandler">
                  <level value="ERROR"/>
                </logger>


                <!-- *=============================================================* -->
                <!-- * LOGGER: User loggers.  User's custom loggers should be      * -->
                <!-- *         configured in this section.                         * -->
                <!-- *=============================================================* -->
              
                <!-- *=============================================================* -->
                <!-- * ROOT                                                        * -->
                <!-- *=============================================================* --> 
                <root level="ERROR">
                 <appender-ref ref="STDOUT" />
                </root>
                
              </configuration>


              You can also do more custom configurations based on the information available on the ECS encoder configuration page here.

              How to enable TIBCO BW ECS Logging Support?

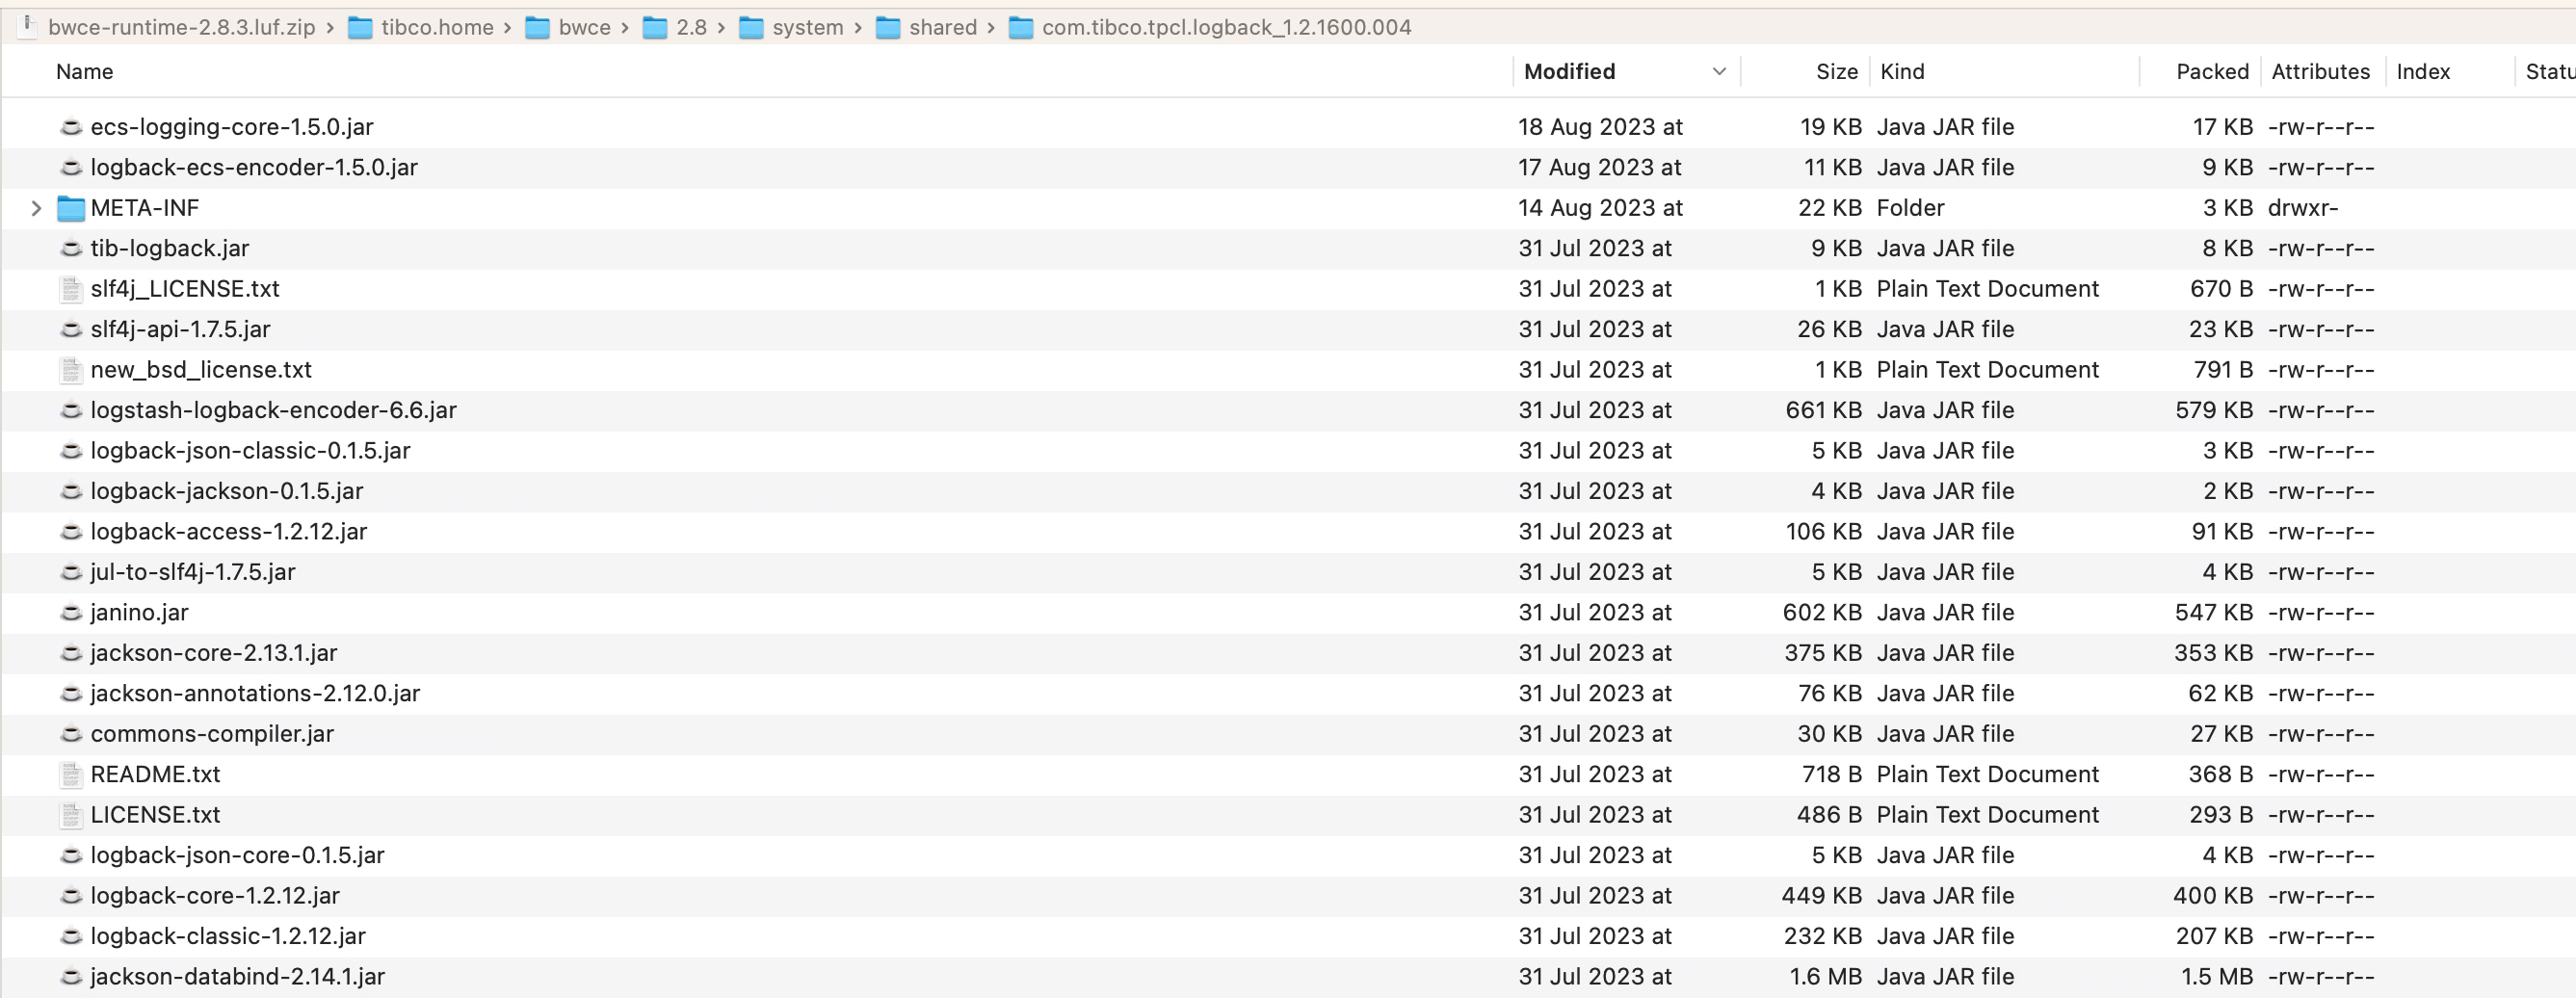
              For BWCE, the steps are similar, but we need to be aware that all the runtime components are packaged inside the base-runtime-version.zip that we download from our TIBCO eDelivery site, so we will need to use a tool to open that ZIP and do the following modifications:

              • We will place the download JARs on that folder /tibco.home/bwce/2.8/system/shared/com.tibco.tpcl.logback_1.2.1600.004
              BW ECS Logging: JAR location
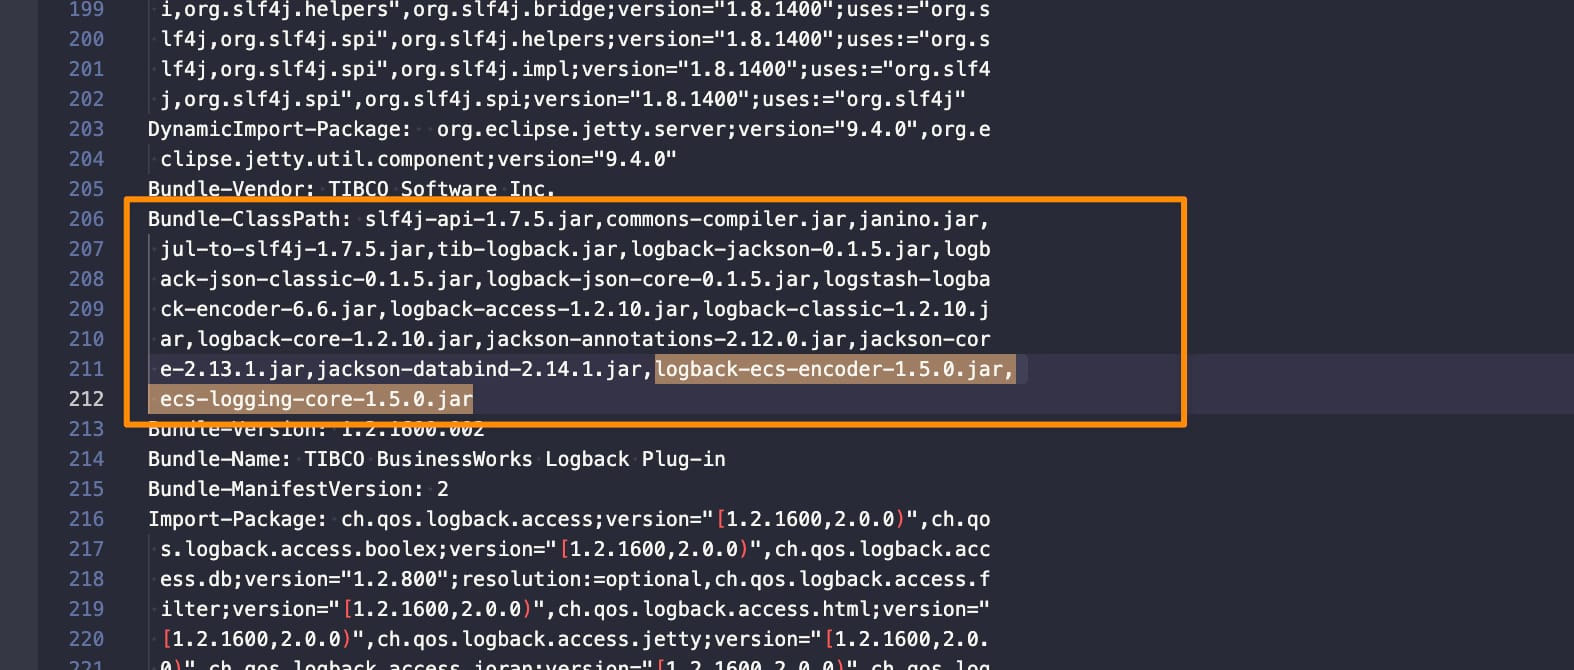
              • We will open the META-INF/MANIFEST.MF and do the following modifications:
                • Add those JARs to the Bundle-Classpath section:
              BW ECS Logging: Bundle-Classpath changes
              • Include the following package (co.elastic.logging.logback) as part of the exported packages by adding it to the Exported-packagesection:
              BW ECS Logging: Export-package changes
              • Additionally we will need to modify the bwappnode in the location /tibco.home/bwce/2.8/bin to add the JAR files also to the classpath that the BWCE base image use to run to ensure this is loading:
              BW ECS Logging: bwappnode change

              Now we can build our BWCE base image as usual and modify the logback.xml as explained above. Here you can see a sample application using this configuration:

              {"@timestamp":"2023-08-28T12:49:08.524Z","log.level": "INFO","message":"TIBCO BusinessWorks version 2.8.2, build V17, 2023-05-19","ecs.version": "1.2.0","service.name":"a","service.version":"b","service.environment":"c","service.node.name":"d","event.dataset":"a","process.thread.name":"main","log.logger":"com.tibco.thor.frwk"}
              
              <>@BWEclipseAppNode> {"@timestamp":"2023-08-28T12:49:25.435Z","log.level": "INFO","message":"Started by BusinessStudio.","ecs.version": "1.2.0","service.name":"a","service.version":"b","service.environment":"c","service.node.name":"d","event.dataset":"a","process.thread.name":"main","log.logger":"com.tibco.thor.frwk.Deployer"}
              {"@timestamp":"2023-08-28T12:49:32.795Z","log.level": "INFO","message":"TIBCO-BW-FRWK-300002: BW Engine [Main] started successfully.","ecs.version": "1.2.0","service.name":"a","service.version":"b","service.environment":"c","service.node.name":"d","event.dataset":"a","process.thread.name":"main","log.logger":"com.tibco.bw.frwk.engine.BWEngine"}
              {"@timestamp":"2023-08-28T12:49:34.338Z","log.level": "INFO","message":"TIBCO-THOR-FRWK-300001: Started OSGi Framework of AppNode [BWEclipseAppNode] in AppSpace [BWEclipseAppSpace] of Domain [BWEclipseDomain]","ecs.version": "1.2.0","service.name":"a","service.version":"b","service.environment":"c","service.node.name":"d","event.dataset":"a","process.thread.name":"Framework Event Dispatcher: Equinox Container: 1395256a-27a2-4e91-b774-310e85b0b87c","log.logger":"com.tibco.thor.frwk.Deployer"}
              {"@timestamp":"2023-08-28T12:49:34.456Z","log.level": "INFO","message":"TIBCO-THOR-FRWK-300018: Deploying BW Application [t3:1.0].","ecs.version": "1.2.0","service.name":"a","service.version":"b","service.environment":"c","service.node.name":"d","event.dataset":"a","process.thread.name":"Framework Event Dispatcher: Equinox Container: 1395256a-27a2-4e91-b774-310e85b0b87c","log.logger":"com.tibco.thor.frwk.Application"}
              {"@timestamp":"2023-08-28T12:49:34.524Z","log.level": "INFO","message":"TIBCO-THOR-FRWK-300021: All Application dependencies are resolved for Application [t3:1.0]","ecs.version": "1.2.0","service.name":"a","service.version":"b","service.environment":"c","service.node.name":"d","event.dataset":"a","process.thread.name":"Framework Event Dispatcher: Equinox Container: 1395256a-27a2-4e91-b774-310e85b0b87c","log.logger":"com.tibco.thor.frwk.Application"}
              {"@timestamp":"2023-08-28T12:49:34.541Z","log.level": "INFO","message":"Started by BusinessStudio, ignoring .enabled settings.","ecs.version": "1.2.0","service.name":"a","service.version":"b","service.environment":"c","service.node.name":"d","event.dataset":"a","process.thread.name":"Framework Event Dispatcher: Equinox Container: 1395256a-27a2-4e91-b774-310e85b0b87c","log.logger":"com.tibco.thor.frwk.Application"}
              {"@timestamp":"2023-08-28T12:49:35.842Z","log.level": "INFO","message":"TIBCO-THOR-FRWK-300006: Started BW Application [t3:1.0]","ecs.version": "1.2.0","service.name":"a","service.version":"b","service.environment":"c","service.node.name":"d","event.dataset":"a","process.thread.name":"EventAdminThread #1","log.logger":"com.tibco.thor.frwk.Application"}
              {"@timestamp":"2023-08-28T12:49:35.954Z","log.level": "INFO","message":"aaaaaaa&#10;","ecs.version": "1.2.0","service.name":"a","service.version":"b","service.environment":"c","service.node.name":"d","event.dataset":"a","process.thread.name":"bwEngThread:In-Memory Process Worker-1","log.logger":"com.tibco.bw.palette.generalactivities.Log.t3.module.Log"}
              gosh: stopping shell
              

              KubeSec Explained: How to Scan and Improve Kubernetes Security with YAML Analysis

              KubeSec Explained: How to Scan and Improve Kubernetes Security with YAML Analysis

              KubeSec is another tool to help improve the security of our Kubernetes cluster. And we’re seeing so many agencies focus on security to highlight this topic’s importance in modern architectures and deployments. Security is a key component now, probably the most crucial. We need all to step up our game on that topic, and that’s why it is essential to have tools in our toolset to help us on that task without being fully security experts on each of the technologies, such as Kubernetes in this case.

              KubeSec is an open-source tool developed by a cloud-native and open-source security consultancy named ControlPlane that helps us perform a security risk analysis on Kubernetes resources.

              How Does KubeSec Work?

              KubeSec works based on the Kubernetes Manifest Files you use to deploy the different resources, so you need to provide the YAML file to one of the running ways this tool supports. This is an important topic, “one of the running ways,” because KubeSec supports many different running modes that help us cover other use cases.

              You can run KubeSec in the following ones:

              • HTTP Mode: KubeSec will be listening to HTTP requests with the content of the YAML and provide a report based on that. This is useful in cases needing server mode execution, such as CICD pipelines, or just security servers to be used by some teams, such as DevOps or Platform Engineering. Also, another critical use-case of this mode is to be part of a Kubernetes Admission Controller on your Kubernetes Cluster so that you can enforce this when developers are deploying resources into the platform itself.
              • SaaS Mode: Similar to HTTP mode but without needing to host it yourself, all available behind kubesec.io kubesec.io when the SaaS mode is of your preference, and you’re not managing sensitive information on those components.
              • CLI Mode: Just to run it yourself as part of your local tests, you will have available another CLI command here: kubesec scan k8s-deployment.yaml
              • Docker Mode: Similar to CLI mode but as part of a docker image, it can also be compatible with the CICD pipelines based on containerized workloads.

              KubeScan Output Report

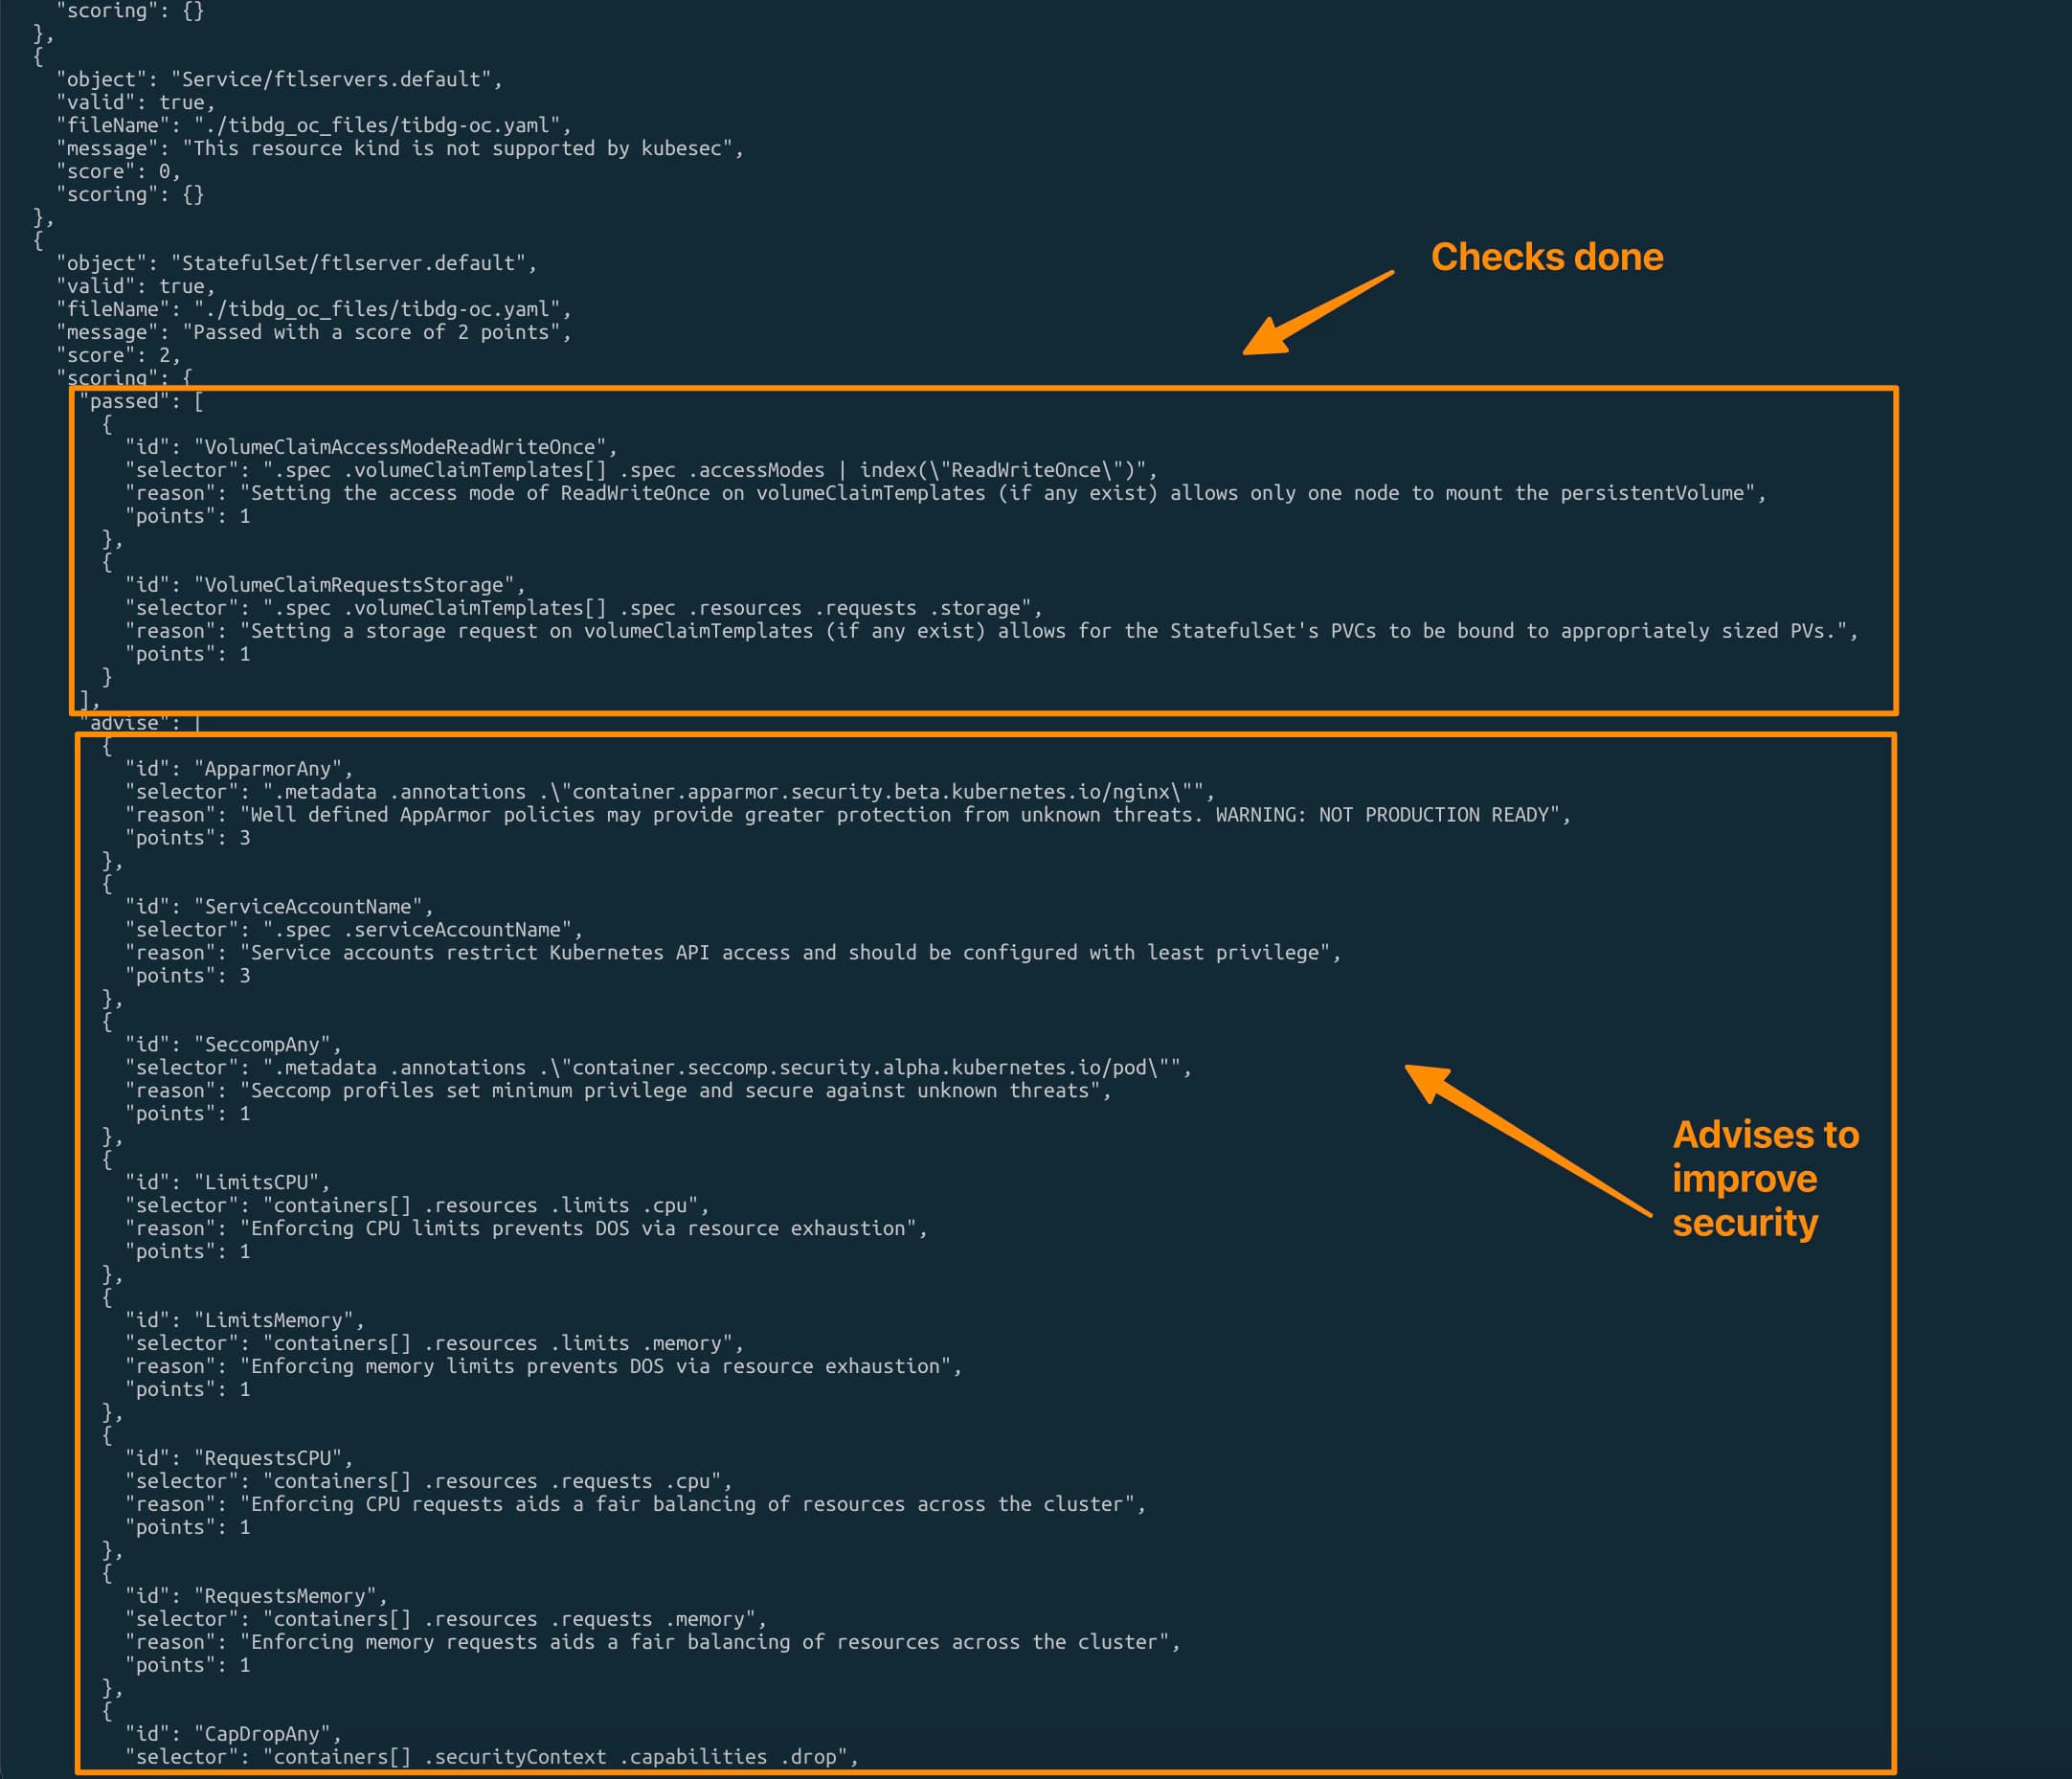
              What you will get out of the execution if KubeScan of any of its forms is a JSON report that you can use to improve and score the security level of your Kubernetes resources and some ways to improve it. The reason behind using JSON as the output also simplifies the tool’s usage in automated workloads such as CICD pipelines. Here you can see a sample of the output report you will get:

              kubesec sample output

              The important thing about the output is the kind of information you will receive from it. As you can see in the picture above, it is separated into two different sections per object. The first one is the “score,” that are the implemented things related to security that provide some score for the security of the object. But also you will have an advice section that provides some things and configurations you can do to improve that score, and because of that, also the global security of the Kubernetes object itself.

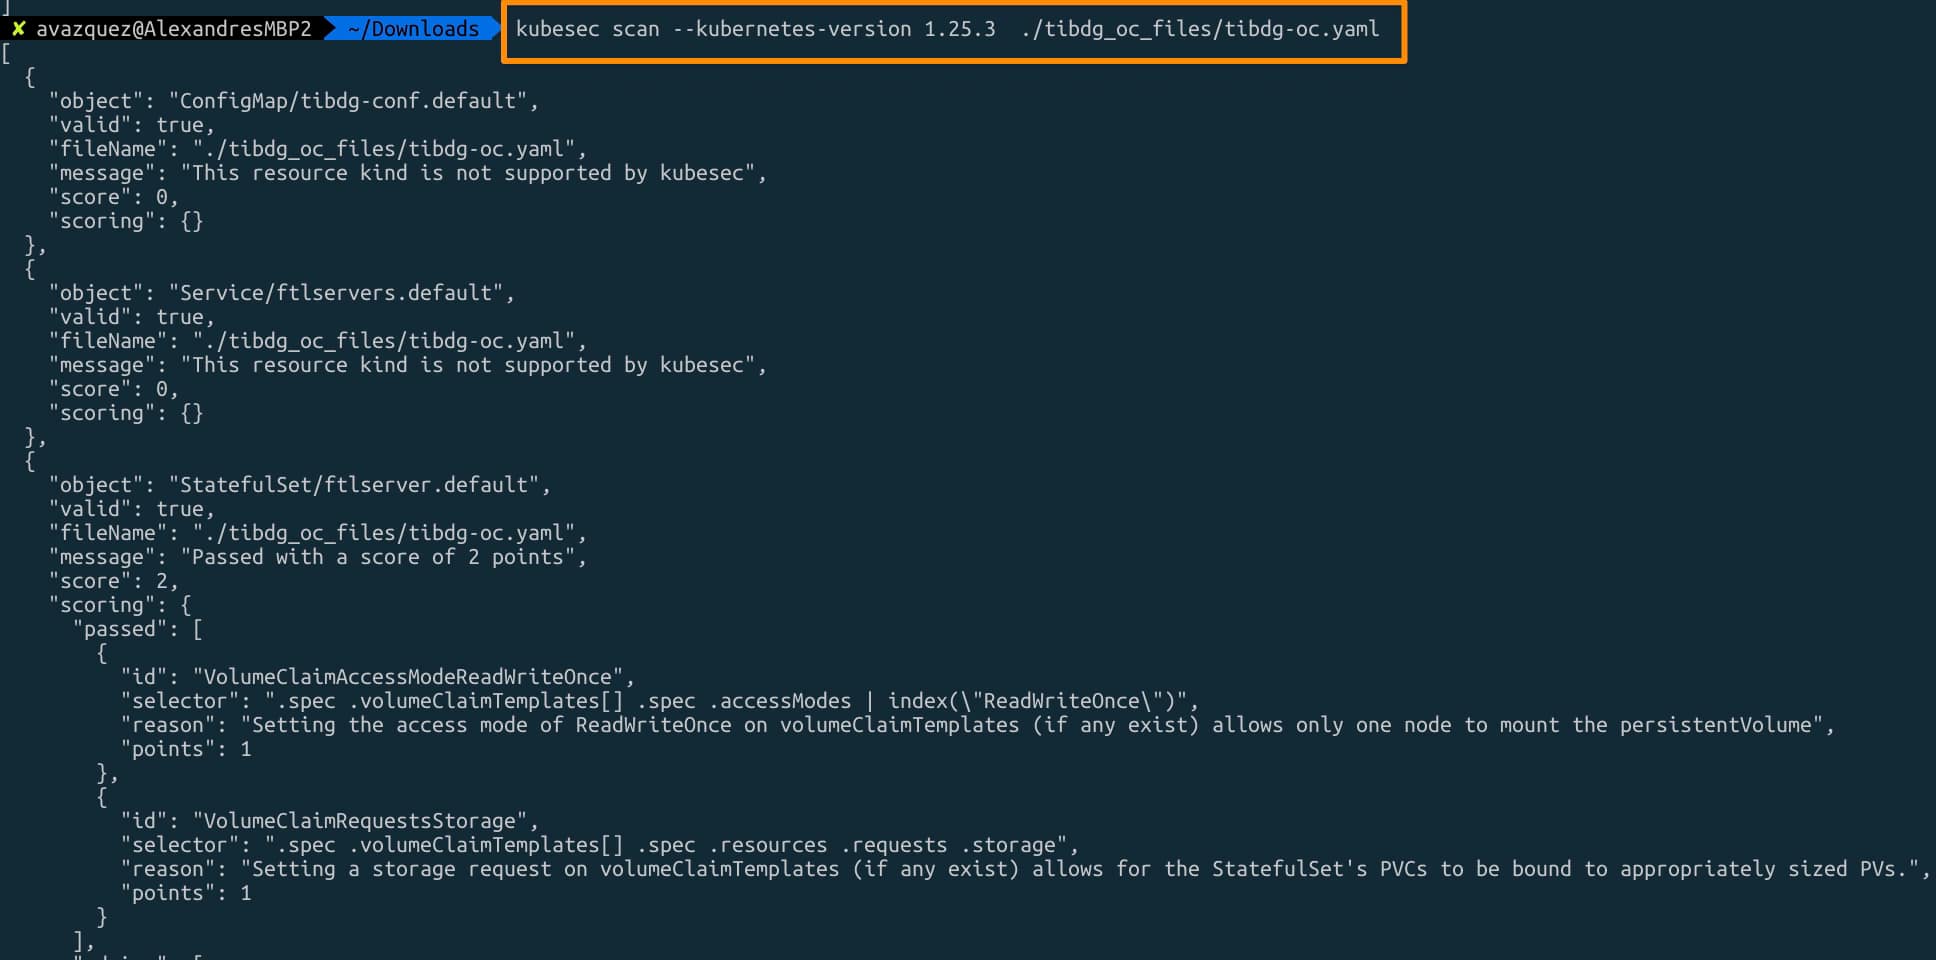
              Kubescan also leverages another tool we have commented not far enough on this site, Kubeconform, so you can also specify the target Kubernetes version you’re hitting to have a much more precise report of your specific Kubernetes Manifest. To do that, you can specify the argument --kubernetes-version when you’re launching the command, as you can see in the picture below:

              kubesec command with kubernetes-version option

               How To Install KubeScan?

              Installation also provides different ways and flavors to see what is best for you. Here are some of the options available at the moment for writing this article:

              Conclusion

              Emphasizing the paramount importance of security in today’s intricate architectures, KubeSec emerges as a vital asset for bolstering the protection of Kubernetes clusters. Developed by ControlPlane, this open-source tool facilitates comprehensive security risk assessments of Kubernetes resources. Offering versatility through multiple operational modes—such as HTTP, SaaS, CLI, and Docker—KubeSec provides tailored support for diverse scenarios. Its JSON-based output streamlines integration into automated workflows, while its synergy with Kubeconform ensures precise analysis of Kubernetes Manifests. KubeSec’s user-friendly approach empowers security experts and novices, catalyzing an elevated standard of Kubernetes security across the board.

              📚 Want to dive deeper into Kubernetes? This article is part of our comprehensive Kubernetes Architecture Patterns guide, where you’ll find all fundamental and advanced concepts explained step by step.

              Enable SwaggerUI in TIBCO BusinessWorks When Offloading SSL (BWCE Fix)

              Enable SwaggerUI in TIBCO BusinessWorks When Offloading SSL (BWCE Fix)

              SwaggerUI TIBCO BusinessWorks is one of the features available by default to all the TIBCO BusinessWorks REST Service developed. As you probably know, SwaggerUI is just an HTML Page with a graphical representation of the Swagger definition file (or OpenAPI specification to be more accurate with the current version of the standards in use) that helps to understand the operation and capabilities exposed by the service and also provide an easy way to test the service as you can see in the picture below:

              This article is part of my comprehensive TIBCO Integration Platform Guide where you can find more patterns and best practices for TIBCO integration platforms.

              How To Enable SwaggerUI TIBCO BusinessWorks when Offloading SSL Certificate: SwaggerUI view from TIBCO BWCE app

              This interface is provided out of the box for any REST Service developed using TIBCO BusinessWorks that uses a different port (7777 by default) in case we’re talking about an on-premises deployment or in the /swagger endpoint in case we are talking about a TIBCO BusinessWorks Container Edition.

               How does SwaggerUI work to load the Swagger Specification?

              SwaggerUI works in a particular way. When you reach the URL of the SwaggerUI, there is another URL that is usually part of a text field inside the web page that holds the link to the JSON or YAML document that stores the actual specification, as you can see in the picture below:

              How To Enable SwaggerUI TIBCO BusinessWorks when Offloading SSL Certificate: SwaggerUI highlighting the 2 URL loaded in the process

              So, you can think that this is a 2-call kind of process:

              • First call loads the SwaggerUI as a graphical container
              • Then, based on the internal URL provided there, do a second call to retrieve the document specification
              • And with that information, render the information in the SwaggerUI format.

              The issue is raised when the SwaggerUI is exposed behind a Load Balancer because the second URL needs to use the advertised URL as the backend server is not reached directly by the client browsing the SwaggerUI. This is solved out of the box with Kubernetes capabilities in the case of TIBCO BWCE, and for the on-premises deployment, it offers two properties to handle that as follows:

              # ------------------------------------------------------------------------------
              # Section:  BW REST Swagger Configuration.  The properties in this section
              # are applicable to the Swagger framework that is utilized by the BW REST 
              # Binding.
              #
              # Note: There are additional BW REST Swagger configuration properties that
              # can be specified in the BW AppNode configuration file "config.ini".  Refer to
              # the BW AppNode configuration file's section "BW REST Swagger configuration" 
              # for details. 
              # ------------------------------------------------------------------------------
              # Swagger framework reverse proxy host name.  This property is optional and 
              # it specifies the reverse proxy host name on which Swagger framework serves 
              # the API's, documentation  endpoint, api-docs, etc.. 
              bw.rest.docApi.reverseProxy.hostName=localhost
              
              # Swagger framework port.  This property is optional and it specifies the 
              # reverse proxy port on which Swagger framework serves the API's, documentation
              # endpoint, api-docs, etc.
              bw.rest.docApi.reverseProxy.port=0000
              

              You can browse the official documentation page for more detailed information.

              That solves the main issue regarding the hostname and the port to be reached as the final user requires. Still, there is an outstanding component on the URL that could generate an issue, and that’s the protocol, so, in a nutshell, if this is exposed using HTTP or HTTPS.

              How to Handle Swagger URL when offloading SSL?

              Until the release of TIBCO BWCE 2.8.3, the protocol depended on the HTTP Connector configuration you used to expose the swagger component. So, if you use an HTTP connector without SSL configuration, it will try to reach the endpoint using an HTTP connection. In the other case, if you use an HTTP connector with an SSL connection, it will try to use an HTTPS connection. That seems fine, but some use cases could generate a problem:

              SSL Certificate offloaded in the Load Balancer: If we offload the SSL configuration on the Load Balancer as it is used in traditional on-premises deployments and some of the Kubernetes configurations, the consumer will establish an HTTPS connection to the Load Balancer, but internally the communication with the BWCE will be done using HTTP, so, in this case, it will generate a mismatch, because in the second call of the requests it will guess that as the HTTP Connector from BWCE is not using HTTPS, the URL should be reached using HTTP but that’s not the case as the communication goes through the Load Balancer that is handled the security.

              Service Mesh Service Exposition: Similar to the previous case, but in that case, close to the Kubernetes deployment. Suppose we are using Service Mesh such as Istio or others. In that case, security is one of the things that needs to be handled. Hence, the situation is the same as the scenario above because the BWCE doesn’t know the security configuration but is impacting the default endpoint generated.

              How To Enable SwaggerUI TIBCO BusinessWorks when Offloading SSL Certificates?

              Since BWCE 2.8.3, there is a new JVM property that we can use to force the endpoint generated to be HTTPS even if the HTTP Connector used by the BWCE application doesn’t have any security configuration that helps us to solve this issue in the cases above and similar scenario. The property can be added as any other JVM property using the BW_JAVA_OPTS environment property, and the value is this: bw.rest.enable.secure.swagger.url =true