Table of Contents
Introduction
Grafana Alerting capabilities continue to improve in each new release the GrafanaLabs team does. Especially with the changes done in Grafana 8 and Grafana 9, many questions have been raised regarding its usage, the capabilities supported, and the comparison with other alternatives.
We want to start setting the context about Grafana Alerting based on the usual stack we deployed to improve the observability of our workloads. Grafana can be used for any workload; there is a preference for some specific ones being the most used solution when we talk about Kubernetes workloads.
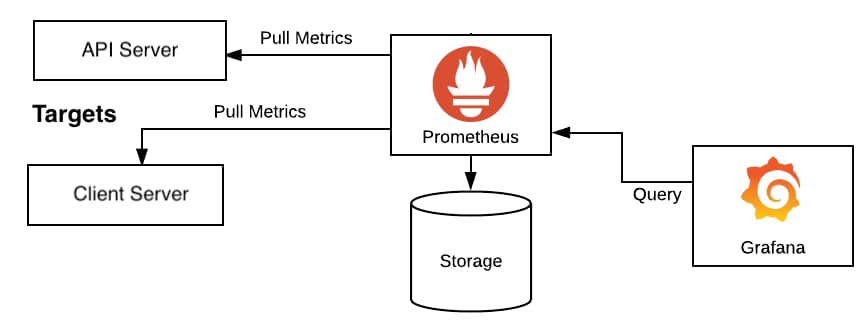
In this kind of deployment, the stack we usually deploy is Grafana as the visualization tool and Prometheus as the core to gather all metrics, so all responsibilities are differentiated. Grafana draws all the information using its excellent dashboarding capabilities, gathering the information from Prometheus.

When we plan to start including alerts, as we cannot accept that we need to have a specific team just watching dashboards to detect where something is going wrong, we need to implement a way to push alerts.
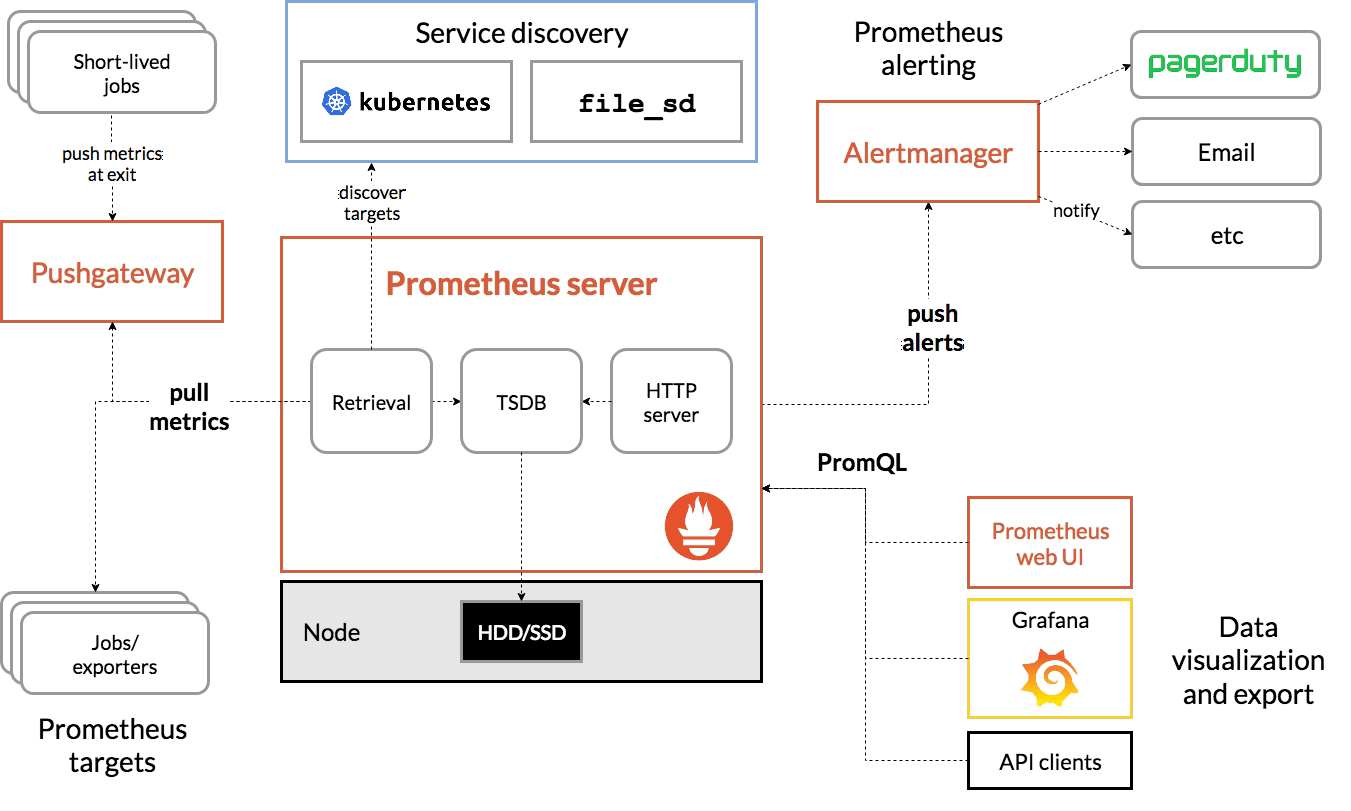
Alerting capabilities in Grafana have been present since the beginning, but its capabilities in the early stages have been limited to generating graphical alerts focused on the dashboards. Instead of that, Prometheus acting as the brain, includes a side-card component called AlertManager that can handle the creation and notification of any alerts generated from all the information stored in Prometheus.
As main capabilities that Alert Manager provides are the definition of the alerts, a grouping of the alerts, dismiss rules to mute some notifications, and finally, the way to send that alert to any system based on a plugin system and a webhook to be able to extend it to any component available.

So, this is the initial stage, but this has been changed with the latest releases of Grafana in the last months, as commented, and now the barrier between both components is much fuzzier, as we’re going to see.
What are the main capabilities Grafana Alerting provides today?
Grafana Alerting allows you to define Alert rules defining the criteria under which this alert should fire. It can have different queries, conditions, evaluation frequency, and the duration over which the condition is met.
This alert can be generated from any of the sources supported in Grafana, and that’s a very relevant topic as this is not limited to the Prometheus data. With the eclosion of the GrafanaLabs stack with many new products such as Grafana Loki and Grafana Mimir, among others, this is especially relevant.
Once each of the alerts once it fires, you can define a Notification policy to decide where, when, and how each of these alerts is routed to. A notification policy also has a contact point associated with one or more notifiers.
Additionally, you can silence alerts to stop receiving notifications of a specific alert instance and mute alerts when you can define some period where new alerts will not be generated or notified.
All of that with powerful dashboarding capabilities using all the power of the Grafana dashboard features.

Grafana Alerting vs Prometheus Alert Manager
After reading the previous section probably, you are confused because most of the new features added are very similar to the ones we have available on Prometheus AlertManager.
So, in that case, what tool should we use? Should we replace Prometheus AlertManager and start using Grafana Alerting? Should we use both? As you can imagine, this is one of these questions that doesn’t have clear answers as it will depend a lot on the context and your specific scenario, but let me give you some pointers around it.
- Grafana Alerting can be very powerful if you are already inside the Grafana stack. If you are already using Grafana Loki (and require to generate alerts from it), Grafana Mimir, or directly Grafana cloud, probably Grafana Alert would provide a better fit for your ecosystem.
- If you require complex alerts defined with complex queries and calculations, Prometheus AlertManager will provide a much more complex and rich ecosystem to generate your alerts.
- If you are looking for a SaaS approach, Grafana Alerting is also provided as part of Grafana Cloud, so it can be used without the requirement to be installed in your ecosystem.
- If you are using Grafana Alerting, you need to consider that the same component serving the dashboards is computing and generating the alerts, which would require additional HA capabilities. It will be a non-evitable relationship between both features (dashboards and alerts). Suppose that doesn’t resonate well with you because the criticality of your dashboard is not the same as the alerts, or you think your dashboard’s usage can affect the alerts’ performance. In that case, Prometheus Alert Manager will provide a better approach as it runs in a specific pod in isolation.
- At this moment, Grafana Alerting uses a SQL Database to manage duplication among other features, so depending on the number of alerts you need to work on could not be enough in terms of performance, and the usage of the time series database from Prometheus can be a better fit.
Summary
Grafana Alerting is incredible progress on the journey of the Grafana Labs team to provide an end-to-end observability stack with a great fit on the rest of the ecosystem with the option to run it in SaaS mode and focus on ease of use. But there are better options than depending on your needs.
📚 Want to dive deeper into Kubernetes? This article is part of our comprehensive Kubernetes Architecture Patterns guide, where you’ll find all fundamental and advanced concepts explained step by step.

