Discover SARChart and kSAR as critical utilities to be part of your toolbelt for administration or troubleshooting

There was a time when we didn’t have public cloud providers providing us with a bunch of kinds of services and a whole platform and experience unified, covering all the aspects of our technical needs when we talked about an IT environment and sysstat metrics were key there.
There was a time when AWS Cloud Watch, Azure Monitor, Prometheus were not a thing, and we need to deal with Linux servers without a complete portal providing all the metrics that we could need.
There was a time… that it is still the present for so many customers and organizations all over the world and they still need to deal with this situation, and probably you face this situation now or even in the future. So, let’s see what we can do regarding that.
Introducing sysstat
For several decades the standard way to extract the usage metrics from a Linux server was sysstat. Based on the words on its official web page, this is what sysstat is:
The sysstat utilities are a collection of performance monitoring tools for Linux. These include sar, sadf, mpstat, iostat, tapestat, pidstat, cifsiostat and sa tools

Sysstat is old but powerful, and it has so many options that have to save my life in a lot of customers and provide a lot of handy information that I needed at that time. But today, I am going to talk about a specific utility from the whole lot, that is sar.
sar is the command to be able to query the performance metrics for an existing machine. Just typing the command sar is enough to start seeing awesome things. That will give you the CPU metrics for the whole day for each of the CPUs that your machine has and also split depending on the kind of usage (user, system, idle, all).

But these metrics are not only the things that you can get. Other options available
- sar -r: Provide memory metrics
- sar -q: Provide the load metrics.
- sar -n: Provide the network metrics.
- sar -A: Provides ALL the metrics.
- sar -f /var/log/sysstat/sa[day-of-the-month]: It will provide metrics for the day of the month instead of the current day.
There are a lot of options more that you can use on your daily basis, so if you need something concrete, take a look at the man page for the sar command:
But we are all visual people, right? It is true that seeing trends and evolutions is more complex in text mode and also seeing only daily data at a time. So take a look at the options to handle that challenge:
kSAR

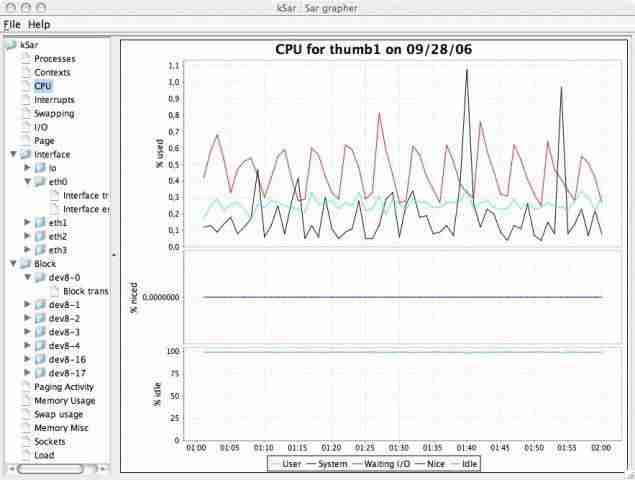
Java-based developed frontend using Swing library to represents the data from sar visually. It is a portable one, so you need the JAR file to execute it. And you can invoke it in several ways:
- Providing the file you got from a machine that you executed the sar command.
- Connecting using SSH to a remote machine and running the command that you need.

SARChart
What about when you are on a machine that you don’t have the rights to install any application, even a portable one as kSAR is, or maybe you only have your tablet available? In that case, we have SARChart.

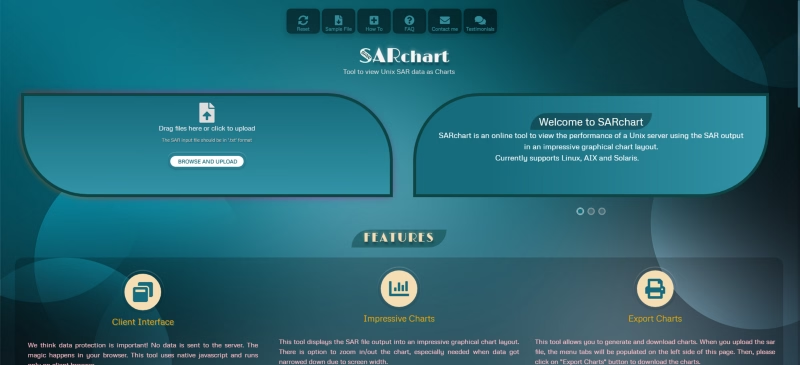
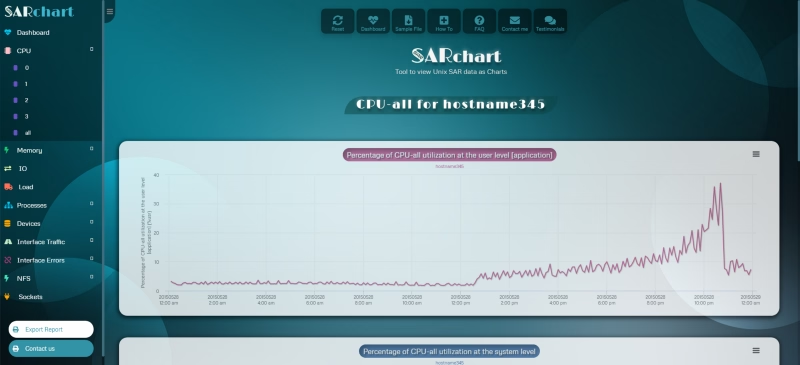
SARChart is a web application that provides a graphical analysis of the sar files. So you only need to upload the file to get a complete graphical and well-looked analysis of your data covering all its aspects. Additionally, all the work is done at the client level without sending any of your data to any server.

Summary
I hope you find these tools interesting if you didn’t know about them, and I also hope that they can help you with your daily work or at least be part of your toolset to be at your disposal when you need them.


