Put some brain when a route is not working as expected, or your consumers are not able to reach the service
We all know that Openshift is an outstanding Kubernetes Distribution and one of the most used mainly when talking about private-cloud deployments. Based on the solid reputation of Red Hat Enterprise Linux, Openshift was able to create a solid product that is becoming almost a standard for most enterprises.
It provides a lot of extensions from the Vanilla Kubernetes style, including some of the open-source industry standards such as Prometheus, Thanos, and Grafana for Metrics Monitoring or ELK stack for Logging Aggregation but also including its extensions such as the Openshift Routes.
Openshift Routes was the initial solution before the Ingress concept was a reality inside the standard. Now, it also implements following that pattern to keep it compatible. It is backed by HAProxy, one of the most known reverse-proxy available in the open-source community.
One of the tricky parts by default is knowing how to debug when one of your routes is not working as expected. The way you create routes is so easy that anyone can make it in a few clicks, and if everything works as expected, that’s awesome.
But if it doesn’t, the problems start because, by default, you don’t get any logging about what’s happening. But that’s what we are going to solve here.
First, we will talk a little more about how this is configured. Currently (Openshift 4.8 version), this is implemented, as I said, using HAProxy by default so if you are using other technology as ingresses such as Istio or Nginx, this article is not for you (but don’t forget to leave a comment if a similar kind of article would be of your interest so I can also bring it to the back-log 🙂 )
From the implementation perspective, this is implemented using the Operator Framework, so the ingress is deployed as an Operator, and it is available in the openshift-ingress-operator namespace.

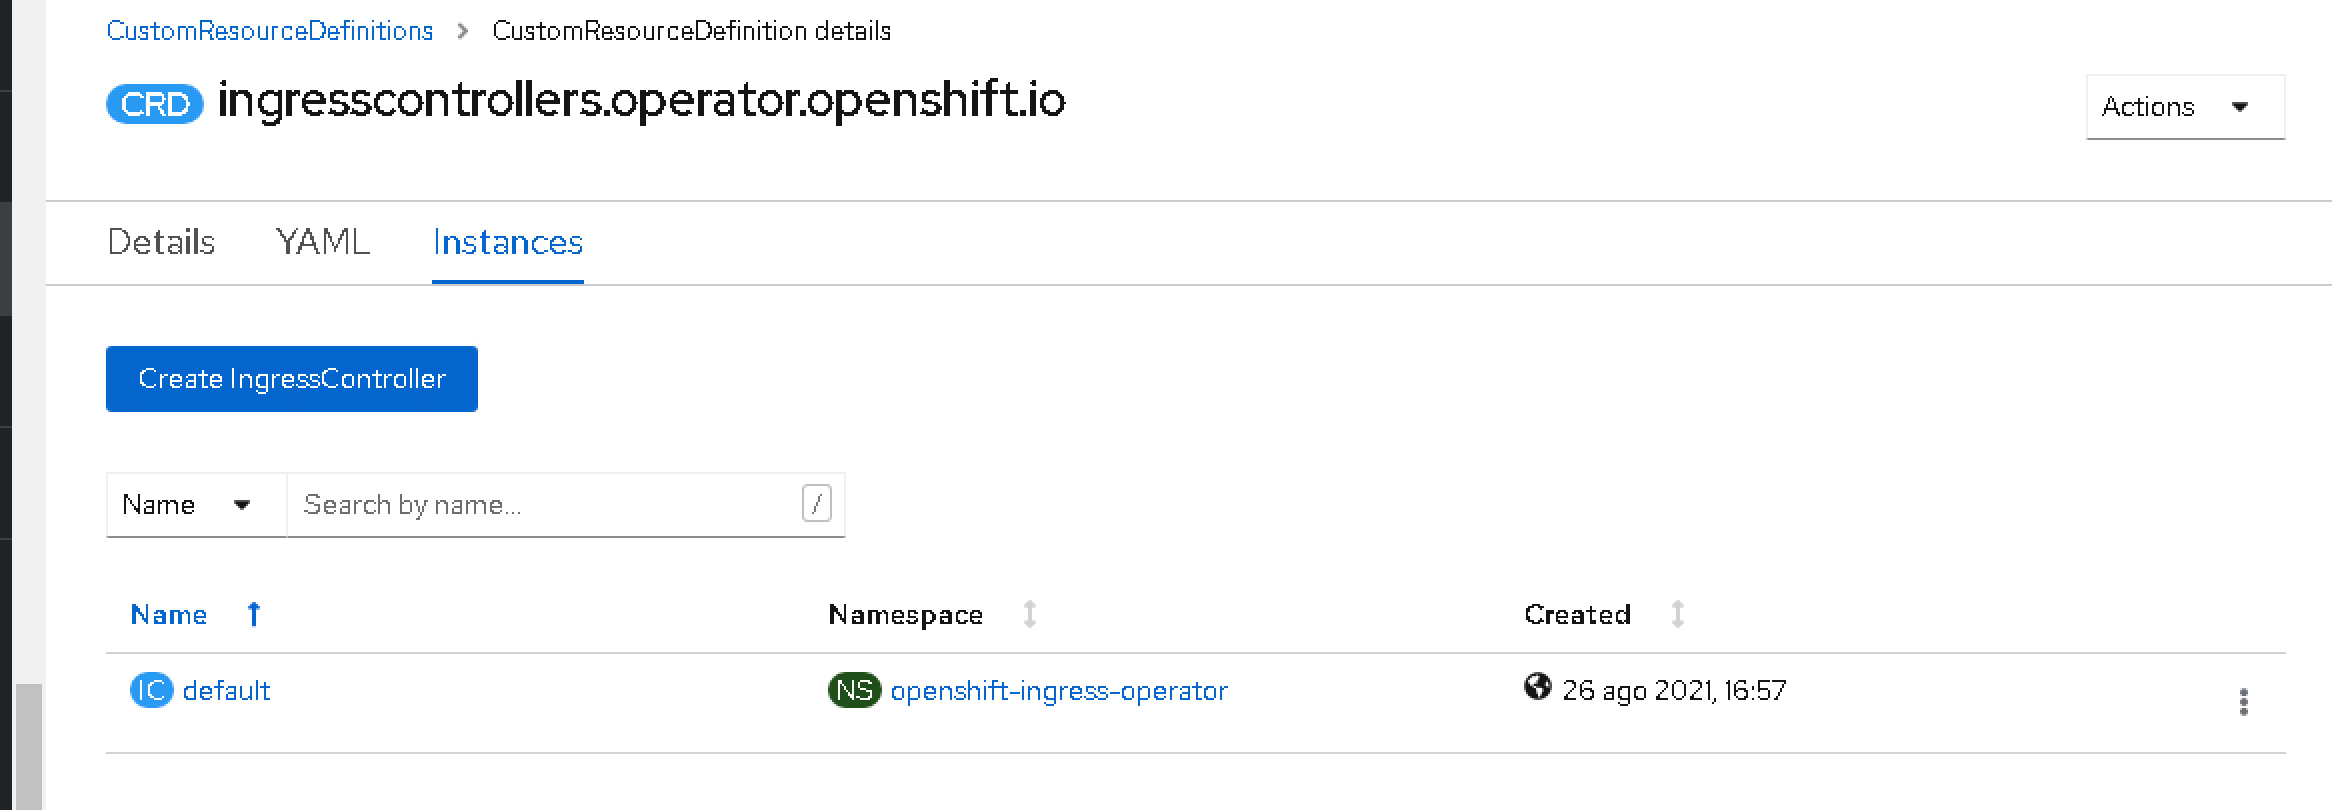
So, as this is an operator, several Custom Resources Definition (CRD) have been installed to work with this, one of the most interesting of this article. This CRD is Ingress Controllers.

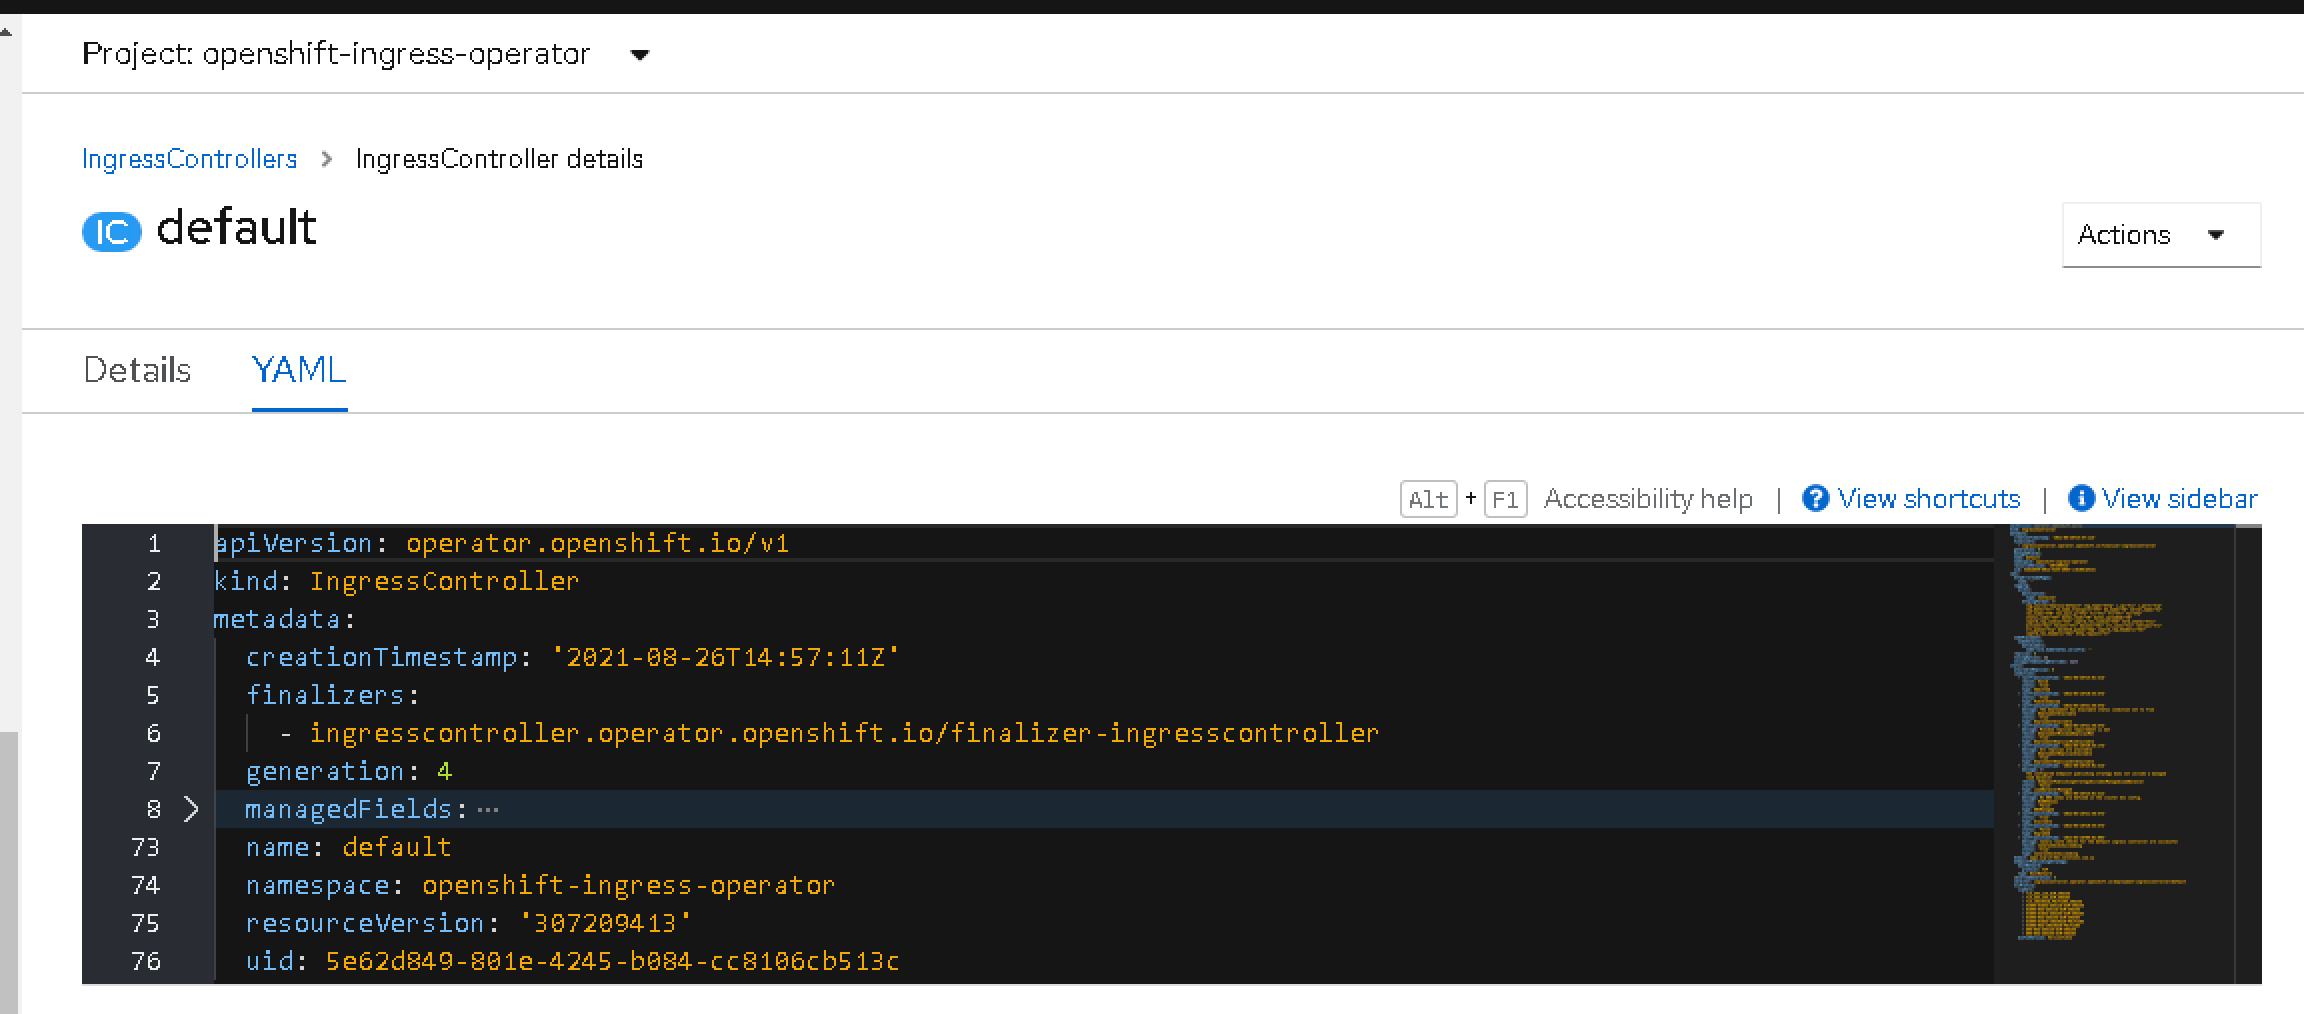
By default, you will only see one instance named default. This is the one that includes the configuration of the ingress that is being deployed, so we need to add here an additional configuration to have also the logs.

The snippet that we need to that is the one shown below under the spec parameter that starts the definition of the specification of the IngressController itself:
   logging:
    access:
      destination:
        type: Container
      httpLogFormat: >-
        log_source="haproxy-default" log_type="http" c_ip="%ci" c_port="%cp"
        req_date="%tr" fe_name_transport="%ft" be_name="%b" server_name="%s"
        res_time="%TR" tot_wait_q="%Tw" Tc="%Tc" Tr="%Tr" Ta="%Ta"
        status_code="%ST" bytes_read="%B" bytes_uploaded="%U"
        captrd_req_cookie="%CC" captrd_res_cookie="%CS" term_state="%tsc"
        actconn="%ac" feconn="%fc" beconn="%bc" srv_conn="%sc" retries="%rc"
        srv_queue="%sq" backend_queue="%bq" captrd_req_headers="%hr"
        captrd_res_headers="%hs" http_request="%r"
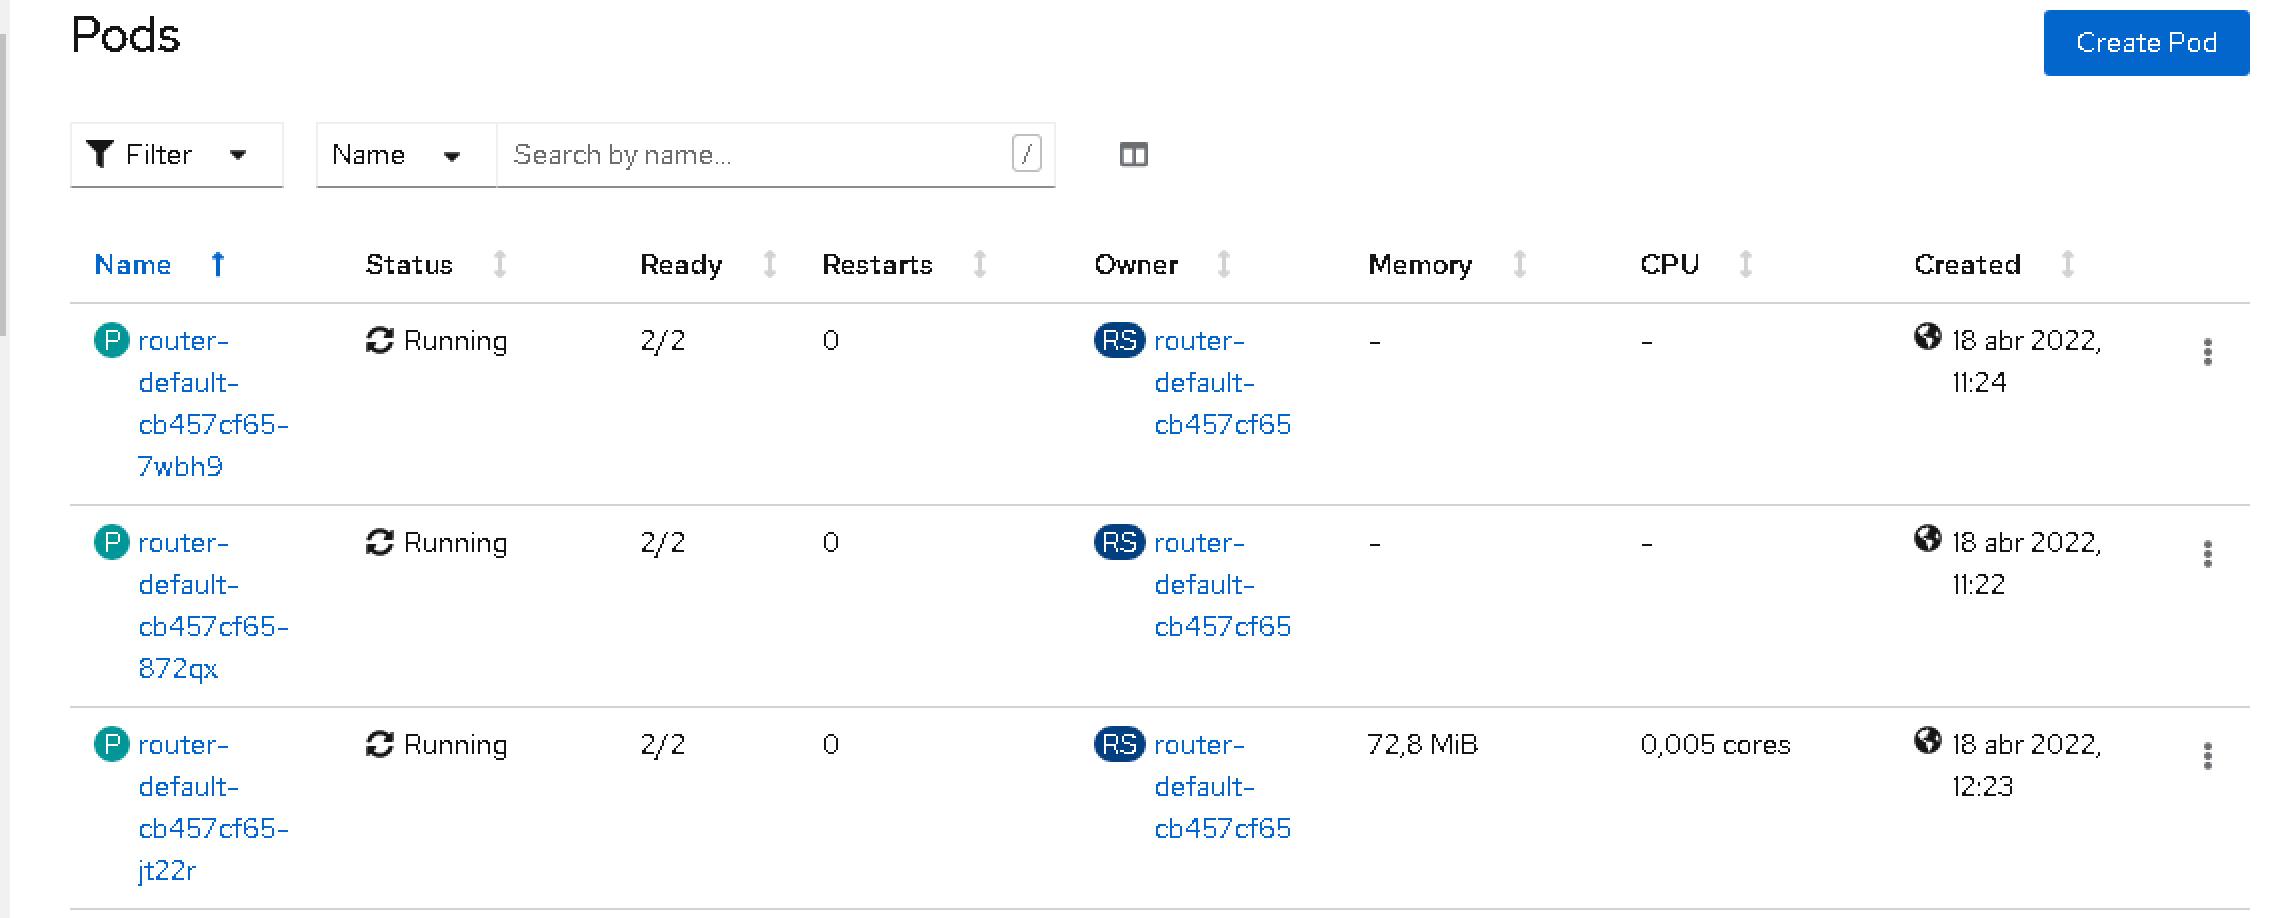
This will make another container deployed on the router pods in the openshift-ingressnamespace following the sidecar pattern named logs.

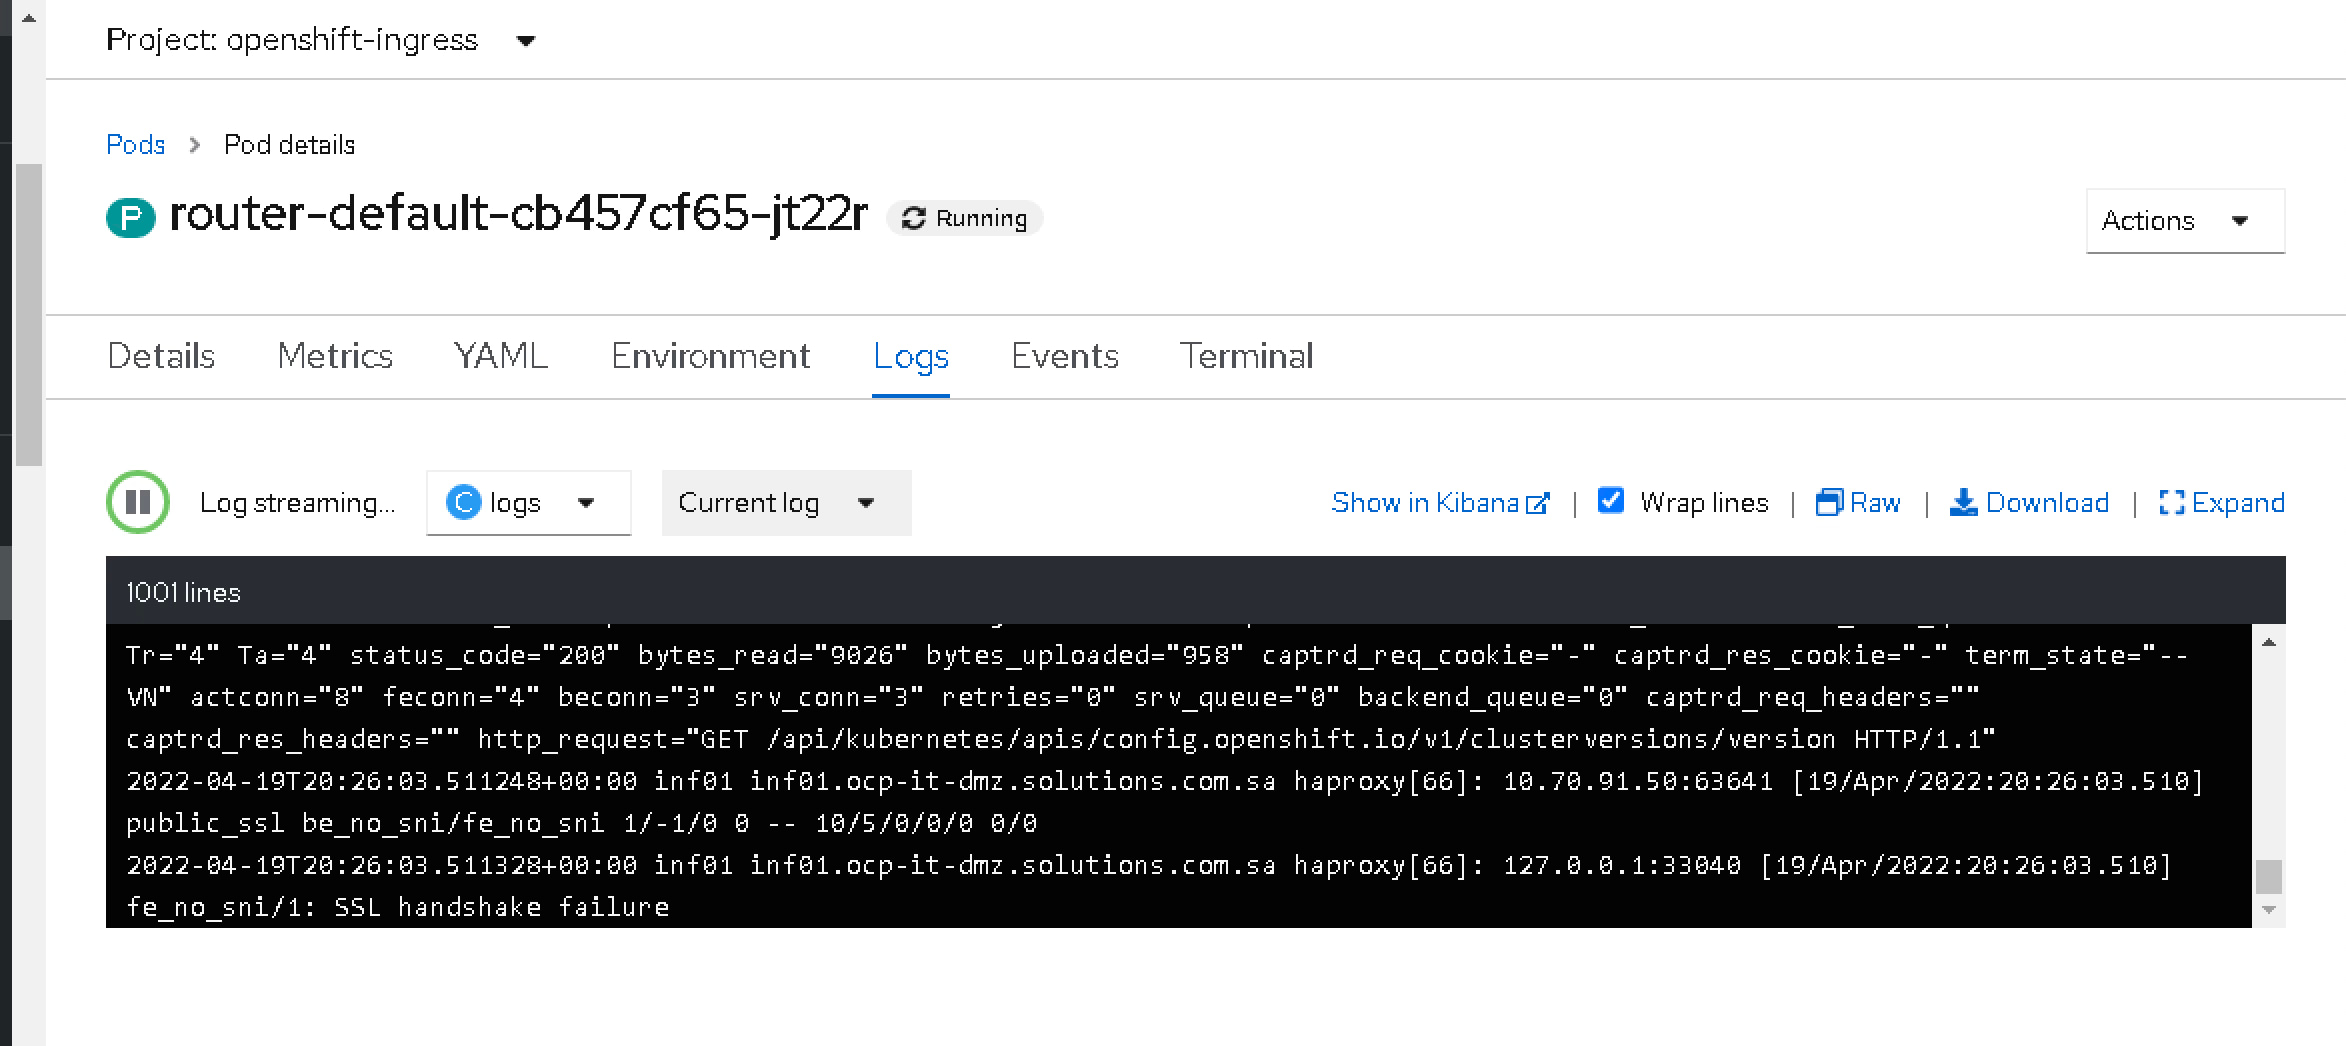
This container will print the logs from the requests reaching the ingress component, so next time your consumer is not able to call your service, you will be able to see the incoming requests with all their metadata and know at least what is doing wrong:

As you can see, simple and easy!! If you don’t need it anymore, you can again remove the configuration and save it, and the new version will be rolled out and go back to normal.
📚 Want to dive deeper into Kubernetes? This article is part of our comprehensive Kubernetes Architecture Patterns guide, where you’ll find all fundamental and advanced concepts explained step by step.

