This article will cover how to quickly integrate Grafana and LDAP server to increase the security of your application
Grafana is one of the most used dashboard tools, mainly for the observability platforms on cloud-workload environments. But none of these tools is complete until you can configure them to meet your security standards. Security is becoming each time more and more important and this is especially true when we are talking about any cloud-related component. So this topic should always something that any cloud architect has in mind when they are defining or implementing any piece of software today.
And at that point, the LDAP integration is one of the main things you will always need to do. I don’t know any enterprise, big or small, that allows the usage of any tool with a Graphical User Interface if it is not connected to the corporate directory.
So, let’s see how we can implement this with a popular tool such as Grafana. In my case, I’m going to use a containerized version of grafana, but the steps and things to do remains the same no matter the deployment model.
The task that we are going to perform is based on three steps:
- Enable the LDAP settings
- Basic LDAP settings configuration
- Group mapping configuration
The first thing we need to modify is the grafana.ini adding the following snippet:
    [auth.ldap]
    enabled = true
    config_file = /etc/grafana/ldap.toml
That means that we are enabling the authentication based on LDAP and setting the location of the LDAP configuration file. This ldap.toml has all the configuration needed for the LDAP:
    [[servers]]
    host = "localhost"
    port = 389
    use_ssl = false
    start_tls = false
    ssl_skip_verify = false

    bind_dn = "XXXXXX-XXXXXXXXX"
    bind_password = "XXXXXX"

	search_filter = "(&(sAMAccountName=%s)(memberOf=ADMIN_GROUP))"
    search_base_dns = [DC=example,DC=org"]


    [servers.attributes]
    member_of = "member"
    email =  "mail"
    name = "givenName"
    surname = "sn"
    username = "sAMAccountName"

    [[servers.group_mappings]]
    group_dn = "*"
    org_role = "Admin"
The first part is regarding the primary connection. We will establish the host location and port, the admin user, and the password. After that, we will need a second section that definesearch_filter and search_base_dns to define the users that can access the system.
Finally, we have another section to define the mapping between the LDAP attributes and the grafana attributes to be able to gather the data from the LDAP.
    [servers.attributes]
    member_of = "member"
    email =  "mail"
    name = "givenName"
    surname = "sn"
    username = "sAMAccountName"
Also, we can define the privileges that the different groups allow to have to the various org_rolesin Grafana, as you can see in the snippet below:
    [[servers.group_mappings]]
    group_dn = "*"
    org_role = "Admin"
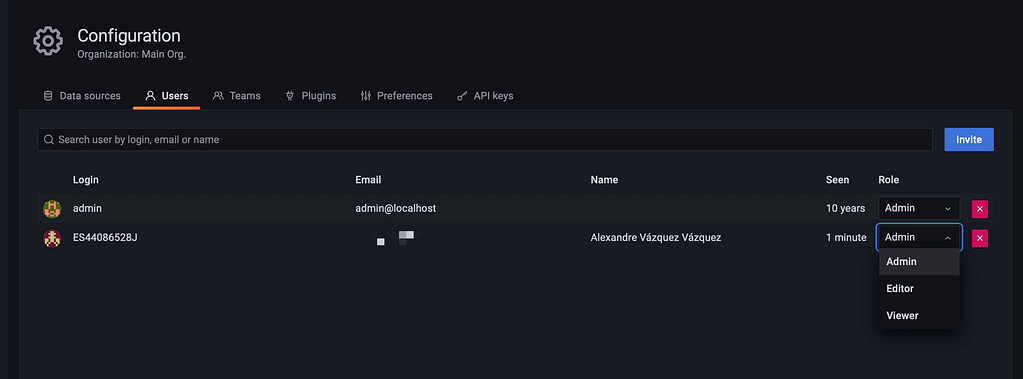
With all those changes in place, you need to restart the Grafana server to see all this configuration applied. After that point, you can log in using the LDAP credentials as you can see in the picture below and see all the data retrieved from the LDAP Server:

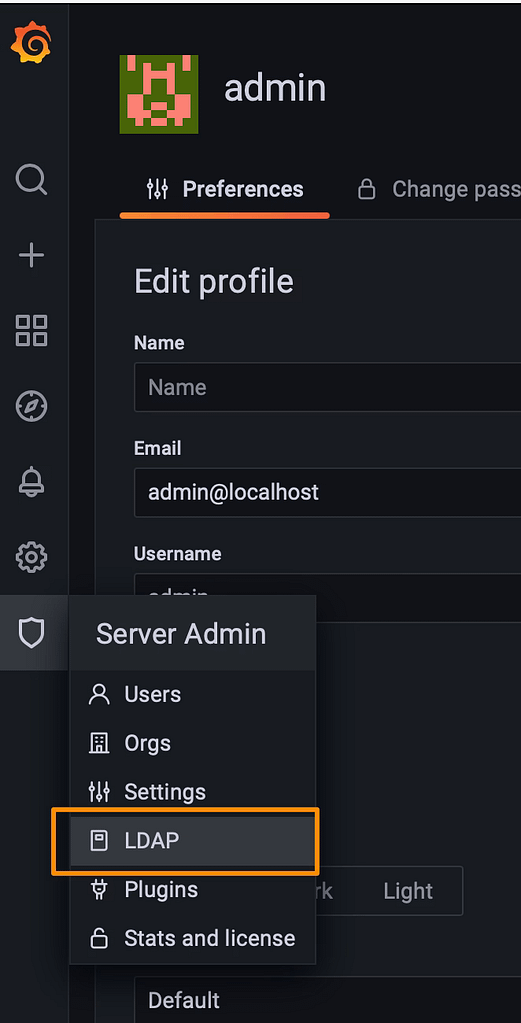
Using the default admin server, you can also use a new feature to test the LDAP configuration using the LDAP option that you can see in the picture below:

And then you can search for a User and you will see how this user will play on the Grafana Server:
- Check the attributes will map from the LDAP server to the Grafana server
- Also check the status of activity and the role allowed to this user
You can see one sample in the picture below:
I hope that this article helps you in a way to level up the security settings on your Grafana installations to integrate with the LDAP server. If you want to see more information about this and similar topics I encourage you to take a look at the links that you would find below these sentences.

