Discover Mizu: Traffic Viewer for Kubernetes to ease this challenge and improve your daily work.
One of the most common things we have to do when testing and debugging our cloud-native workloads on Kubernetes is to check the network communication.
This article is part of my comprehensive TIBCO Integration Platform Guide where you can find more patterns and best practices for TIBCO integration platforms.
It could be to check the incoming traffic you are getting so we can inspect the requests we are receiving and see what we are replying to and similar kinds of use-cases. I am sure this sounds familiar to most of you.
I usually solve that using tcpdump on the container, similar to what I would do in a traditional environment, but this is not always easy. Depending on the environment and configuration, you cannot do so because you need to include a new package in your container image, do a new deployment, so it is available, etc.
So, to solve that and other similar problems, I discovered a tool named Mizu, which I would like to have found a few months ago because it would help me a lot. Mizu is precisely that. In its own words:
Mizu is a simple-yet-powerful API traffic viewer for Kubernetes, enabling you to view all API communication between microservices across multiple protocols to help you debug and troubleshoot regressions.

To install, it is pretty straightforward. You need to grab the binary and provide the correct permission on your computer. You have a different binary for each architecture, and in my case (Mac Intel-based), these are the commands that I executed:
curl -Lo mizu github.com/up9inc/mizu/releases/latest/download/mizu_darwin_amd64 && chmod 755 mizu && mv mizu /usr/local/binAnd that’s it, then you have a binary in your laptop that connects to your Kubernetes cluster using Kubernetes API, so you need to have configured the proper context.
In my case, I have deployed a simple nginx server using the command:
kubectl run simple-app --image=nginx --port 80And once that the component has been deployed, as it is shown in the Lens screenshot below:
I ran the command to launch mizu from my laptop:
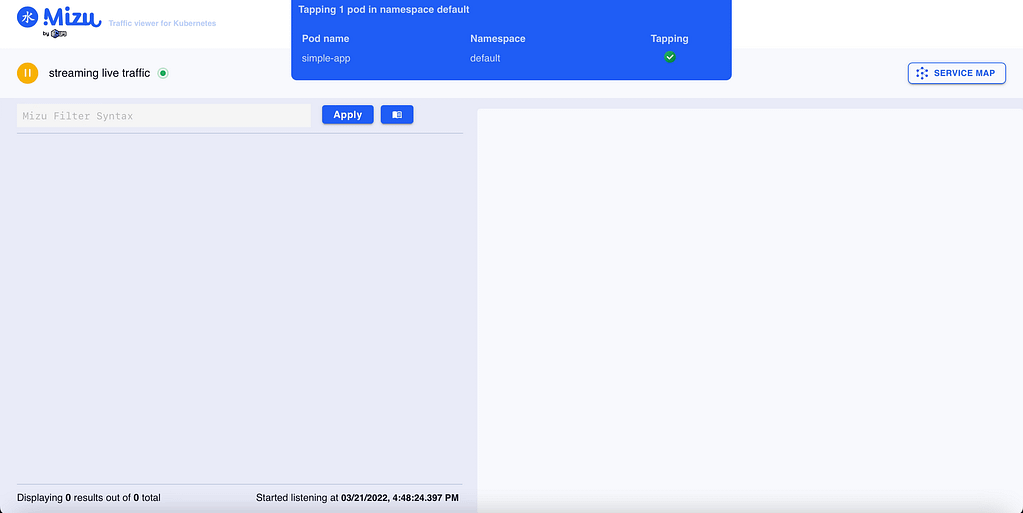
mizu tapAnd after a few seconds, I have in front of me a webpage opened monitoring all traffic happening in this pod:

I have made the nginx port expose using the kubectl expose command:
kubectl expose pod/simple-appAnd after that, I deployed a temporary pod using the curl image to start sending some requests with the command shown below:
kubectl run -it --rm --image=curlimages/curl curly -- shnow I’ve started to send some requests to my nginx pod using curl:
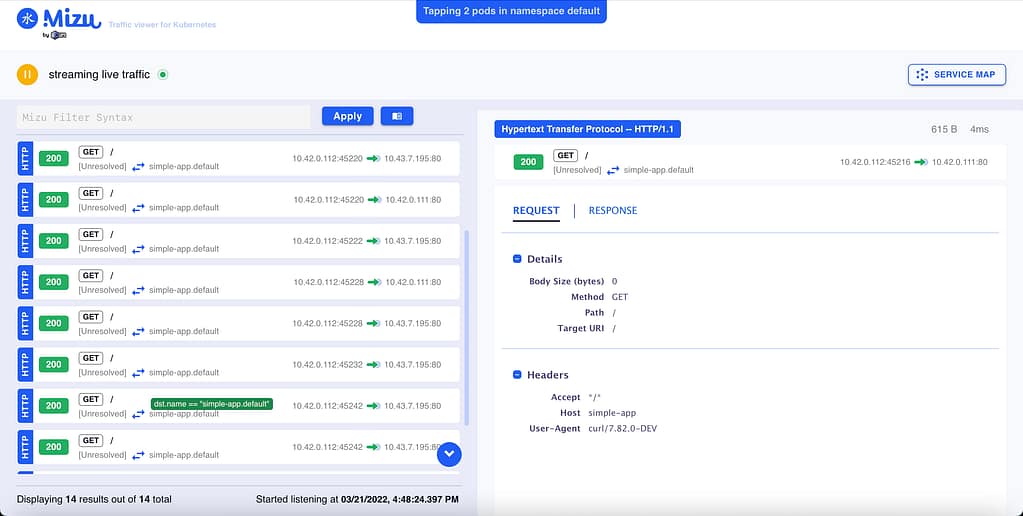
curl -vvv http://simple-app:80 And after a few calls, I could see a lot of information in front of me. First of all, I can see the requests I was sending with all the details of it:

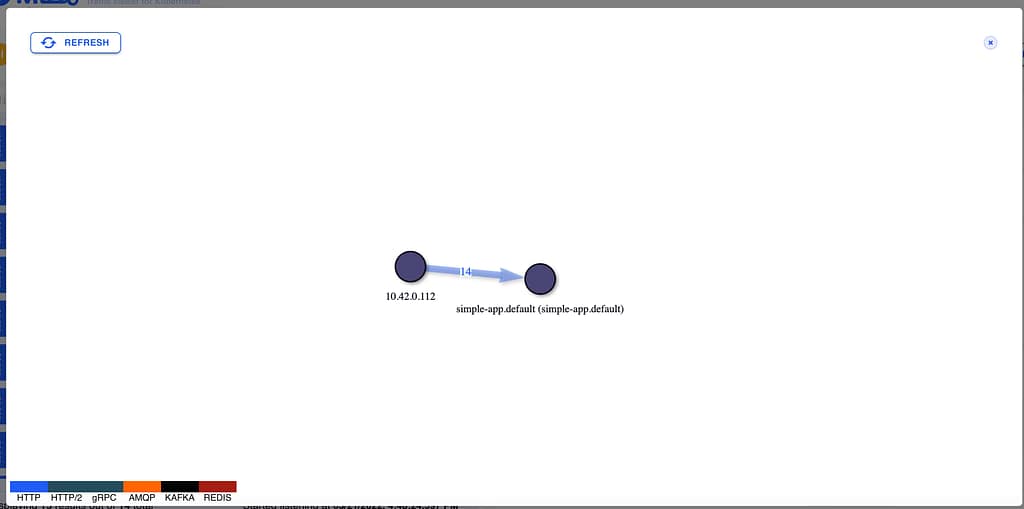
But even more important, I can see a service map diagram showing the dependencies and the calls graphically happening to the pod with the response time and also the protocol usage:

This will not certainly replace a complete observability solution on top of a service mesh. Still, it will be a beneficial tool to add to your toolchain when you need to debug a specific communication between components or similar kinds of scenarios. As commented, it is like a high-level tcpdump for pod communication.
📚 Want to dive deeper into Kubernetes? This article is part of our comprehensive Kubernetes Architecture Patterns guide, where you’ll find all fundamental and advanced concepts explained step by step.

