Kubernetes Policy Enforcement: Understanding Pod Security Admission (PSA)

Kubernetes Policy Enforcement: Understanding Pod Security Admission (PSA)

In Kubernetes, security is a key concern, especially as containers and microservices grow in complexity. One of the essential features of Kubernetes for policy enforcement is Pod Security Admission (PSA), which replaces the deprecated Pod Security Policies (PSP). PSA provides a more straightforward and flexible approach to enforce security policies, helping administrators safeguard clusters by ensuring that only compliant pods are allowed to run.

This article will guide you through PSA, the available Pod Security Standards, how to configure them, and how to apply security policies to specific namespaces using labels.

What is Pod Security Admission (PSA)?

PSA is a built-in admission controller introduced in Kubernetes 1.23 to replace Pod Security Policies (PSPs). PSPs had a steep learning curve and could become cumbersome when scaling security policies across various environments. PSA simplifies this process by applying Kubernetes Pod Security Standards based on predefined security levels without needing custom logic for each policy.

With PSA, cluster administrators can restrict the permissions of pods by using labels that correspond to specific Pod Security Standards. PSA operates at the namespace level, enabling better granularity in controlling security policies for different workloads.

Pod Security Standards

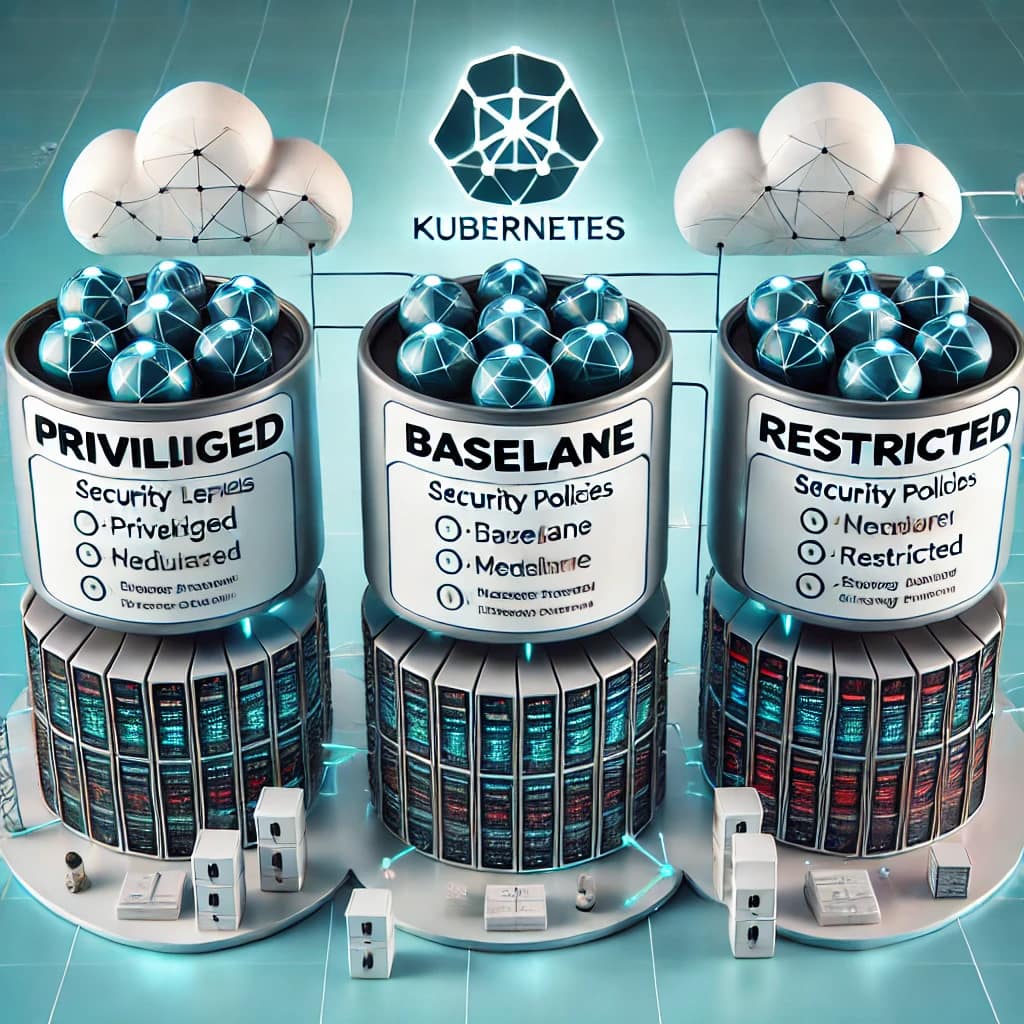
Kubernetes provides three key Pod Security Standards in the PSA framework:

  • Privileged: No restrictions; permits all features and is the least restrictive mode. This is not recommended for production workloads but can be used in controlled environments or for workloads requiring elevated permissions.
  • Baseline: Provides a good balance between usability and security, restricting the most dangerous aspects of pod privileges while allowing common configurations. It is suitable for most applications that don’t need special permissions.
  • Restricted: The most stringent level of security. This level is intended for workloads that require the highest level of isolation and control, such as multi-tenant clusters or workloads exposed to the internet.

Each standard includes specific rules to limit pod privileges, such as disallowing privileged containers, restricting access to the host network, and preventing changes to certain security contexts.

Setting Up Pod Security Admission (PSA)

To enable PSA, you need to label your namespaces based on the security level you want to enforce. The label format is as follows:

kubectl label --overwrite ns  pod-security.kubernetes.io/enforce=<value>

For example, to enforce a restricted security policy on the production namespace, you would run:

kubectl label --overwrite ns production pod-security.kubernetes.io/enforce=restricted

In this example, Kubernetes will automatically apply the rules associated with the restricted policy to all pods deployed in the production namespace.

Additional PSA Modes

PSA also provides additional modes for greater control:

  • Audit: Logs a policy violation but allows the pod to be created.
  • Warn: Issues a warning but permits the pod creation.
  • Enforce: Blocks pod creation if it violates the policy.

To configure these modes, use the following labels:

kubectl label --overwrite ns      pod-security.kubernetes.io/enforce=baseline     pod-security.kubernetes.io/audit=restricted     pod-security.kubernetes.io/warn=baseline

This setup enforces the baseline standard while issuing warnings and logging violations for restricted-level rules.

Example: Configuring Pod Security in a Namespace

Let’s walk through an example of configuring baseline security for the dev namespace. First, you need to apply the PSA labels:

kubectl create namespace dev
kubectl label --overwrite ns dev pod-security.kubernetes.io/enforce=baseline

Now, any pod deployed in the dev namespace will be checked against the baseline security standard. If a pod violates the baseline policy (for instance, by attempting to run a privileged container), it will be blocked from starting.

You can also combine warn and audit modes to track violations without blocking pods:

kubectl label --overwrite ns dev     pod-security.kubernetes.io/enforce=baseline     pod-security.kubernetes.io/warn=restricted     pod-security.kubernetes.io/audit=privileged

In this case, PSA will allow pods to run if they meet the baseline policy, but it will issue warnings for restricted-level violations and log any privileged-level violations.

Applying Policies by Default

One of the strengths of PSA is its simplicity in applying policies at the namespace level, but administrators might wonder if there’s a way to apply a default policy across new namespaces automatically. As of now, Kubernetes does not natively provide an option to apply PSA policies globally by default. However, you can use admission webhooks or automation tools such as OPA Gatekeeper or Kyverno to enforce default policies for new namespaces.

Conclusion

Pod Security Admission (PSA) simplifies policy enforcement in Kubernetes clusters, making it easier to ensure compliance with security standards across different environments. By configuring Pod Security Standards at the namespace level and using labels, administrators can control the security level of workloads with ease. The flexibility of PSA allows for efficient security management without the complexity associated with the older Pod Security Policies (PSPs).

For more details on configuring PSA and Pod Security Standards, check the official Kubernetes PSA documentation and Pod Security Standards documentation.

Advanced Helm Tips and Tricks: Uncommon Commands and Flags for Better Kubernetes Management

Advanced Helm Tips and Tricks: Uncommon Commands and Flags for Better Kubernetes Management

Managing Kubernetes resources effectively can sometimes feel overwhelming, but Helm, the Kubernetes package manager, offers several commands and flags that make the process smoother and more intuitive. In this article, we’ll dive into some lesser-known Helm commands and flags, explaining their uses, benefits, and practical examples.

1. helm get values: Retrieving Deployed Chart Values

The helm get values command is essential when you need to see the configuration values of a deployed Helm chart. This is particularly useful when you have a chart deployed but lack access to its original configuration file. With this command, you can achieve an “Infrastructure as Code” approach by capturing the current state of your deployment.

Usage:

helm get values <release-name> \[flags]
  • <release-name>: The name of your Helm release.

Example:

To get the values of a deployed chart named my-release:

helm get values my-release --namespace my-namespace

This command outputs the current values used for the deployment, which is valuable for documentation, replicating the environment, or modifying deployments.

2. Understanding helm upgrade Flags: --reset-values, --reuse-values, and --reset-then-reuse

The helm upgrade command is typically used to upgrade or modify an existing Helm release. However, the behavior of this command can be finely tuned using several flags: --reset-values, --reuse-values, and --reset-then-reuse.

  • --reset-values: Ignores the previous values and uses only the values provided in the current command. Use this flag when you want to override the existing configuration entirely.

Example Scenario: You are deploying a new version of your application, and you want to ensure that no old values are retained.

  helm upgrade my-release my-chart --reset-values --set newKey=newValue
  • --reuse-values: Reuses the previous release’s values and merges them with any new values provided. This flag is useful when you want to keep most of the old configuration but apply a few tweaks.

Example Scenario: You need to add a new environment variable to an existing deployment without affecting the other settings.

  helm upgrade my-release my-chart --reuse-values --set newEnv=production
  • --reset-then-reuse: A combination of the two. It resets to the original values and then merges the old values back, allowing you to start with a clean slate while retaining specific configurations.

Example Scenario: Useful in complex environments where you want to ensure the chart is using the original default settings but retain some custom values.

  helm upgrade my-release my-chart --reset-then-reuse --set version=2.0

3. helm lint: Ensuring Chart Quality in CI/CD Pipelines

The helm lint command checks Helm charts for syntax errors, best practices, and other potential issues. This is especially useful when integrating Helm into a CI/CD pipeline, as it ensures your charts are reliable and adhere to best practices before deployment.

Usage:

helm lint <chart-path> [flags]
  • <chart-path>: Path to the Helm chart you want to validate.

Example:

helm lint ./my-chart/

This command scans the my-chart directory for issues like missing fields, incorrect YAML structure, or deprecated usage. If you’re automating deployments, integrating helm lint into your pipeline helps catch problems early.

Integrating helm lint in a CI/CD Pipeline:

In a Jenkins pipeline, for example, you could add the following stage:

pipeline {
  agent any
  stages {
stage('Lint Helm Chart') {
  steps {
    script {
      sh 'helm lint ./my-chart/'
    }
  }
}
// Other stages like build, test, deploy
  }
}

By adding this stage, you ensure that any syntax or structural issues are caught before proceeding to build or deployment stages.

4. helm rollback: Reverting to a Previous Release

The helm rollback command allows you to revert a release to a previous version. This can be incredibly useful in case of a failed upgrade or deployment, as it provides a way to quickly restore a known good state.

Usage:

helm rollback <release-name> [revision] [flags]
  • <release-name>: The name of your Helm release.
  • [revision]: The revision number to which you want to roll back. If omitted, Helm will roll back to the previous release by default.

Example:

To roll back a release named my-release to its previous version:

helm rollback my-release

To roll back to a specific revision, say revision 3:

helm rollback my-release 3

This command can be a lifesaver when a recent change breaks your application, allowing you to quickly restore service continuity while investigating the issue.

5. helm verify: Validating a Chart Before Use

The helm verify command checks the integrity and validity of a chart before it is deployed. This command ensures that the chart’s package file has not been tampered with or corrupted. It’s particularly useful when you are pulling charts from external repositories or using charts shared across multiple teams.

Usage:

helm verify <chart-path>
  • <chart-path>: Path to the Helm chart archive (.tgz file).

Example:

To verify a downloaded chart named my-chart:

helm verify ./my-chart.tgz

If the chart passes the verification, Helm will output a success message. If it fails, you’ll see details of the issues, which could range from missing files to checksum mismatches.

Conclusion

Leveraging these advanced Helm commands and flags can significantly enhance your Kubernetes management capabilities. Whether you are retrieving existing deployment configurations, fine-tuning your Helm upgrades, or ensuring the quality of your charts in a CI/CD pipeline, these tricks help you maintain a robust and efficient Kubernetes environment.

Exposing TCP Ports Using Istio Ingress Gateway

Exposing TCP Ports Using Istio Ingress Gateway

Istio has become an essential tool for managing HTTP traffic within Kubernetes clusters, offering advanced features such as Canary Deployments, mTLS, and end-to-end visibility. However, some tasks, like exposing a TCP port using the Istio IngressGateway, can be challenging if you’ve never done it before. This article will guide you through the process of exposing TCP ports with Istio Ingress Gateway, complete with real-world examples and practical use cases.

Understanding the Context

Istio is often used to manage HTTP traffic in Kubernetes, providing powerful capabilities such as traffic management, security, and observability. The Istio IngressGateway serves as the entry point for external traffic into the Kubernetes cluster, typically handling HTTP and HTTPS traffic. However, Istio also supports TCP traffic, which is necessary for use cases like exposing databases or other non-HTTP services running in the cluster to external consumers.

Exposing a TCP port through Istio involves configuring the IngressGateway to handle TCP traffic and route it to the appropriate service. This setup is particularly useful in scenarios where you need to expose services like TIBCO EMS or Kubernetes-based databases to other internal or external applications.

Steps to Expose a TCP Port with Istio IngressGateway

1.- Modify the Istio IngressGateway Service:

Before configuring the Gateway, you must ensure that the Istio IngressGateway service is configured to listen on the new TCP port. This step is crucial if you’re using a NodePort service, as this port needs to be opened on the Load Balancer.

   apiVersion: v1
   kind: Service
   metadata:
 name: istio-ingressgateway
 namespace: istio-system
   spec:
 ports:
 - name: http2
   port: 80
   targetPort: 80
 - name: https
   port: 443
   targetPort: 443
 - name: tcp
   port: 31400
   targetPort: 31400
   protocol: TCP

2.- Update the Istio IngressGateway service to include the new port 31400 for TCP traffic.

Configure the Istio IngressGateway: After modifying the service, configure the Istio IngressGateway to listen on the desired TCP port.

apiVersion: networking.istio.io/v1beta1
kind: Gateway
metadata:
  name: tcp-ingress-gateway
  namespace: istio-system
spec:
  selector:
istio: ingressgateway
  servers:
  - port:
	  number: 31400
	  name: tcp
	  protocol: TCP
	hosts:
	- "*"

In this example, the IngressGateway is configured to listen on port 31400 for TCP traffic.

3.- Create a Service and VirtualService:

After configuring the gateway, you need to create a Service that represents the backend application and a VirtualService to route the TCP traffic.

apiVersion: v1
kind: Service
metadata:
  name: tcp-service
  namespace: default
spec:
  ports:
  - port: 31400
	targetPort: 8080
	protocol: TCP
  selector:
app: tcp-app

The Service above maps port 31400 on the IngressGateway to port 8080 on the backend application.

apiVersion: networking.istio.io/v1beta1
kind: VirtualService
metadata:
  name: tcp-virtual-service
  namespace: default
spec:
  hosts:
  - "*"
  gateways:
  - tcp-ingress-gateway
  tcp:
  - match:
	- port: 31400
	route:
	- destination:
		host: tcp-service
		port:
		  number: 8080

The VirtualService routes TCP traffic coming to port 31400 on the gateway to the tcp-service on port 8080.

4.- Apply the Configuration

Apply the above configurations using kubectl to create the necessary Kubernetes resources.

kubectl apply -f istio-ingressgateway-service.yaml
kubectl apply -f tcp-ingress-gateway.yaml
kubectl apply -f tcp-service.yaml
kubectl apply -f tcp-virtual-service.yaml

After applying these configurations, the Istio IngressGateway will expose the TCP port to external traffic.

Practical Use Cases

  • Exposing TIBCO EMS Server: One common scenario is exposing a TIBCO EMS (Enterprise Message Service) server running within a Kubernetes cluster to other internal applications or external consumers. By configuring the Istio IngressGateway to handle TCP traffic, you can securely expose EMS’s TCP port, allowing it to communicate with services outside the Kubernetes environment.
  • Exposing Databases: Another use case is exposing a database running within Kubernetes to external services or different clusters. By exposing the database’s TCP port through the Istio IngressGateway, you enable other applications to interact with it, regardless of their location.
  • Exposing a Custom TCP-Based Service: Suppose you have a custom application running within Kubernetes that communicates over TCP, such as a game server or a custom TCP-based API service. You can use the Istio IngressGateway to expose this service to external users, making it accessible from outside the cluster.

Conclusion

Exposing TCP ports using the Istio IngressGateway can be a powerful technique for managing non-HTTP traffic in your Kubernetes cluster. With the steps outlined in this article, you can confidently expose services like TIBCO EMS, databases, or custom TCP-based applications to external consumers, enhancing the flexibility and connectivity of your applications.

ConfigMap with Optional Values in Kubernetes

ConfigMap with Optional Values in Kubernetes

Kubernetes ConfigMaps are a powerful tool for managing configuration data separately from application code. However, they can sometimes lead to issues during deployment, particularly when a ConfigMap referenced in a Pod specification is missing, causing the application to fail to start. This is a common scenario that can lead to a CreateContainerConfigError and halt your deployment pipeline.

Understanding the Problem

When a ConfigMap is referenced in a Pod’s specification, Kubernetes expects the ConfigMap to be present. If it is not, Kubernetes will not start the Pod, leading to a failed deployment. This can be problematic in situations where certain configuration data is optional or environment-specific, such as proxy settings that are only necessary in certain environments.

Making ConfigMap Values Optional

Kubernetes provides a way to define ConfigMap items as optional, allowing your application to start even if the ConfigMap is not present. This can be particularly useful for environment variables that only need to be set under certain conditions.

Here’s a basic example of how to make a ConfigMap optional:

apiVersion: v1
kind: Pod
metadata:
  name: example-pod
spec:
  containers:
  - name: example-container
    image: nginx
    env:
    - name: OPTIONAL_ENV_VAR
      valueFrom:
        configMapKeyRef:
          name: example-configmap
          key: optional-key
          optional: true

In this example:

  • name: example-configmap refers to the ConfigMap that might or might not be present.
  • optional: true ensures that the Pod will still start even if example-configmap or the optional-key within it is missing.

Practical Use Case: Proxy Configuration

A common use case for optional ConfigMap values is setting environment variables for proxy configuration. In many enterprise environments, proxy settings are only required in certain deployment environments (e.g., staging, production) but not in others (e.g., local development).

apiVersion: v1
kind: ConfigMap
metadata:
  name: proxy-config
data:
  HTTP_PROXY: "http://proxy.example.com"
  HTTPS_PROXY: "https://proxy.example.com"

In your Pod specification, you could reference these proxy settings as optional:

apiVersion: v1
kind: Pod
metadata:
  name: app-pod
spec:
  containers:
  - name: app-container
    image: my-app-image
    env:
    - name: HTTP_PROXY
      valueFrom:
        configMapKeyRef:
          name: proxy-config
          key: HTTP_PROXY
          optional: true
    - name: HTTPS_PROXY
      valueFrom:
        configMapKeyRef:
          name: proxy-config
          key: HTTPS_PROXY
          optional: true

In this setup, if the proxy-config ConfigMap is missing, the application will still start, simply without the proxy settings.

Sample Application

Let’s walk through a simple example to demonstrate this concept. We will create a deployment for an application that uses optional configuration values.

  1. Create the ConfigMap (Optional):
apiVersion: v1
kind: ConfigMap
metadata:
  name: app-config
data:
  GREETING: "Hello, World!"
  1. Deploy the Application:
apiVersion: apps/v1
kind: Deployment
metadata:
  name: hello-world-deployment
spec:
  replicas: 1
  selector:
    matchLabels:
      app: hello-world
  template:
    metadata:
      labels:
        app: hello-world
    spec:
      containers:
      - name: hello-world
        image: busybox
        command: ["sh", "-c", "echo $GREETING"]
        env:
        - name: GREETING
          valueFrom:
            configMapKeyRef:
              name: app-config
              key: GREETING
              optional: true
  1. Deploy and Test:
  2. Deploy the application using kubectl apply -f <your-deployment-file>.yaml.
  3. If the app-config ConfigMap is present, the Pod will output “Hello, World!”.
  4. If the ConfigMap is missing, the Pod will start, but no greeting will be echoed.

Conclusion

Optional ConfigMap values are a simple yet effective way to make your Kubernetes deployments more resilient and adaptable to different environments. By marking ConfigMap keys as optional, you can prevent deployment failures and allow your applications to handle missing configuration gracefully.

Boosting Kubernetes Security: Exploring KubeSec – A Must-Have Tool for Safeguarding Your Cluster

Boosting Kubernetes Security: Exploring KubeSec - A Must-Have Tool for Safeguarding Your Cluster

KubeSec is another tool to help improve the security of our Kubernetes cluster. And we’re seeing so many agencies focus on security to highlight this topic’s importance in modern architectures and deployments. Security is a key component now, probably the most crucial. We need all to step up our game on that topic, and that’s why it is essential to have tools in our toolset to help us on that task without being fully security experts on each of the technologies, such as Kubernetes in this case.

KubeSec is an open-source tool developed by a cloud-native and open-source security consultancy named ControlPlane that helps us perform a security risk analysis on Kubernetes resources.

How Does KubeSec Work?

KubeSec works based on the Kubernetes Manifest Files you use to deploy the different resources, so you need to provide the YAML file to one of the running ways this tool supports. This is an important topic, “one of the running ways,” because KubeSec supports many different running modes that help us cover other use cases.

You can run KubeSec in the following ones:

  • HTTP Mode: KubeSec will be listening to HTTP requests with the content of the YAML and provide a report based on that. This is useful in cases needing server mode execution, such as CICD pipelines, or just security servers to be used by some teams, such as DevOps or Platform Engineering. Also, another critical use-case of this mode is to be part of a Kubernetes Admission Controller on your Kubernetes Cluster so that you can enforce this when developers are deploying resources into the platform itself.
  • SaaS Mode: Similar to HTTP mode but without needing to host it yourself, all available behind kubesec.io kubesec.io when the SaaS mode is of your preference, and you’re not managing sensitive information on those components.
  • CLI Mode: Just to run it yourself as part of your local tests, you will have available another CLI command here: kubesec scan k8s-deployment.yaml
  • Docker Mode: Similar to CLI mode but as part of a docker image, it can also be compatible with the CICD pipelines based on containerized workloads.

KubeScan Output Report

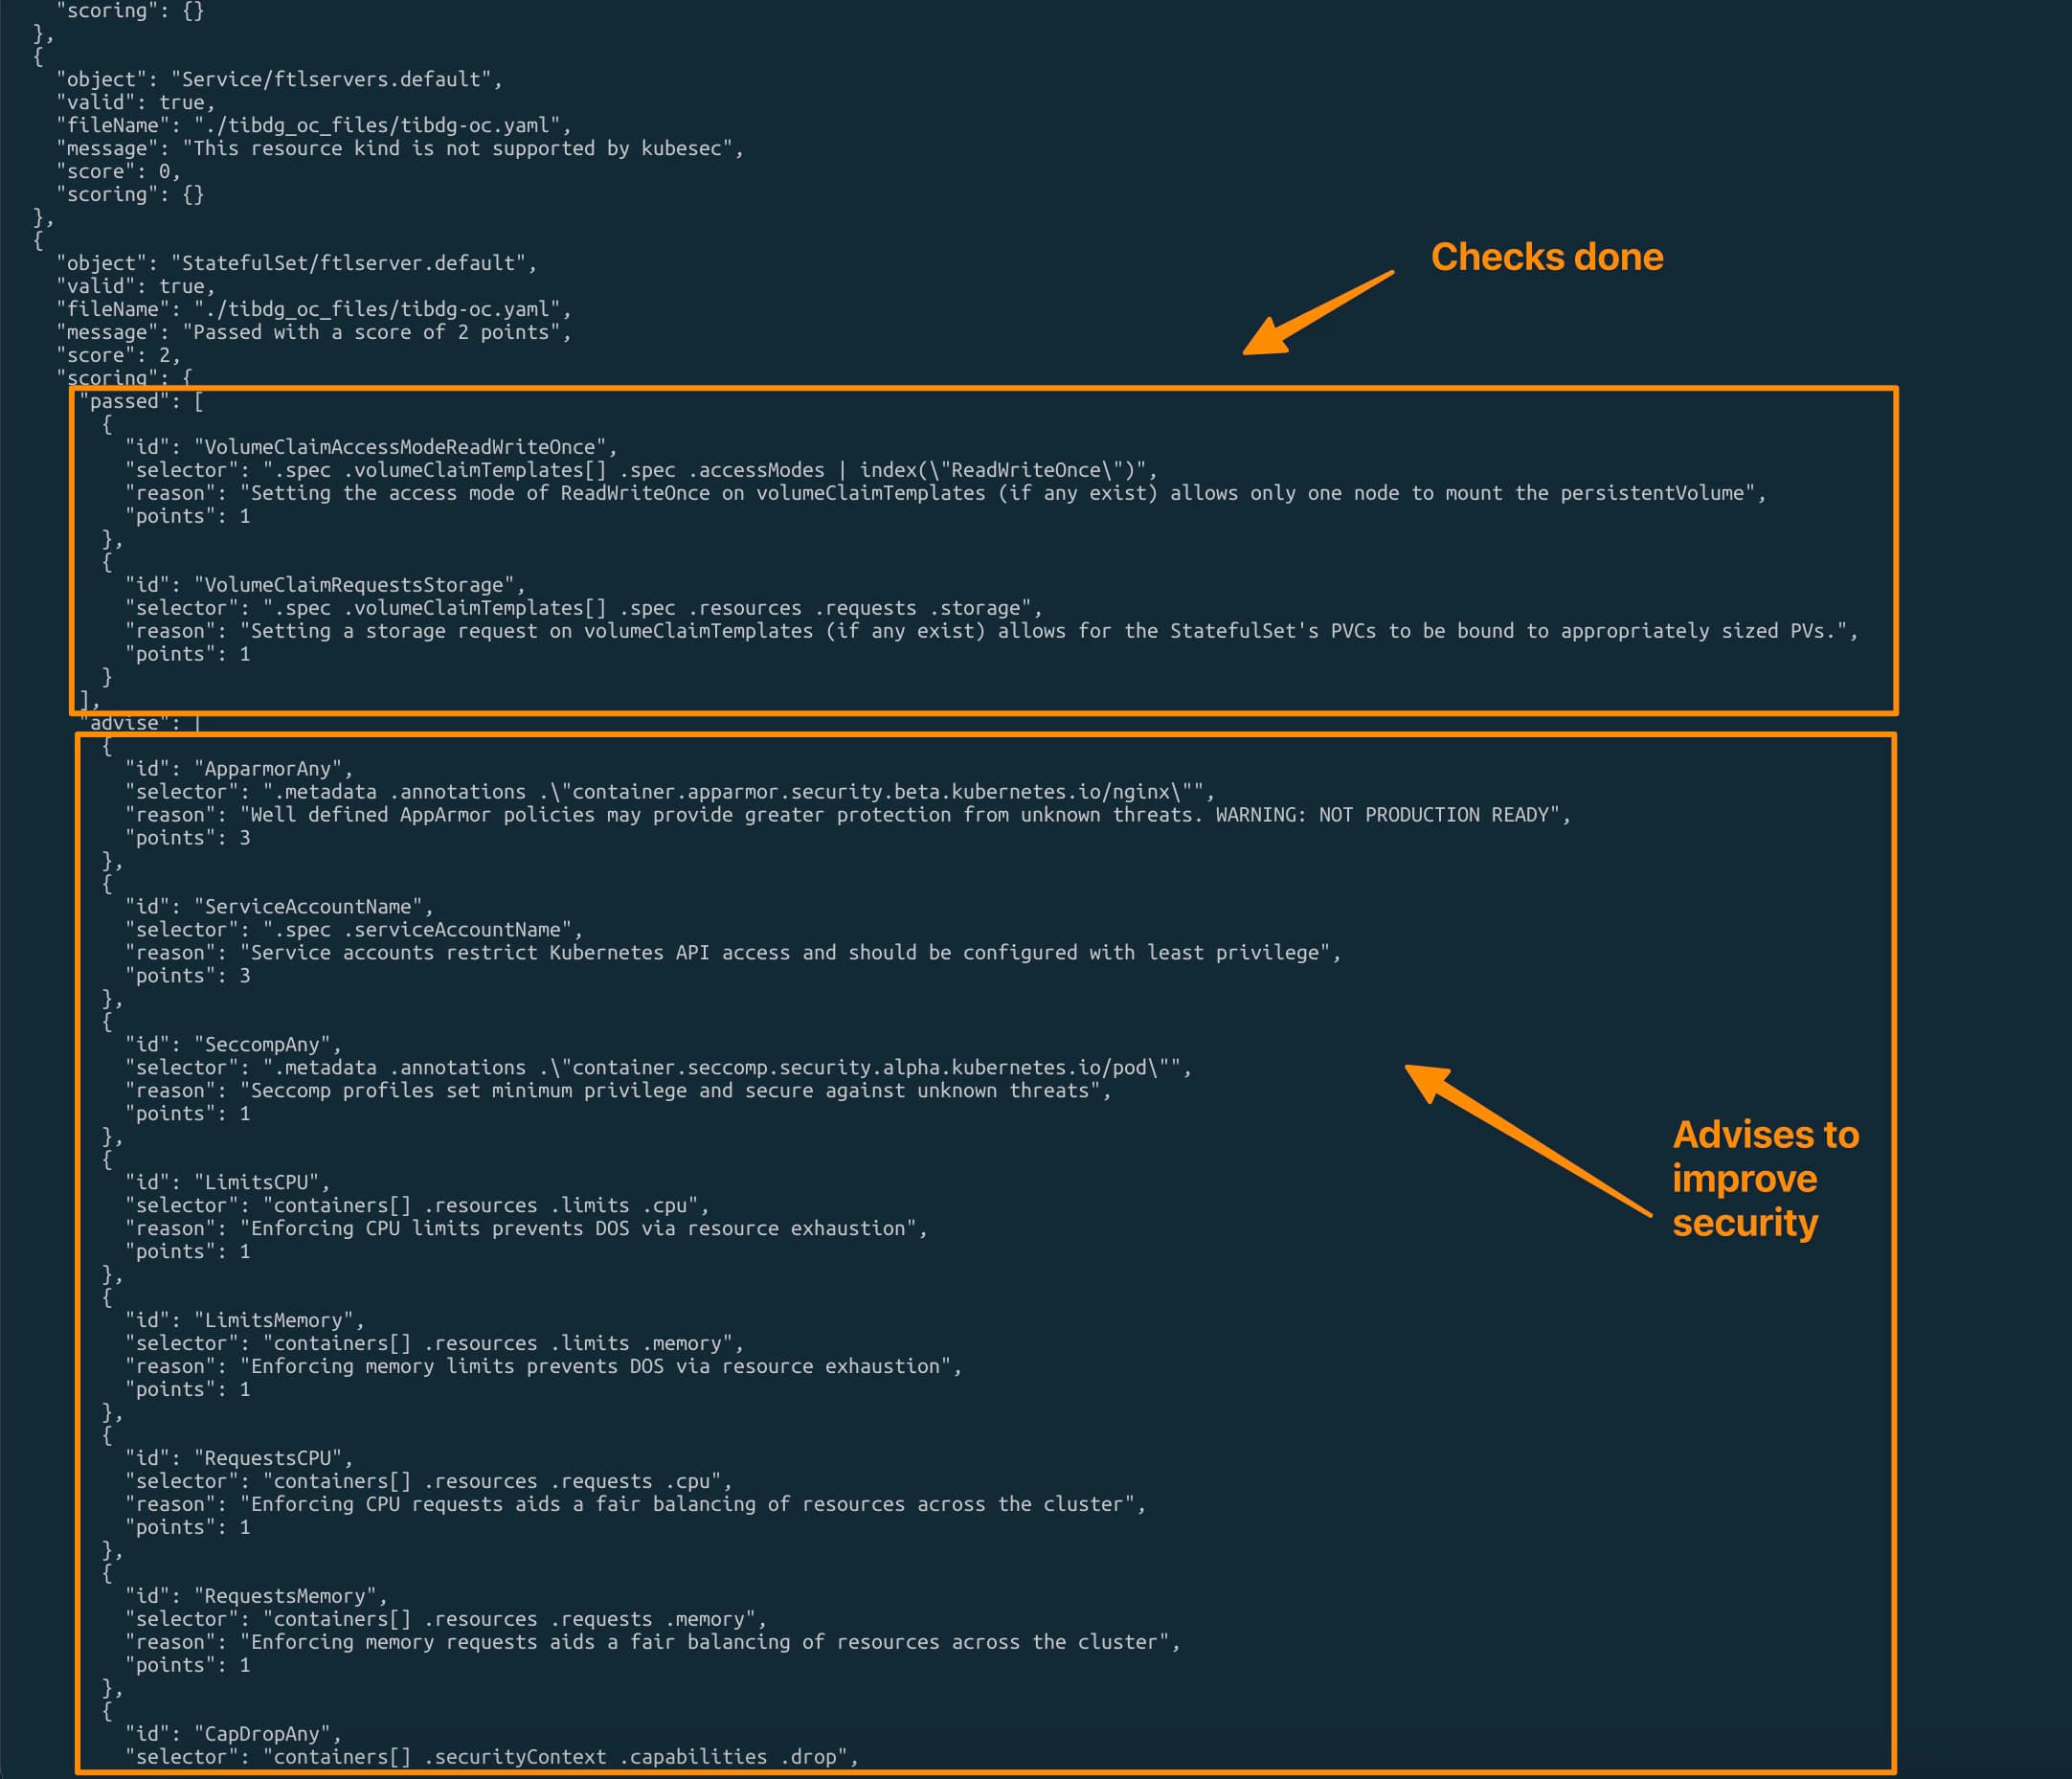
What you will get out of the execution if KubeScan of any of its forms is a JSON report that you can use to improve and score the security level of your Kubernetes resources and some ways to improve it. The reason behind using JSON as the output also simplifies the tool’s usage in automated workloads such as CICD pipelines. Here you can see a sample of the output report you will get:

kubesec sample output

The important thing about the output is the kind of information you will receive from it. As you can see in the picture above, it is separated into two different sections per object. The first one is the “score,” that are the implemented things related to security that provide some score for the security of the object. But also you will have an advice section that provides some things and configurations you can do to improve that score, and because of that, also the global security of the Kubernetes object itself.

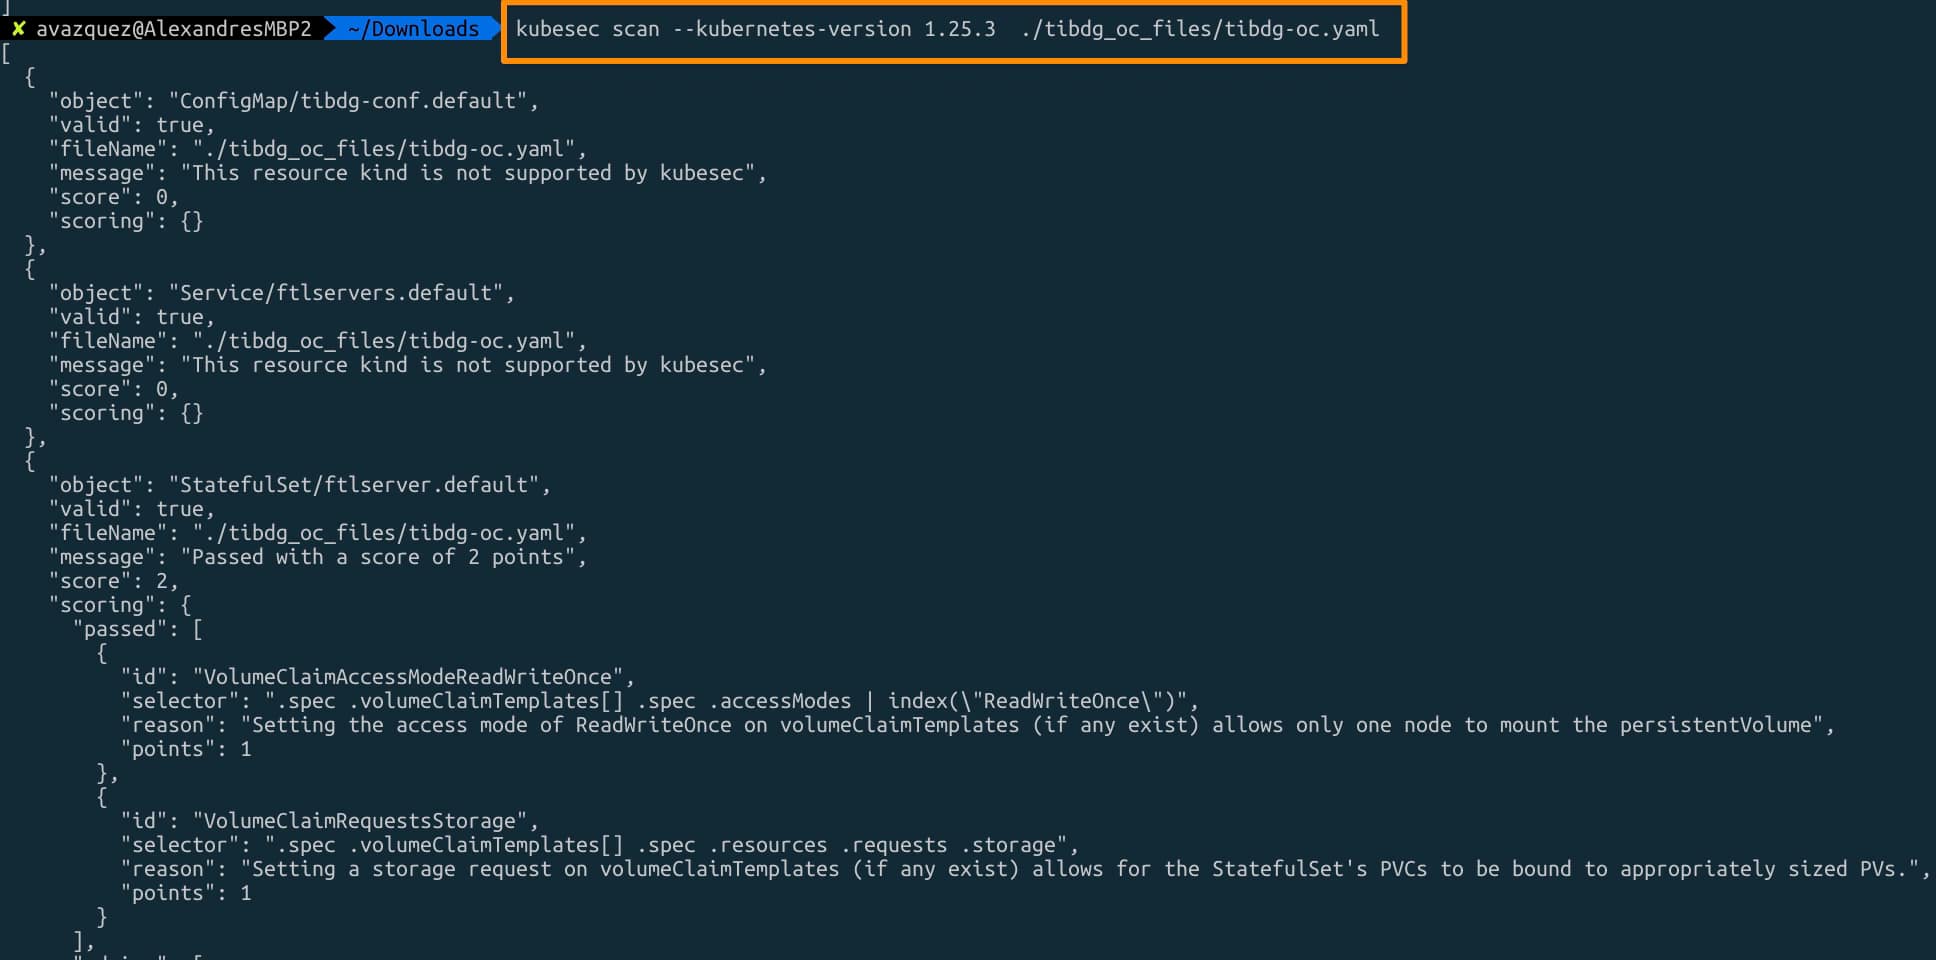
Kubescan also leverages another tool we have commented not far enough on this site, Kubeconform, so you can also specify the target Kubernetes version you’re hitting to have a much more precise report of your specific Kubernetes Manifest. To do that, you can specify the argument --kubernetes-version when you’re launching the command, as you can see in the picture below:

kubesec command with kubernetes-version option

 How To Install KubeScan?

Installation also provides different ways and flavors to see what is best for you. Here are some of the options available at the moment for writing this article:

Conclusion

Emphasizing the paramount importance of security in today’s intricate architectures, KubeSec emerges as a vital asset for bolstering the protection of Kubernetes clusters. Developed by ControlPlane, this open-source tool facilitates comprehensive security risk assessments of Kubernetes resources. Offering versatility through multiple operational modes—such as HTTP, SaaS, CLI, and Docker—KubeSec provides tailored support for diverse scenarios. Its JSON-based output streamlines integration into automated workflows, while its synergy with Kubeconform ensures precise analysis of Kubernetes Manifests. KubeSec’s user-friendly approach empowers security experts and novices, catalyzing an elevated standard of Kubernetes security across the board.

Enhancing Container Security: The Vital Role of ReadOnlyRootFilesystem

Enhancing Container Security: The Vital Role of ReadOnlyRootFilesystem

Introduction

One such important security feature is the use of ReadOnlyRootFilesystem, a powerful tool that can significantly enhance the security posture of your containers.

In the rapidly evolving software development and deployment landscape, containers have emerged as a revolutionary technology. Offering portability, efficiency, and scalability, containers have become the go-to solution for packaging and delivering applications. However, with these benefits come specific security challenges that must be addressed to ensure the integrity of your containerized applications.

A ReadOnlyRootFilesystem is precisely what it sounds like a filesystem that can only be read from, not written to. In containerization, the contents of a container’s filesystem are locked in a read-only state, preventing any modifications or alterations during runtime.

 Advantages of Using ReadOnlyRootFilesystem

  • Reduced Attack Surface: One of the fundamental principles of cybersecurity is reducing the attack surface – the potential points of entry for malicious actors. Enforcing a ReadOnlyRootFilesystem eliminates the possibility of an attacker gaining write access to your container. This simple yet effective measure significantly limits their ability to inject malicious code, tamper with critical files, or install malware.
  • Immutable Infrastructure: Immutable infrastructure is a concept where components are never changed once deployed. This approach ensures consistency and repeatability, as any changes are made by deploying a new instance rather than modifying an existing one. By applying a ReadOnlyRootFilesystem, you’re essentially embracing the principles of immutable infrastructure within your containers, making them more resistant to unauthorized modifications.
  • Malware Mitigation: Malware often relies on gaining written access to a system to carry out its malicious activities. By employing a ReadOnlyRootFilesystem, you erect a significant barrier against malware attempting to establish persistence or exfiltrate sensitive data. Even if an attacker manages to compromise a container, their ability to install and execute malicious code is severely restricted.
  • Enhanced Forensics and Auditing: In the unfortunate event of a security breach, having a ReadOnlyRootFilesystem in place can assist in forensic analysis. Since the filesystem remains unaltered, investigators can more accurately trace the attack vector, determine the extent of the breach, and identify the vulnerable entry points.

Implementation Considerations

Implementing a ReadOnlyRootFilesystem in your containerized applications requires a deliberate approach:

  • Image Design: Build your container images with the ReadOnlyRootFilesystem concept in mind. Make sure to separate read-only and writable areas of the filesystem. This might involve creating volumes for writable data or using environment variables to customize runtime behavior.
  • Runtime Configuration: Containers often require write access for temporary files, logs, or other runtime necessities. Carefully design your application to use designated directories or volumes for these purposes while keeping the critical components read-only.
  • Testing and Validation: Thoroughly test your containerized application with the ReadOnlyRootFilesystem configuration to ensure it functions as intended. Pay attention to any runtime errors, permission issues, or unexpected behavior that may arise.

How to Define a Pod to be ReadOnlyRootFilesystem?

To define a Pod as “ReadOnlyRootFilesystem,” this is one of the flags that belong to the securityContext section of the pod, as you can see in the sample below:

apiVersion: v1
kind: Pod
metadata:
  name: <Pod name>
spec:
  containers:
  - name: <container name>
    image: <image>
    securityContext:
      readOnlyRootFilesystem: true

Conclusion

As the adoption of containers continues to surge, so does the importance of robust security measures. Incorporating a ReadOnlyRootFilesystem into your container strategy is a proactive step towards safeguarding your applications and data. By reducing the attack surface, fortifying against malware, and enabling better forensics, you’re enhancing the overall security posture of your containerized environment.

As you embrace immutable infrastructure within your containers, you’ll be better prepared to face the ever-evolving landscape of cybersecurity threats. Remember, when it comes to container security, a ReadOnlyRootFilesystem can be the shield that protects your digital assets from potential harm.

Exploring Ephemeral Containers in Kubernetes: Unveiling a Powerful Debugging Tool

Exploring Ephemeral Containers in Kubernetes: Unveiling a Powerful Debugging Tool

In the dynamic and ever-evolving world of container orchestration, Kubernetes continues to reign as the ultimate choice for managing, deploying, and scaling containerized applications. As Kubernetes evolves, so do its features and capabilities, and one such fascinating addition is the concept of Ephemeral Containers. In this blog post, we will delve into the world of Ephemeral Containers, understanding what they are, exploring their primary use cases, and learning how to implement them, all with guidance from the Kubernetes official documentation.

 What Are Ephemeral Containers?

Ephemeral Containers, introduced as an alpha feature in Kubernetes 1.16 and reached a stable level on the Kubernetes 1.25 version, offer a powerful toolset for debugging, diagnosing, and troubleshooting issues within your Kubernetes pods without requiring you to alter your pod’s original configuration. Unlike regular containers that are part of the central pod’s definition, ephemeral containers are dynamically added to a running pod for a short-lived duration, providing you with a temporary environment to execute diagnostic tasks.

The good thing about ephemeral containers is that they allow you to have all the required tools to do the job (debug, data recovery, or anything else that could be required) without adding more devices to the base containers and increasing the security risk based on that action.

 Main Use-Cases of Ephemeral Containers

  • Troubleshooting and Debugging: Ephemeral Containers shine brightest when troubleshooting and debugging. They allow you to inject a new container into a problematic pod to gather logs, examine files, run commands, or even install diagnostic tools on the fly. This is particularly valuable when encountering issues that are difficult to reproduce or diagnose in a static environment.
  • Log Collection and Analysis: When a pod encounters issues, inspecting its logs is often essential. Ephemeral Containers make this process seamless by enabling you to spin up a temporary container with log analysis tools, giving you instant access to log files and aiding in identifying the root cause of problems.
  • Data Recovery and Repair: Ephemeral Containers can also be used for data recovery and repair scenarios. Imagine a situation where a database pod faces corruption. With an ephemeral container, you can mount the pod’s storage volume, perform data recovery operations, and potentially repair the data without compromising the running pod.
  • Resource Monitoring and Analysis: Performance bottlenecks or resource constraints can sometimes affect a pod’s functionality. Ephemeral Containers allow you to analyze resource utilization, run diagnostics, and profile the pod’s environment, helping you optimize its performance.

Implementing Ephemeral Containers

Thanks to Kubernetes ‘ user-friendly approach, implementing ephemeral containers is straightforward. Kubernetes provides the kubectl debug command, which streamlines the process of attaching ephemeral containers to pods. This command allows you to specify the pod and namespace and even choose the debugging container image to be injected.

kubectl debug <pod-name> -n <namespace> --image=<debug-container-image>

You can go even beyond, and instead of adding the ephemeral containers to the running pod, you can do the same to a copy of the pod, as you can see in the following command:

kubectl debug myapp -it --image=ubuntu --share-processes --copy-to=myapp-debug

Finally, once you have done your duty, you can permanently remove it using a kubectl delete command, and that’s it.

It’s essential to notice that all these actions require direct access to the environment. Even that temporarily generates a mismatch on the “infrastructure-as-code” deployment, as we’re manipulating the runtime status temporarily. Hence, this approach is much more challenging to implement if you use some GitOps practices or tools such as Rancher Fleet or ArgoCD.

Conclusion

Ephemeral Containers, while currently a stable feature since the Kubernetes 1.25 release, offer impressive capabilities for debugging and diagnosing issues within your Kubernetes pods. By allowing you to inject temporary containers into running pods dynamically, they empower you to troubleshoot problems, collect logs, recover data, and optimize performance without disrupting your application’s core functionality. As Kubernetes continues to evolve, adding features like Ephemeral Containers demonstrates its commitment to providing developers with tools to simplify the management and maintenance of containerized applications. So, the next time you encounter a stubborn issue within your Kubernetes environment, remember that Ephemeral Containers might be the debugging superhero you need!

For more detailed information and usage examples, check out the Kubernetes official documentation on Ephemeral Containers. Happy debugging!

Safeguarding Your Servers: Preventing Information Disclosure with Istio Service Mesh

Safeguarding Your Servers: Preventing Information Disclosure with Istio Service Mesh

In today’s digital landscape, where data breaches and cyber threats are becoming increasingly sophisticated, ensuring the security of your servers is paramount. One of the critical security concerns that organizations must address is “Server Information Disclosure.” Server Information Disclosure occurs when sensitive information about a server’s configuration, technology stack, or internal structure is inadvertently exposed to unauthorized parties. Hackers can exploit this vulnerability to gain insights into potential weak points and launch targeted attacks. Such breaches can lead to data theft, service disruption, and reputation damage.

Information Disclosure and Istio Service Mesh

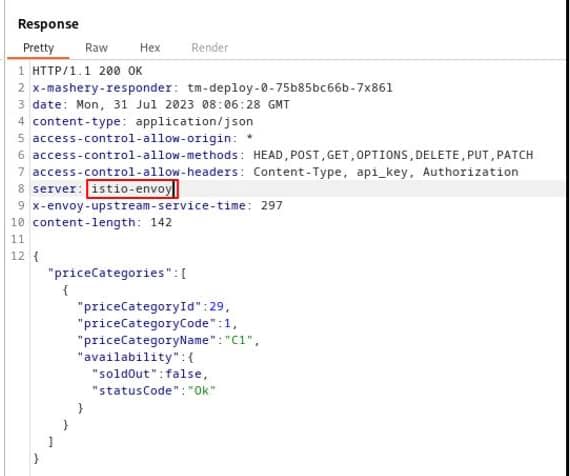
One example is the Server HTTP Header, usually included in most of the HTTP responses where you have the server that is providing this response. The values can vary depending on the stack, but matters such as Jetty, Tomcat, or similar ones are usually seen. But also, if you are using a Service Mesh such as Istio, you will see the header with a value of istio-envoy, as you can see here:

Information Disclosure of Server Implementation using Istio Service mesh

As commented, this is of such importance for several levels of security, such as:

  • Data Privacy: Server information leakage can expose confidential data, undermining user trust and violating data privacy regulations such as GDPR and HIPAA.
  • Reduced Attack Surface: By concealing server details, you minimize the attack surface available to potential attackers.
  • Security by Obscurity: While not a foolproof approach, limiting disclosure adds an extra layer of security, making it harder for hackers to gather intelligence.

How to mitigate that with Istio Service Mesh?

When using Istio, we can define different rules to add and remove HTTP headers based on our needs, as you can see in the following documentation here: https://discuss.istio.io/t/remove-header-operation/1692 using simple clauses to the definition of your VirtualService as you can see here:

apiVersion: networking.istio.io/v1alpha3
kind: VirtualService
metadata:
  name: k8snode-virtual-service
spec:
  hosts:
  - "example.com"
  gateways:
  - k8snode-gateway
  http:
    headers:
      response:
        remove:
          - "x-my-fault-source"
  - route:
    - destination:
        host: k8snode-service
        subset: version-1 

Unfortunately, this is not useful for all HTTP headers, especially the “main” ones, so the ones that are not custom added by your workloads but the ones that are mainly used and defined in the HTTP W3C standard https://www.w3.org/Protocols/

So, in the case of the Server HTTP header is a little bit more complex to do, and you need to use an EnvoyFilter, one of the most sophisticated objects part of the Istio Service Mesh. Based on the words in the official Istio documentation, an EnvoyFilter provides a mechanism to customize the Envoy configuration generated by Istio Pilot. So, you can use EnvoyFilter to modify values for certain fields, add specific filters, or even add entirely new listeners, clusters, etc.

EnvoyFilter Implementation to Remove Header

So now that we know that we need to create a custom EnvoyFilter let’s see which one we need to use to remove the Server header and how this is made to get more knowledge about this component. Here you can see the EnvoyFilter for that job:

---
apiVersion: networking.istio.io/v1alpha3
kind: EnvoyFilter
metadata:
  name: gateway-response-remove-headers
  namespace: istio-system
spec:
  workloadSelector:
    labels:
      istio: ingressgateway
  configPatches:
  - applyTo: NETWORK_FILTER
    match:
      context: GATEWAY
      listener:
        filterChain:
          filter:
            name: "envoy.filters.network.http_connection_manager"
    patch:
      operation: MERGE
      value:
        typed_config:
          "@type": "type.googleapis.com/envoy.extensions.filters.network.http_connection_manager.v3.HttpConnectionManager"
          server_header_transformation: PASS_THROUGH
  - applyTo: ROUTE_CONFIGURATION
    match:
      context: GATEWAY
    patch:
      operation: MERGE
      value:
        response_headers_to_remove:
        - "server"

So let’s focus on the parts of the specification of the EnvoyFilter where we can get for one side the usual workloadSelector, to know where this component will be applied, that in this case will be the istio ingressgateway. Then we enter into the configPatches section, that are the sections where we use the customization that we need to do, and in our case, we have two of them:

Both act on the context: GATEWAY and apply to two different objects: NETWORK\_FILTER AND ROUTE\_CONFIGURATION. You can also use filters on sidecars to affect the behavior of them. The first bit what it does is including the custom filter http\_connection\_maanger that allows the manipulation of the HTTP context, including for our primary purpose also the HTTP header, and then we have the section bit that acts on the ROUTE\_CONFIGURATION removing the server header as we can see by using the option response_header_to_remove

Conclusion

As you can see, this is not easy to implement. Still, at the same time, it is evidence of the power and low-level capabilities that you have when using a robust service mesh such as Istio to interact and modify the behavior of any tiny detail that you want for your benefit and, in this case, also to improve and increase the security of your workloads deployed behind the Service Mesh scope.

In the ever-evolving landscape of cybersecurity threats, safeguarding your servers against information disclosure is crucial to protect sensitive data and maintain your organization’s integrity. Istio empowers you to fortify your server security by providing robust tools for traffic management, encryption, and access control.

Remember, the key to adequate server security is a proactive approach that addresses vulnerabilities before they can be exploited. Take the initiative to implement Istio and elevate your server protection.

Enhancing Service Mesh DNS Resolution with Istio’s Proxy DNS Capability: Benefits and Use-Cases

Enhancing Service Mesh DNS Resolution with Istio's Proxy DNS Capability: Benefits and Use-Cases

Istio is a popular open-source service mesh that provides a range of powerful features for managing and securing microservices-based architectures. We have talked a lot about its capabilities and components, but today we will talk about how we can use Istio to help with the DNS resolution mechanism.

As you already know, In a typical Istio deployment, each service is accompanied by a sidecar proxy, Envoy, which intercepts and manages the traffic between services. The Proxy DNS capability of Istio leverages this proxy to handle DNS resolution requests more intelligently and efficiently.

Traditionally, when a service within a microservices architecture needs to communicate with another service, it relies on DNS resolution to discover the IP address of the target service. However, traditional DNS resolution can be challenging to manage in complex and dynamic environments, such as those found in Kubernetes clusters. This is where the Proxy DNS capability of Istio comes into play.

 Istio Proxy DNS Capabilities

With Proxy DNS, Istio intercepts and controls DNS resolution requests from services and performs the resolution on their behalf. Instead of relying on external DNS servers, the sidecar proxies handle the DNS resolution within the service mesh. This enables Istio to provide several valuable benefits:

  • Service discovery and load balancing: Istio’s Proxy DNS allows for more advanced service discovery mechanisms. It can dynamically discover services and their corresponding IP addresses within the mesh and perform load balancing across instances of a particular service. This eliminates the need for individual services to manage DNS resolution and load balancing.
  • Security and observability: Istio gains visibility into the traffic between services by handling DNS resolution within the mesh. It can apply security policies, such as access control and traffic encryption, at the DNS level. Additionally, Istio can collect DNS-related telemetry data for monitoring and observability, providing insights into service-to-service communication patterns.
  • Traffic management and control: Proxy DNS enables Istio to implement advanced traffic management features, such as routing rules and fault injection, at the DNS resolution level. This allows for sophisticated traffic control mechanisms within the service mesh, enabling A/B testing, canary deployments, circuit breaking, and other traffic management strategies.

 Istio Proxy DNS Use-Cases

There are some moments when you cannot or don’t want to rely on the normal DNS resolution. Why is that? Starting because DNS is a great protocol but lacks some capabilities, such as location discovery. If you have the same DNS assigned to three IPs, it will provide each of them in a round-robin fashion and cannot rely on the location.

Or you have several IPs, and you want to block some of them for some specific service; these are great things you can do with Istio Proxy DNS.

Istio Proxy DNS Enablement

You need to know that Istio Proxy DNS capabilities are not enabled by default, so you must help if you want to use it. The good thing is that you can allow that at different levels, from the full mesh level to just a single pod level, so you can choose what is best for you in each case.

For example, if we want to enable it at the pod level, we need to inject the following configuration in the Istio proxy:

    proxy.istio.io/config: |
		proxyMetadata:   
         # Enable basic DNS proxying
         ISTIO_META_DNS_CAPTURE: "true" 
         # Enable automatic address allocation, optional
         ISTIO_META_DNS_AUTO_ALLOCATE: "true"

The same configuration can be part of the Mesh level as part of the operator installation, as you can find the documentation here on the Istio official page.

Conclusion

In summary, the Proxy DNS capability of Istio enhances the DNS resolution mechanism within the service mesh environment, providing advanced service discovery, load balancing, security, observability, and traffic management features. Istio centralizes and controls DNS resolution by leveraging the sidecar proxies, simplifying the management and optimization of service-to-service communication in complex microservices architectures.

Unlocking Flexibility and Reusability: Harnessing the Power of Helm Multiple Instances Subcharts

Unlocking Flexibility and Reusability: Harnessing the Power of Helm Multiple Instances Subcharts

Helm Multiple Instances Subchart usages as part of your main chart could be something that, from the beginning, can sound strange. We already commented about the helm charts sub-chart and dependencies in the blog because the usual use case is like that:

I have a chart that needs another component, and I “import” it as a sub-chart, which gives me the possibility to deploy the same component and customize its values without needing to create another chart copy and, as you can imagine simplifying a lot of the management of the charts, a sample can be like that:

Discover how multiple subcharts can revolutionize your Helm deployments. Learn how to leverage the power of reusability and customization, allowing you to deploy identical components with unique configurations. Enhance flexibility and simplify management with this advanced Helm feature. Unlock the full potential of your microservices architecture and take control of complex application deployments. Dive into the world of multiple subcharts and elevate your Helm charts to the next level.

So, I think that’s totally clear, but what about are we talking now? The use-case is to have the same sub-chart defined twice. So, imagine this scenario, we’re talking about that instead of this:

# Chart.yaml
dependencies:
- name: nginx
  version: "1.2.3"
  repository: "https://example.com/charts"
- name: memcached
  version: "3.2.1"
  repository: "https://another.example.com/charts"

We’re having something like this

# Chart.yaml
dependencies:
- name: nginx
  version: "1.2.3"
  repository: "https://example.com/charts"
- name: memcached-copy1
  version: "3.2.1"
  repository: "https://another.example.com/charts"
- name: memcached-copy2
  version: "3.2.1"
  repository: "https://another.example.com/charts"

So we have the option to define more than one “instance” of the same sub chart. And I guess, at this moment, you can start asking to yourself: “What are the use-case where I could need this?”

Because that’s quite understandable, unless you need it you will never realize about that. It is the same that happens to me. So let’s talk a bit about possible use cases for this.

 Use-Cases For Multi Instance Helm Dependency

Imagine that you’re deploying a helm chart for a set of microservices that belongs to the scope of the same application and each of the microservices has the same technology base, that can be TIBCO BusinessWorks Container Edition or it can be Golang microservices. So all of them has the same base so it can use the same chart “bwce-microservice” or “golang-microservices” but each of them has its own configuration, for example:

  • Each of them will have its own image name that would differ from one to the other.
  • Each of them will have its own configuration that will differ from one to the other.
  • Each of them will have its own endpoints that will differ and probably even connecting to different sources such as databases or external systems.

So, this approach would help us reuse the same technology helm chart, “bwce” and instance it several times, so we can have each of them with its own configuration without the need to create something “custom” and keeping the same benefits in terms of maintainability that the helm dependency approach provides to us.

 How can we implement this?

Now that we have a clear the use-case that we’re going to support, the next step is regarding how we can do this a reality. And, to be honest, this is much simpler than you can think from the beginning, let’s start with the normal situation when we have a main chart, let’s call it a “program,” that has included a “bwce” template as a dependency as you can see here:

name: multi-bwce
description: Helm Chart to Deploy a TIBCO BusinessWorks Container Edition Application
apiVersion: v1
version: 0.2.0
icon: 
appVersion: 2.7.2

dependencies:
- name: bwce
  version: ~1.0.0
  repository: "file:///Users/avazquez/Data/Projects/DET/helm-charts/bwce"

And now, we are going to move to a multi-instance approach where we will require two different microservices, let’s call it serviceA and serviceB, and both of them we will use the same bwce helm chart.

So the first thing we will modify is the Chart.yaml as follows:

name: multi-bwce
description: Helm Chart to Deploy a TIBCO BusinessWorks Container Edition Application
apiVersion: v1
version: 0.2.0
icon: 
appVersion: 2.7.2

dependencies:
- name: bwce
  alias: serviceA
  version: ~0.2.0
  repository: "file:///Users/avazquez/Data/Projects/DET/helm-charts/bwce"
- name: bwce
  alias: serviceB
  version: ~0.2.0
  repository: "file:///Users/avazquez/Data/Projects/DET/helm-charts/bwce"

The important part here is how we declare the dependency. As you can see in the name we still keeping the same “name” but they have an additional field named “alias” and this alias is what we will help to later identify the properties for each of the instances as we required. With that, we’re already have our two serviceA and serviceB instance definition and we can start using it in the values.yml as follows:

# This is a YAML-formatted file.
# Declare variables to be passed into your templates.

serviceA:
  image: 
    imageName: 552846087011.dkr.ecr.eu-west-2.amazonaws.com/tibco/serviceA:2.5.2
    pullPolicy: Always
serviceB:  
  image: 
    imageName: 552846087011.dkr.ecr.eu-west-2.amazonaws.com/tibco/serviceB:2.5.2
    pullPolicy: Always
  

 Conclusion

The main benefit of this is that it enhances the options of using helm chart for “complex” applications that require different instances of the same kind of components and at the same time.

That doesn’t mean that you need a huge helm chart for your project because this will go against all the best practices of the whole containerization and microservices approach but at least it will give you the option to define different levels of abstraction as you want, keeping all the benefits from a management perspective.