We already have talked about the importance of Log Aggregation in Kubernetes and why the change in the behavior of the components makes it a mandatory requirement for any new architecture we deployed today.
To solve that part, we have a lot of different stacks that you probably have heard about. For example, if we follow the traditional Elasticsearch path, we will have the pure ELK stack from Elasticsearch, Logstash, and Kibana. Now this stack has been extended with the different “Beats” (FileBeat, NetworkBeat, …) that provides a light log forwarder to be added to the task.
Also, you can change Logstash for a CNCF component such as Fluentd that probably you have heard about, and in that case, we’re talking about an EFK stack following the same principle. And also, have the Grafana Labs view using promtail, Grafana Loki, and Grafana for dashboarding following a different perspective.
Then you can switch and change any component for the one of your preference, but in the end, you will have three different kinds of components:
- Forwarder: Component that will listen to all the log inputs, mainly the stdout/stderr output from your containers, and push it to a central component.
- Aggregator: Component that will receive all the traces for the forwarded, and it will have some rules to filter some of the events, format, and enrich the ones received before sending it to central storage.
- Storage: Component that will receive the final traces to be stored and retrieved for the different clients.
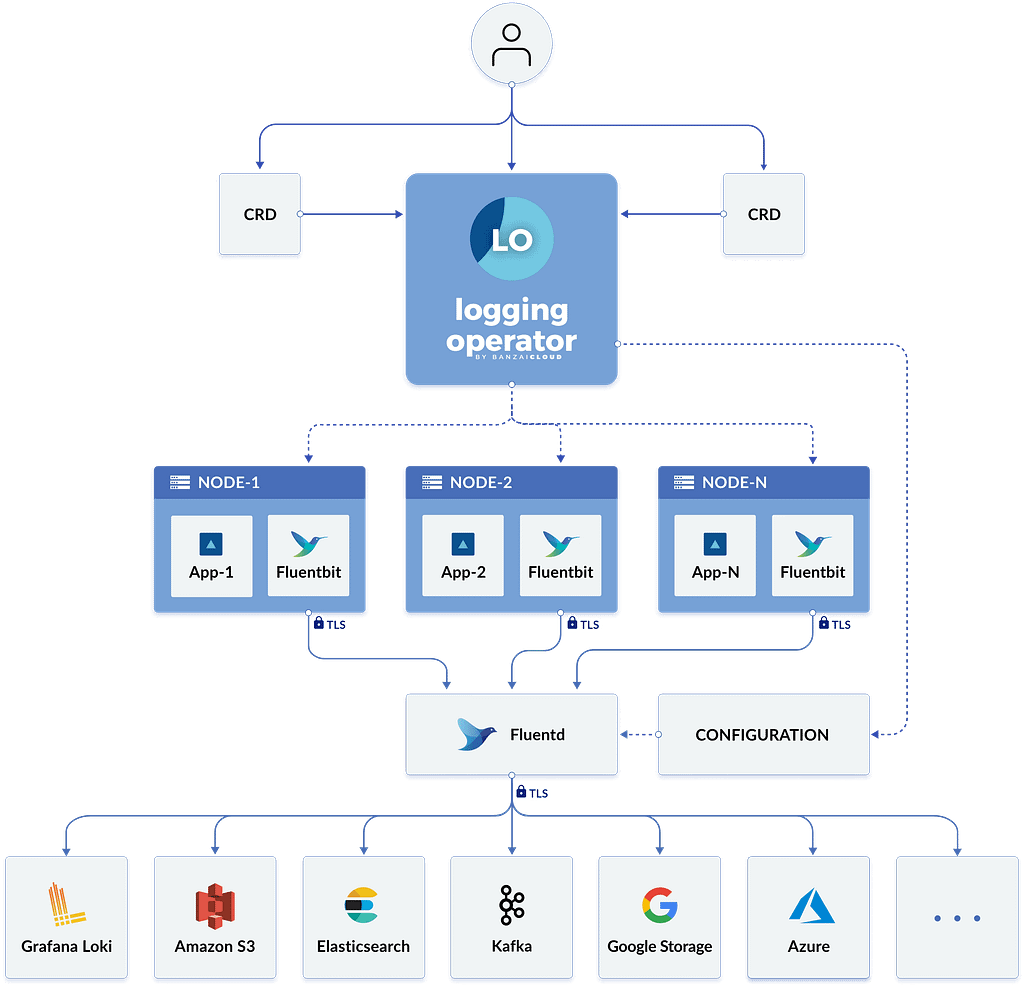
To simplify the management of that in Kubernetes, we have a great Kubernetes Operator named BanzaiCloud Logging Operator that tries to follow that approach in a declarative / policy manner. So let’s see how it works, and to explain it better, I will use its central diagram from its website:

This operator uses the same technologies we were talking about. It covers mainly the two first steps: Forwarding and Aggregation and the configuration to be sent to a Central Storage of your choice. To do that works with the following technologies, all of them part of the CNCF Landscape:
- Fluent-bit will act as a forwarded deployed on a DaemonSet mode to collect all the logs you have configured.
- Fluentd will act as an aggregator defining the flows and rules of your choice to adapt the trace flow you are receiving and sending to the output of your choice.
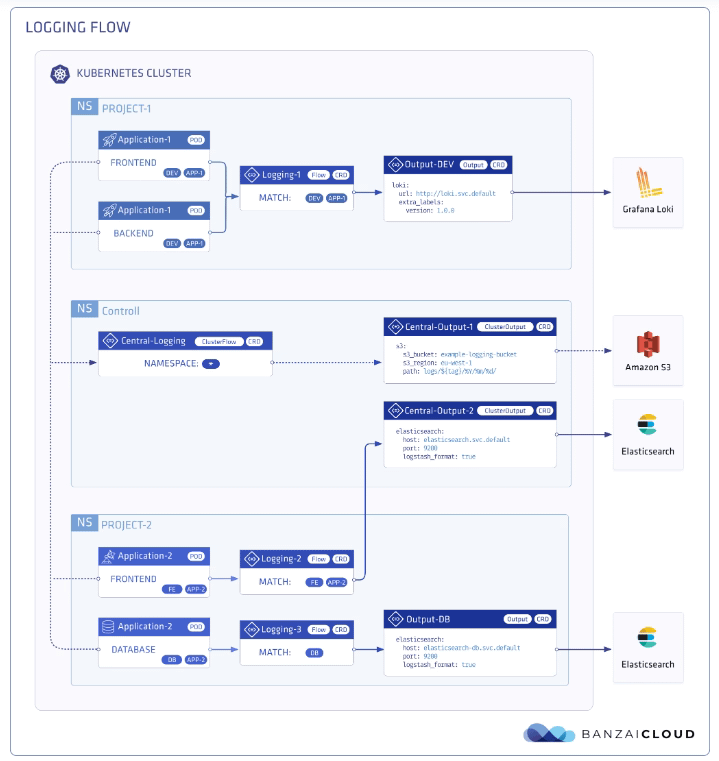
And as this is a Kubernetes Operator, this works in a declarative way. We will define a set of objects that will define our logging policies. We have the following components:
- logging – The logging resource defines the logging infrastructure for your cluster that collects and transports your log messages. It also contains configurations for Fluentd and Fluent-bit.
- output / clusteroutput – Defines an Output for a logging flow, where the log messages are sent. output will be namespaced based, and clusteroutput will be cluster based.
- flow / clusterflow – Defines a logging flow using filters and outputs. The flow routes the selected log messages to the specified outputs. flow will be namespaced based, and clusterflows will be cluster based.
In the picture below, you will see how these objects are “interacting” to define your desired logging architecture:

And apart from the policy mode, it also includes a lot of great features such as:
- Namespace isolation
- Native Kubernetes label selectors
- Secure communication (TLS)
- Configuration validation
- Multiple flow support (multiply logs for different transformations)
- Multiple output support (store the same logs in multiple storages: S3, GCS, ES, Loki, and more…)
- Multiple logging system support (multiple Fluentd, Fluent Bit deployment on the same cluster)
In upcoming articles we were talking about how we can implement this so you can see all the benefits that this CRD-based, policy-based approach can provide to your architecture.
📚 Want to dive deeper into Kubernetes? This article is part of our comprehensive Kubernetes Architecture Patterns guide, where you’ll find all fundamental and advanced concepts explained step by step.

