Learn about the new horizontally-scalable, highly available, multi-tenant log aggregation system inspired by Prometheus that can be the best fit for your logging architecture
Loki vs ELK is something you are reading and hearing each time more often as from some time it is a raise on the dispute of becoming the de-factor standard for log aggregation architectures.
When we talk about Cloud-Native Architecture, log aggregation is something key that you need to consider. The old practices that we followed in the on-premises virtual machine approach for logging are not valid anymore.
We already cover this topic in my previous post that I recommend you to talk a look in case you haven’t read it yet, but this is not the topic for today.

Elasticsearch as the core and the different derívate de stacks like ELK/EFK had gained popularity in the last years, being pretty much the default open-source option when we talked about log aggregation and one of the options. The main public cloud providers have also adopted this solution as part of their own offering as the Amazon Elasticsearch Service provides.
But Elasticsearch is not perfect. If you have already used it, you probably know about it. Still, because their features are so awesome, especially on the searching and indexing capabilities, it has been the kind of leader today. But other topics like the storage use, the amount of power you need to handle it, and the architecture with different kinds of nodes (master, data, ingester) increase its complexity for cases when we need something smaller.
And to fill this gap is where our main character for today’s post arrives: Loki or Grafana Loki.

Loki is a logging management system created as part of the Grafana project, and it has been created with a different approach in mind than Elasticsearch.
Loki is a horizontally-scalable, highly-available, multi-tenant log aggregation system inspired by Prometheus. It is designed to be very cost effective and easy to operate. It does not index the contents of the logs, but rather a set of labels for each log stream.
So as we can read in the definition from their own page above, it covers several interesting topics in comparison with Elasticsearch:
- First of all, it addresses some of the usual pain points for ELK customers: It is very cost-effective and easy to operate.
- It clearly says that the approach is not the same as ELK, you are not going to have a complete index of the payload for the events, but it is based on different labels that you can define for each log stream.
- Prometheus inspires that, which is critical because it enabled the idea to use log traces as metrics to empower our monitoring solutions.
Let’s start with the initial questions when we show an interesting new technology, and we would like to start testing it.
How can I install Loki?
Loki is distributed in different flavors to be installed in your environment in the way you need it.
- SaaS: provided as part of the hosting solution of Grafana Cloud.
- On-Premises: Provided as a normal binary to be download to run in an on-premises mode.
- Cloud: Provided a docker image or even a Helm Chart to be deployed into your Kubernetes-based environment.
GrafanaLabs teams also provide Enterprise Support for Loki if you would like to use it on production mode in your company. Still, at the same time, all the code is licensed using Apache License 2.0, so you can take a look at all the code and contribute to it.
How does Loki work?

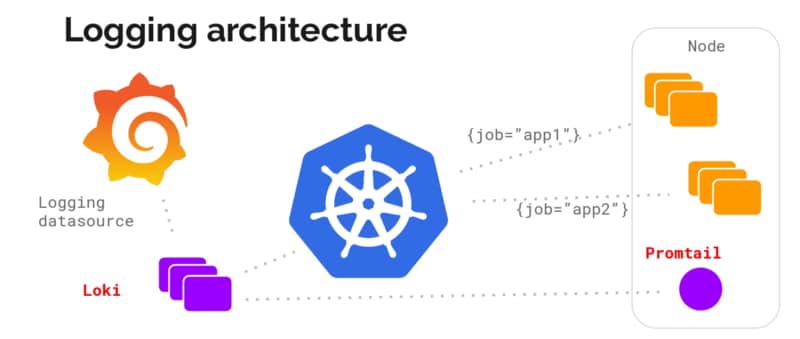
Architecture wise is very similar to the ELK/EFK stack and follow the same approach of “collectors” and “indexers” as ELK has:
- Loki itself is the central node of the architecture responsible for storing the log traces and their labels and provided an API to search among them based on their own language LogQL (a similar approach to the PromQL from Prometheus).
- promtail is the agent component that runs in the edge getting all those log traces that we need that can be running on a machine on-prem or a DaemonSet fashion in our own Kubernetes cluster. It plays the same role as Logstash/Fluent-bit/Fluentd works in the ELK/EFK stack. Promtail provides the usual plugin mode to filter and transforms our log traces as the other solutions provide. At the same time, it provides an interesting feature to convert those log traces into Prometheus metrics that can be scraped directly by your Prometheus server.
- Grafana is the UI for the whole stack and plays a similar role as Kibana in the ELK/EFK stack. Grafana, among other plugins, provides direct integration with Loki as a Datasource to explore those traces and include them in the Dashboards.
Summary
Grafana Loki can be a great solution for your logging architecture to cover address two points: Provide a Lightweight log aggregation solution for your environment and at the same time enable your log traces as a source for your metrics, allowing you to create detailed, more business-oriented metrics that use in your dashboards and your monitoring systems.
📚 Want to dive deeper into Kubernetes? This article is part of our comprehensive Kubernetes Architecture Patterns guide, where you’ll find all fundamental and advanced concepts explained step by step.

