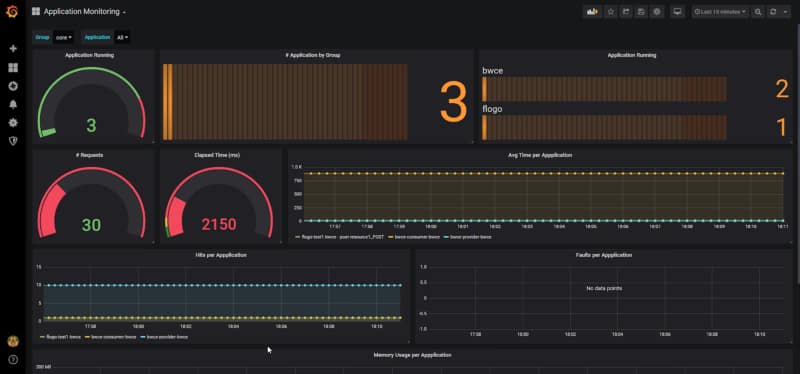
In previous posts, I’ve explained how to integrate TIBCO BusinessWorks 6.x / BusinessWorks Container Edition (BWCE) applications with Prometheus, one of the most popular monitoring systems for cloud layers. Prometheus is one of the most widely used solutions to monitor your microservices inside a Kubernetes cluster. In this post, I will explain steps to leverage Prometheus for integrating with applications running on TIBCO Cloud Integration (TCI).
TCI is TIBCO’s iPaaS and primarily hides the application management complexity of an app from users. You need your packaged application (a.k.a EAR) and manifest.json — both generated by the product to simply deploy the application.
Isn’t it magical? Yes, it is! As explained in my previous post related to Prometheus integration with BWCE, which allows you to customize your base images, TCI allows integration with Prometheus in a slightly different manner. Let’s walk through the steps.
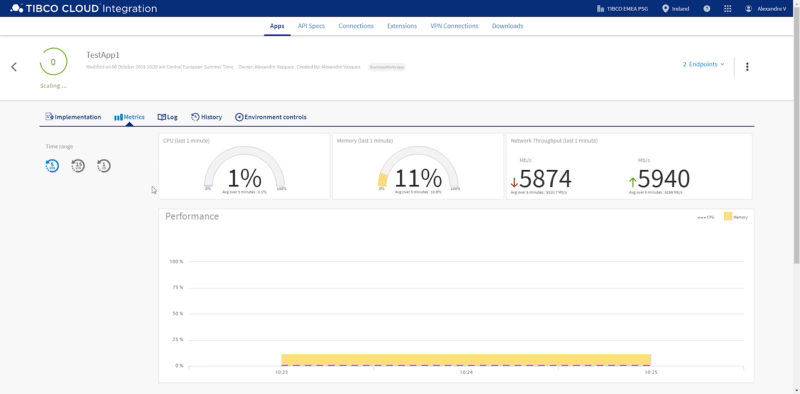
TCI has its own embedded monitoring tools (shown below) to provide insights into Memory and CPU utilization, plus network throughput, which is very useful.
While the monitoring metrics provided out-of-the-box by TCI are sufficient for most scenarios, there are hybrid connectivity use-cases (application running on-prem and microservices running on your own cluster that could be on a private or public cloud) that might require a unified single-pane view of monitoring.
Step one is to import the Prometheus plugin from the current GitHub location into your BusinessStudio workspace. To do that, you just need to clone the GitHub Repository available here: https://github.com/TIBCOSoftware/bw-tooling OR https://github.com/alexandrev/bw-tooling
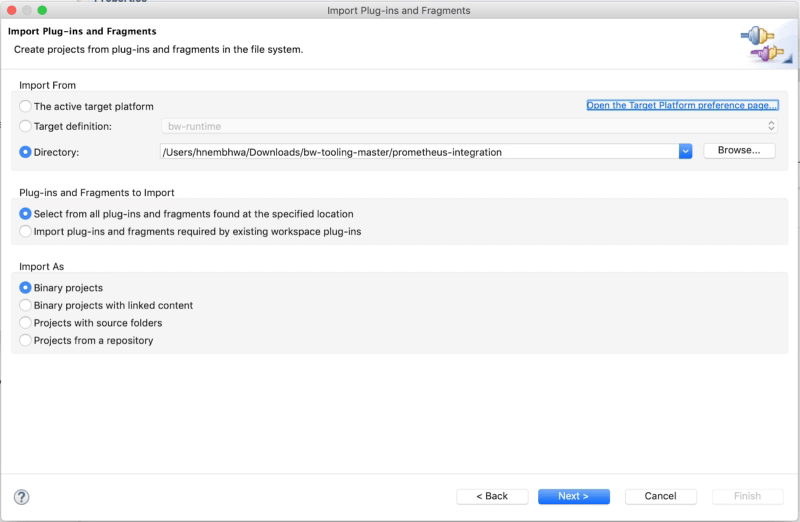
Import the Prometheus plugin by choosing Import → Plug-ins and Fragments option and specifying the directory downloaded from the above mentioned GitHub location. (shown below)
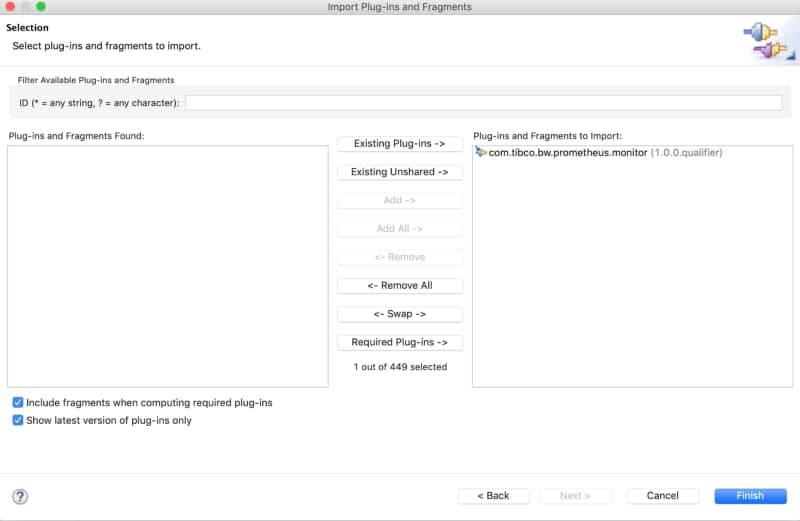
Step two involves adding the Prometheus module previously imported to the specific application as shown below:

Step three is just to build the EAR file along with manifest.json.
NOTE: If the EAR doesn’t get generated once you add the Prometheus plugin, please follow the below steps:
- Export the project with the Prometheus module to a zip file.
- Remove the Prometheus project from the workspace.
- Import the project from the zip file generated before.
Before you deploy the BW application on TCI, we need to enable an additional port on TCI to scrape the Prometheus metrics.
Step four Updating manifest.json file.
By default, a TCI app using the manifest.json file only exposes one port to be consumed from outside (related to functional services) and the other to be used internally for health checks.
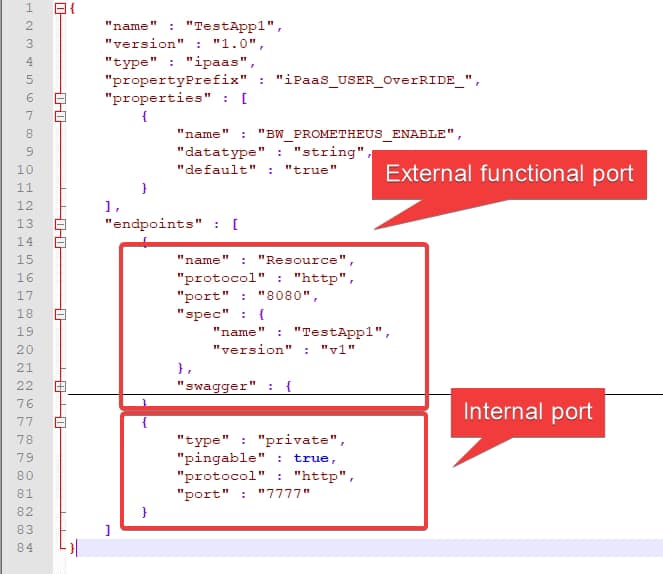
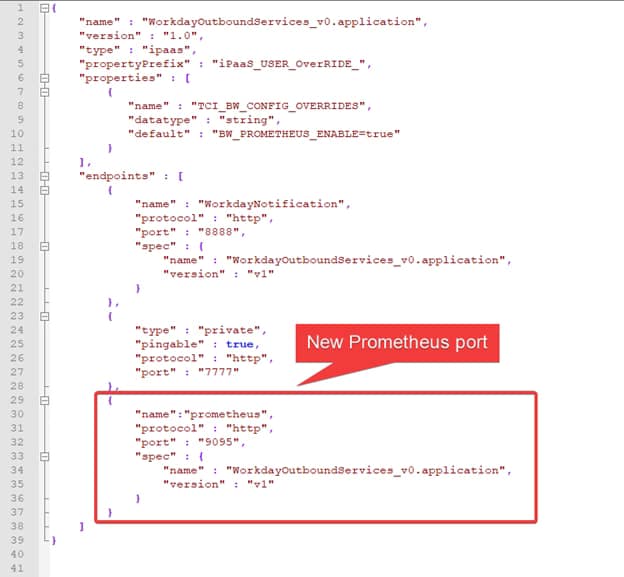
For Prometheus integration with TCI, we need an additional port listening on 9095, so Prometheus server can access the metrics endpoints to scrape the required metrics for our TCI application.
Note: This document does not cover the details on setting the Prometheus server (it is NOT needed for this PoC) but you can find the relevant information on https://prometheus.io/docs/prometheus/latest/installation/
We need to slightly modify the generated manifest.json file (of BW app) to expose an additional port, 9095 (shown below) .
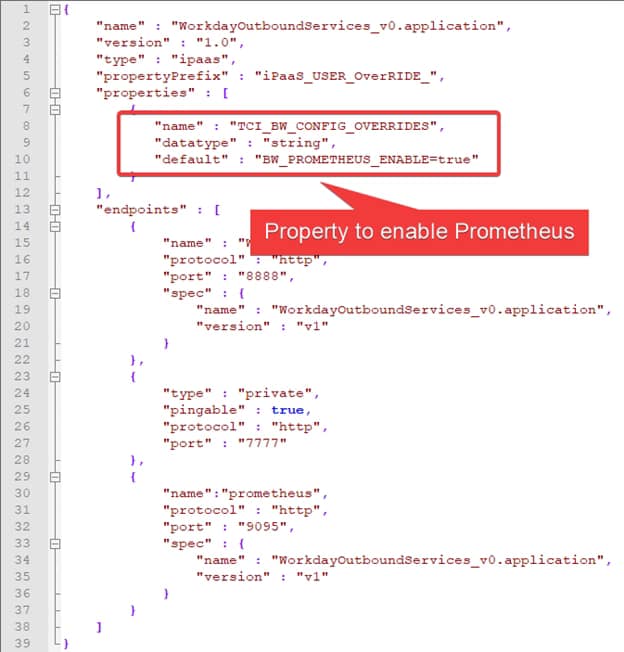
Also, to tell TCI that we want to enable Prometheus endpoint we need to set a property in the manifest.json file. The property is TCI_BW_CONFIG_OVERRIDES and provide the following value: BW_PROMETHEUS_ENABLE=true, as shown below:
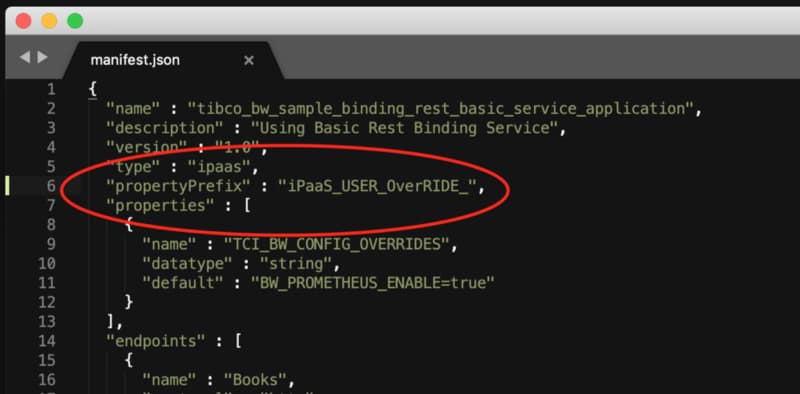
We also need to add an additional line (propertyPrefix) in the manifest.json file as shown below.
Now, we are ready to deploy the BW app on TCI and once it is deployed we can see there are two endpoints

If we expand the Endpoints options on the right (shown above), you can see that one of them is named “prometheus” and that’s our Prometheus metrics endpoint:
Just copy the prometheus URL and append it with /metrics (URL in the below snapshot) — this will display the Prometheus metrics for the specific BW app deployed on TCI.
Note: appending with /metrics is not compulsory, the as-is URL for Prometheus endpoint will also work.
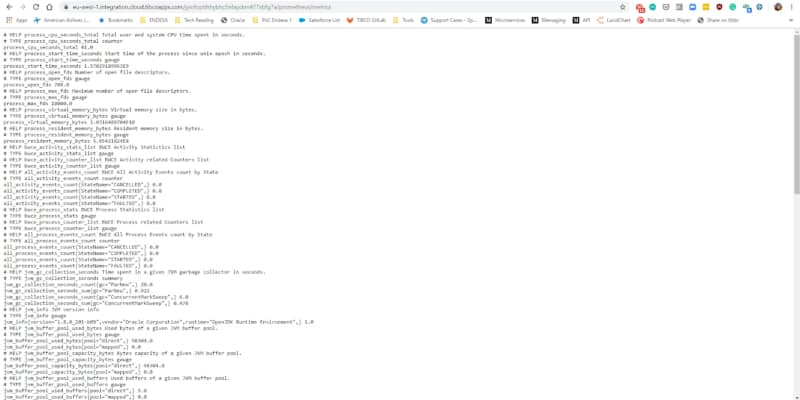
In the list you will find the following kind of metrics to be able to create the most incredible dashboards and analysis based on that kind of information:
- JVM metrics around memory used, GC performance and thread pools counts
- CPU usage by the application
- Process and Activity execution counts by Status (Started, Completed, Failed, Scheduled..)
- Duration by Activity and Process.
With all this available the information you can create dashboards similar to the one shown below, in this case using Spotfire as the Dashboard tool:
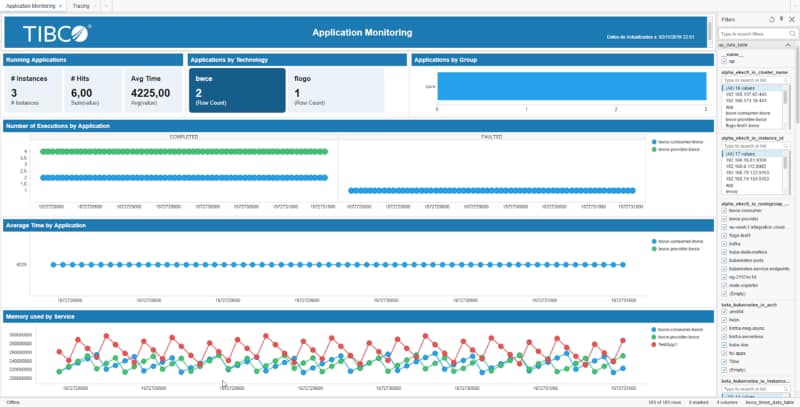
But you can also integrate those metrics with Grafana or any other tool that could read data from Prometheus time-series database.
