Kubernetes Gateway API Versions: Complete Compatibility and Upgrade Guide

Kubernetes Gateway API Versions: Complete Compatibility and Upgrade Guide

The Kubernetes Gateway API has rapidly evolved from its experimental roots to become the standard for ingress and service mesh traffic management. But with multiple versions released and various maturity levels, understanding which version to use, how it relates to your Kubernetes cluster, and when to upgrade can be challenging.

In this comprehensive guide, we’ll explore the different Gateway API versions, their relationship to Kubernetes releases, provider support levels, and the upgrade philosophy that will help you make informed decisions for your infrastructure.

Understanding Gateway API Versioning

The Gateway API follows a unique versioning model that differs from standard Kubernetes APIs. Unlike built-in Kubernetes resources that are tied to specific cluster versions, Gateway API CRDs can be installed independently as long as your cluster meets the minimum requirements.

Minimum Kubernetes Version Requirements

As of Gateway API v1.1 and later versions, you need Kubernetes 1.26 or later to run the latest Gateway API releases. The API commits to supporting a minimum of the most recent 5 Kubernetes minor versions, providing a reasonable window for cluster upgrades.

This rolling support window means that if you’re running Kubernetes 1.26, 1.27, 1.28, 1.29, or 1.30, you can safely install and use the latest Gateway API without concerns about compatibility.

Release Channels: Standard vs Experimental

Gateway API uses two distinct release channels to balance stability with innovation. Understanding these channels is critical for choosing the right version for your use case.

Standard Channel

The Standard channel contains only GA (Generally Available, v1) and Beta (v1beta1) level resources and fields. When you install from the Standard channel, you get:

  • Stability guarantees: No breaking changes once a resource reaches Beta or GA
  • Backwards compatibility: Safe to upgrade between minor versions
  • Production readiness: Extensively tested features with multiple implementations
  • Conformance coverage: Full test coverage ensuring portability

Resources in the Standard channel include GatewayClass, Gateway, HTTPRoute, and ReferenceGrant at the v1 level, plus stable features like GRPCRoute.

Experimental Channel

The Experimental channel includes everything from the Standard channel plus Alpha-level resources and experimental fields. This channel is for:

  • Early feature testing: Try new capabilities before they stabilize
  • Cutting-edge functionality: Access the latest Gateway API innovations
  • No stability guarantees: Breaking changes can occur between releases
  • Feature feedback: Help shape the API by testing experimental features

Features may graduate from Experimental to Standard or be dropped entirely based on implementation experience and community feedback.

Gateway API Version History and Features

Let’s explore the major Gateway API releases and what each introduced.

v1.0 (October 2023)

The v1.0 release marked a significant milestone, graduating core resources to GA status. This release included:

  • Gateway, GatewayClass, and HTTPRoute at v1 (stable)
  • Full backwards compatibility guarantees for v1 resources
  • Production-ready status for ingress traffic management
  • Multiple conformant implementations across vendors

v1.1 (May 2024)

Version 1.1 expanded the API significantly with service mesh support:

  • GRPCRoute: Native support for gRPC traffic routing
  • Service mesh capabilities: East-west traffic management alongside north-south
  • Multiple implementations: Both Istio and other service meshes achieved conformance
  • Enhanced features: Additional matching criteria and routing capabilities

This version bridged the gap between traditional ingress controllers and full service mesh implementations.

v1.2 and v1.3

These intermediate releases introduced structured release cycles and additional features:

  • Refined conformance testing
  • BackendTLSPolicy (experimental in v1.3)
  • Enhanced observability and debugging capabilities
  • Improved cross-namespace routing

v1.4 (October 2025)

The latest GA release as of this writing, v1.4.0 brought:

  • Continued API refinement
  • Additional experimental features for community testing
  • Enhanced conformance profiles
  • Improved documentation and migration guides

Kubernetes Version Compatibility Matrix

Here’s how Gateway API versions relate to Kubernetes releases:

Gateway API Version Minimum Kubernetes Recommended Kubernetes Release Date
v1.0.x 1.25 1.26+ October 2023
v1.1.x 1.26 1.27+ May 2024
v1.2.x 1.26 1.28+ 2024
v1.3.x 1.26 1.29+ 2024
v1.4.x 1.26 1.30+ October 2025

The key takeaway: Gateway API v1.1 and later all support Kubernetes 1.26+, meaning you can run the latest Gateway API on any reasonably modern cluster.

Gateway Provider Support Levels

Different Gateway API implementations support various versions and feature sets. Understanding provider support helps you choose the right implementation for your needs.

Conformance Levels

Gateway API defines three conformance levels for features:

  1. Core: Features that must be supported for an implementation to claim conformance. These are portable across all implementations.
  2. Extended: Standardized optional features. Implementations indicate Extended support separately from Core.
  3. Implementation-specific: Vendor-specific features without conformance requirements.

Major Provider Support

Istio

Istio reached Gateway API GA support in version 1.22 (May 2024). Istio provides:

  • Full Standard channel support (v1 resources)
  • Service mesh (east-west) traffic management via GAMMA
  • Ingress (north-south) traffic control
  • Experimental support for BackendTLSPolicy (Istio 1.26+)

Istio is particularly strong for organizations needing both ingress and service mesh capabilities in a single solution.

Envoy Gateway

Envoy Gateway tracks Gateway API releases closely. Version 1.4.0 includes:

  • Gateway API v1.3.0 support
  • Compatibility matrix for Envoy Proxy versions
  • Focus on ingress use cases
  • Strong experimental feature adoption

Check the Envoy Gateway compatibility matrix to ensure your Envoy Proxy version aligns with your Gateway API and Kubernetes versions.

Cilium

Cilium integrates Gateway API deeply with its CNI implementation:

  • Per-node Envoy proxy architecture
  • Network policy enforcement for Gateway traffic
  • Both ingress and service mesh support
  • eBPF-based packet processing

Cilium’s unique architecture makes it a strong choice for organizations already using Cilium for networking.

Contour

Contour v1.31.0 implements Gateway API v1.2.1, supporting:

  • All Standard channel v1 resources
  • Most v1alpha2 resources (TLSRoute, TCPRoute, GRPCRoute)
  • BackendTLSPolicy support

Checking Provider Conformance

To verify which Gateway API version and features your provider supports:

  1. Visit the official implementations page: The Gateway API project maintains a comprehensive list of implementations with their conformance levels.
  2. Check provider documentation: Most providers publish compatibility matrices showing Gateway API, Kubernetes, and proxy version relationships.
  3. Review conformance reports: Providers submit conformance test results that detail exactly which Core and Extended features they support.
  4. Test in non-production: Before upgrading production, validate your specific use cases in a staging environment.

Upgrade Philosophy: When and How to Upgrade

One of the most common questions about Gateway API is: “Do I need to run the latest version?” The answer depends on your specific needs and risk tolerance.

Staying on Older Versions

You don’t need to always run the latest Gateway API version. It’s perfectly acceptable to:

  • Stay on an older stable release if it meets your needs
  • Upgrade only when you need specific new features
  • Wait for your Gateway provider to officially support newer versions
  • Maintain stability over having the latest features

The Standard channel’s backwards compatibility guarantees mean that when you do upgrade, your existing configurations will continue to work.

When to Consider Upgrading

Consider upgrading when:

  1. You need a specific feature: A new HTTPRoute matcher, GRPCRoute support, or other functionality only available in newer versions
  2. Your provider recommends it: Gateway providers often optimize for specific Gateway API versions
  3. Security considerations: While rare, security issues could prompt upgrades
  4. Kubernetes cluster upgrades: When upgrading Kubernetes, verify your Gateway API version is compatible with the new cluster version

Safe Upgrade Practices

Follow these best practices for Gateway API upgrades:

1. Stick with Standard Channel

Using Standard channel CRDs makes upgrades simpler and safer. Experimental features can introduce breaking changes, while Standard features maintain compatibility.

2. Upgrade One Minor Version at a Time

While it’s usually safe to skip versions, the most tested upgrade path is incremental. Going from v1.2 to v1.3 to v1.4 is safer than jumping directly from v1.2 to v1.4.

3. Test Before Upgrading

Always test upgrades in non-production environments:

# Install specific Gateway API version in test cluster
kubectl apply -f https://github.com/kubernetes-sigs/gateway-api/releases/download/v1.4.0/standard-install.yaml

4. Review Release Notes

Each Gateway API release publishes comprehensive release notes detailing:

  • New features and capabilities
  • Graduation of experimental features to standard
  • Deprecation notices
  • Upgrade considerations

5. Check Provider Compatibility

Before upgrading Gateway API CRDs, verify your Gateway provider supports the target version. Installing Gateway API v1.4 won’t help if your controller only supports v1.2.

6. Never Overwrite Different Channels

Implementations should never overwrite Gateway API CRDs that use a different release channel. Keep track of whether you’re using Standard or Experimental channel installations.

CRD Management Best Practices

Gateway API CRD management requires attention to detail:

# Check currently installed Gateway API version
kubectl get crd gateways.gateway.networking.k8s.io -o yaml | grep 'gateway.networking.k8s.io/bundle-version'

# Verify which channel is installed
kubectl get crd gateways.gateway.networking.k8s.io -o yaml | grep 'gateway.networking.k8s.io/channel'

Staying Informed About New Releases

Gateway API releases follow a structured release cycle with clear communication channels.

How to Know When New Versions Are Released

  1. GitHub Releases Page: Watch the kubernetes-sigs/gateway-api repository for release announcements
  2. Kubernetes Blog: Major Gateway API releases are announced on the official Kubernetes blog
  3. Mailing Lists and Slack: Join the Gateway API community channels for discussions and announcements
  4. Provider Announcements: Gateway providers announce support for new Gateway API versions through their own channels

Release Cadence

Gateway API follows a quarterly release schedule for minor versions, with patch releases as needed for bug fixes and security issues. This predictable cadence helps teams plan upgrades.

Practical Decision Framework

Here’s a framework to help you decide which Gateway API version to run:

For New Deployments

  • Production workloads: Use the latest GA version supported by your provider
  • Innovation-focused: Consider Experimental channel if you need cutting-edge features
  • Conservative approach: Use v1.1 or later with Standard channel

For Existing Deployments

  • If things are working: Stay on your current version until you need new features
  • If provider recommends upgrade: Follow provider guidance, especially for security
  • If Kubernetes upgrade planned: Verify compatibility, may need to upgrade Gateway API first or simultaneously

Feature-Driven Upgrades

  • Need service mesh support: Upgrade to v1.1 minimum
  • Need GRPCRoute: Upgrade to v1.1 minimum
  • Need BackendTLSPolicy: Requires v1.3+ and provider support for experimental features

Conclusion

Kubernetes Gateway API represents the future of traffic management in Kubernetes, offering a standardized, extensible, and role-oriented API for both ingress and service mesh use cases. Understanding the versioning model, compatibility requirements, and upgrade philosophy empowers you to make informed decisions that balance innovation with stability.

Key takeaways:

  • Gateway API versions install independently from Kubernetes, requiring only version 1.26 or later for recent releases
  • Standard channel provides stability, Experimental channel provides early access to new features
  • You don’t need to always run the latest version—upgrade when you need specific features
  • Verify provider support before upgrading Gateway API CRDs
  • Follow safe upgrade practices: test first, upgrade incrementally, review release notes

By following these guidelines, you can confidently deploy and maintain Gateway API in your Kubernetes infrastructure while making upgrade decisions that align with your organization’s needs and risk tolerance.

Frequently Asked Questions

What is the difference between Kubernetes Ingress and the Gateway API?

Kubernetes Ingress is a legacy API focused mainly on HTTP(S) traffic with limited extensibility. The Gateway API is its successor, offering a more expressive, role-oriented model that supports multiple protocols, advanced routing, better separation of concerns, and consistent behavior across implementations

Which Gateway API version should I use in production today?

For most production environments, you should use the latest GA (v1.x) release supported by your Gateway provider, installed from the Standard channel. This ensures stability, backwards compatibility, and conformance guarantees while still benefiting from ongoing improvements.

Can I upgrade the Gateway API without upgrading my Kubernetes cluster?

Yes. Gateway API CRDs are installed independently of Kubernetes itself. As long as your cluster meets the minimum supported Kubernetes version (1.26+ for recent releases), you can upgrade the Gateway API without upgrading the cluster.

What happens if my Gateway provider does not support the latest Gateway API version?

If your provider lags behind, you should stay on the latest version officially supported by that provider. Installing newer Gateway API CRDs than your controller supports can lead to missing features or undefined behavior. Provider compatibility should always take precedence over running the newest API version.

Is it safe to upgrade Gateway API CRDs without downtime?

In most cases, yes—when using the Standard channel. The Gateway API provides strong backwards compatibility guarantees for GA and Beta resources. However, you should always test upgrades in a non-production environment and verify that your Gateway provider supports the target version.

Sources

FreeLens vs OpenLens vs Lens: Choosing the Right Kubernetes IDE

FreeLens vs OpenLens vs Lens: Choosing the Right Kubernetes IDE

Introduction: When a Tool Choice Becomes a Legal and Platform Decision

If you’ve been operating Kubernetes clusters for a while, you’ve probably learned this the hard way:
tooling decisions don’t stay “just tooling” for long.

What starts as a developer convenience can quickly turn into:

  • a licensing discussion with Legal,
  • a procurement problem,
  • or a platform standard you’re stuck with for years.

The Kubernetes IDE ecosystem is a textbook example of this.

Many teams adopted Lens because it genuinely improved day-to-day operations. Then the license changed and we already cover the OpenLens vs Lens in the past. Then restrictions appeared. Then forks started to emerge.

Today, the real question is not “Which one looks nicer?” but:

  • Which one is actually maintained?
  • Which one is safe to use in a company?
  • Why is there a fork of a fork?
  • Are they still technically compatible?
  • What is the real switch cost?

Let’s go through this from a production and platform engineering perspective.

The Forking Story: How We Ended Up Here

Understanding the lineage matters because it explains why FreeLens exists at all.

Lens: The Original Product

Lens started as an open-core Kubernetes IDE with a strong community following. Over time, it evolved into a commercial product with:

  • a proprietary license,
  • paid enterprise features,
  • and restrictions on free usage in corporate environments.

This shift was legitimate from a business perspective, but it broke the implicit contract many teams assumed when they standardized on it.

OpenLens: The First Fork

OpenLens was created to preserve:

  • open-source licensing,
  • unrestricted commercial usage,
  • compatibility with Lens extensions.

For a while, OpenLens was the obvious alternative for teams that wanted to stay open-source without losing functionality.

FreeLens: The Fork of the Fork

FreeLens appeared later, and this is where many people raise an eyebrow.

Why fork OpenLens?

Because OpenLens development started to slow down:

  • release cadence became irregular,
  • upstream Kubernetes changes lagged,
  • governance and long-term stewardship became unclear.

FreeLens exists because some contributors were not willing to bet their daily production tooling on a project with uncertain momentum.

This was not ideology. It was operational risk management.

Are the Projects Still Maintained?

Short answer: yes, but not equally.

Lens

  • Actively developed
  • Backed by a commercial vendor
  • Fast adoption of new Kubernetes features

Trade-off:

  • Licensing constraints
  • Paid features
  • Requires legal review in most companies

OpenLens

  • Still maintained
  • Smaller contributor base
  • Slower release velocity

It works, but it no longer feels like a safe long-term default for platform teams.

FreeLens

  • Actively maintained
  • Explicit focus on long-term openness
  • Prioritizes Kubernetes API compatibility and stability

Right now, FreeLens shows the healthiest balance between maintenance and independence.

Technical Compatibility: Can You Switch Without Pain?

This is the good news: yes, mostly.

Cluster Access and Configuration

All three tools:

  • use standard kubeconfig files,
  • support multiple contexts and clusters,
  • work with RBAC, CRDs, and namespaces the same way.

No cluster-side changes are required.

Extensions and Plugins

  • Most Lens extensions work in OpenLens.
  • Most OpenLens extensions work in FreeLens.
  • Proprietary Lens-only extensions are the main exception.

In real-world usage:

  • ~90% of common workflows are identical
  • differences show up only in edge cases or paid features

UX Differences

There are some UI differences:

  • branding,
  • menu structure,
  • feature gating in Lens.

Nothing that requires retraining or documentation updates.

Legal and Licensing Considerations (This Is Where It Usually Breaks)

This is often the decisive factor in enterprise environments.

Lens

  • Requires license compliance checks
  • Free usage may violate internal policies
  • Paid plans required for broader adoption

If you operate in a regulated or audited environment, this alone can be a blocker.

OpenLens

  • Open-source license
  • Generally safe for corporate use
  • Slight uncertainty due to reduced activity

FreeLens

  • Explicitly open-source
  • No usage restrictions
  • Clear intent to remain free for commercial use

If Legal asks, “Can we standardize this across the company?”
FreeLens is the easiest answer.

Which One Should You Use in a Company?

A pragmatic recommendation:

Use Lens if:

  • you want vendor-backed support,
  • you are willing to pay,
  • you already standardized on Mirantis tooling.

Use OpenLens if:

  • you are already using it,
  • it meets your needs today,
  • you accept slower updates.

Use FreeLens if:

  • you want zero licensing risk,
  • you want an open-source default,
  • you care about long-term maintenance,
  • you need something you can standardize safely.

For most platform and DevOps teams, FreeLens is currently the lowest-risk choice.

Switch Cost: How Expensive Is It Really?

Surprisingly low.

Typical migration:

  • install the new binary,
  • reuse existing kubeconfigs,
  • reinstall extensions if needed.

What you don’t need:

  • cluster changes,
  • CI/CD modifications,
  • platform refactoring.

Downtime: none
Rollback: trivial

This is one of the rare cases where switching early is cheap.

Is a “Fork of a Fork” a Red Flag?

Normally, yes.

In this case, no.

FreeLens exists because:

  • maintenance mattered more than branding,
  • openness mattered more than monetization,
  • predictability mattered more than roadmap promises.

Ironically, this is very aligned with how Kubernetes itself evolved.

Conclusion: A Clear, Boring, Production-Safe Answer

If you strip away GitHub drama and branding:

  • Lens optimizes for revenue and enterprise features.
  • OpenLens preserved openness but lost momentum.
  • FreeLens optimizes for sustainability and freedom.

From a platform engineering perspective:

FreeLens is the safest default Kubernetes IDE today for most organizations.

Low switch cost, strong compatibility, no legal surprises.

And in production environments, boring and predictable almost always wins.

SoapUI Maven Integration: Automate API Testing with Maven Builds

SoapUI Maven Integration: Automate API Testing with Maven Builds

SoapUI is a popular open-source tool used for testing SOAP and REST APIs. It comes with a user-friendly interface and a variety of features to help you test API requests and responses. In this article, we will explore how to use SoapUI integrated with Maven for automation testing.

Why Use SoapUI with Maven?

Maven is a popular build automation tool that simplifies building and managing Java projects. It is widely used in the industry, and it has many features that make it an ideal choice for automation testing with SoapUI.

By integrating SoapUI with Maven, you can easily run your SoapUI tests as part of your Maven build process. This will help you to automate your testing process, reduce the time required to test your APIs, and ensure that your tests are always up-to-date.

Setting Up SoapUI and Maven

Before we can start using SoapUI with Maven, we must set up both tools on our system. First, download and install SoapUI from the official website. Once SoapUI is installed, we can proceed with installing Maven.

To install Maven, follow these steps:

  1. Download the latest version of Maven from the official website.
  2. Extract the downloaded file to a directory on your system.
  3. Add the bin directory of the extracted folder to your system’s PATH environment variable.
  4. Verify that Maven is installed by opening a terminal or command prompt and running the command mvn -version.

Creating a Maven Project for SoapUI Tests

Now that we have both SoapUI and Maven installed, we can create a Maven project for our SoapUI tests. To create a new Maven project, follow these steps:

  1. Open a terminal or command prompt and navigate to the directory where you want to create your project.
  2. Run the following command: mvn archetype:generate -DgroupId=com.example -DartifactId=my-soapui-project -DarchetypeArtifactId=maven-archetype-quickstart -DinteractiveMode=false
  3. This will create a new Maven project with the group ID com.example and the artifact ID my-soapui-project.

Adding SoapUI Tests to the Maven Project

Now that we have a Maven project, we can add our SoapUI tests to the project. To do this, follow these steps:

  1. Create a new SoapUI project by opening SoapUI and selecting File > New SOAP Project.
  2. Follow the prompts to create a new project, including specifying the WSDL file and endpoint for your API.
  3. Once your project is created, create a new test suite and add your test cases.
  4. Save your SoapUI project.

Next, we need to add our SoapUI project to our Maven project. To do this, follow these steps:

  1. In your Maven project directory, create a new directory called src/test/resources.
  2. Copy your SoapUI project file (.xml) to this directory.
  3. In the pom.xml file of your Maven project, add the following code:
<build>
  <plugins>
    <plugin>
      <groupId>com.smartbear.soapui</groupId>
      <artifactId>soapui-maven-plugin</artifactId>
      <version>5.6.0</version>
      <configuration>
        <projectFile>1/src/test/resources/my-soapui-project.xml</projectFile>
        <outputFolder>1/target/surefire-reports</outputFolder>
        <junitReport>true</junitReport>
        <exportwAll>true</exportwAll>
      </configuration>
      <executions>
        <execution>
          <phase>test</phase>
          <goals>
            <goal>test</goal>
          </goals>
        </execution>
      </executions>
    </plugin>
  </plugins>
</build>

This code configures the SoapUI Maven plugin to run our SoapUI tests during the test phase of the Maven build process.

Creating Assertions in SoapUI Projects

Now that we have our SoapUI tests added to our Maven project, we can create assertions to validate the responses of our API calls. To create assertions in SoapUI, follow these steps:

  1. Open your SoapUI project and navigate to the test case where you want to create an assertion.
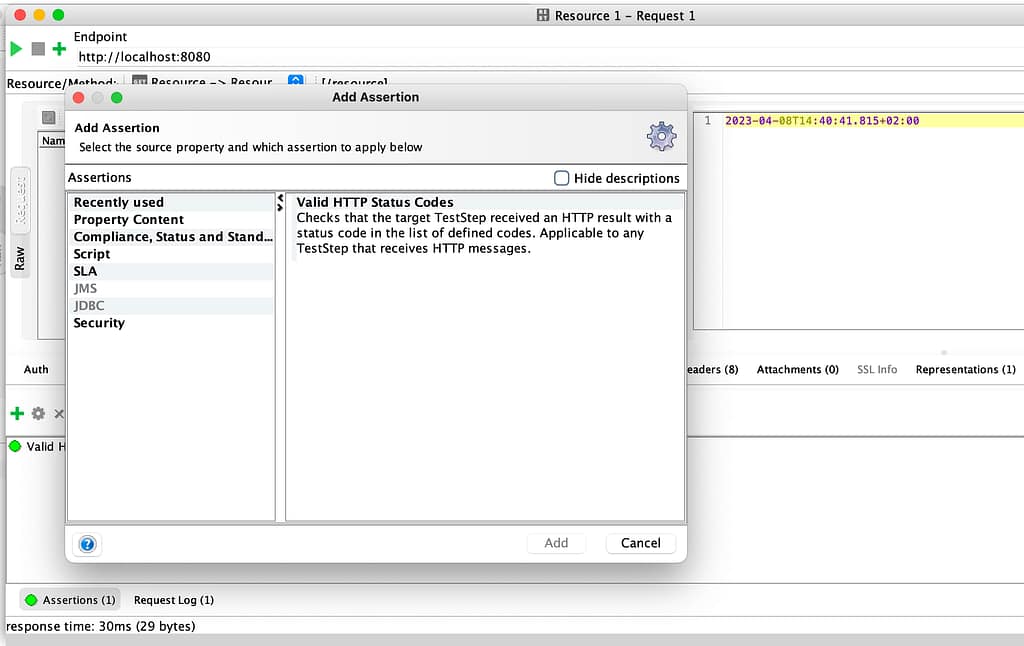
  2. Right-click on the step that you want to validate and select Add Assertion.
  3. Choose the type of assertion that you want to create (e.g. Contains, XPath Match, Valid HTTP Status Codes, etc.).
  4. Configure the assertion according to your needs.
  5. Save your SoapUI project.
SoapUI Maven Integration: Automate API Testing with Maven Builds

Running SoapUI Tests with Assertions Using Maven

Now that we have our SoapUI tests and assertions added to our Maven project, we can run them using Maven. To run your SoapUI tests with Maven and validate the responses using assertions, follow these steps:

  1. Open a terminal or command prompt and navigate to your Maven project directory.
  2. Run the following command: mvn clean test
  3. This will run your SoapUI tests and generate a report in the target/surefire-reports directory of your Maven project.

During the test execution, if any assertion fails, the test will fail and an error message will be displayed in the console. By creating assertions, we can ensure that our API calls are returning the expected responses.

Conclusion

In this article, we have learned how to use SoapUI integrated with Maven for automation testing, including how to create assertions in SoapUI projects. By using these two tools together, we can automate our testing process, reduce the time required to test our APIs, and ensure that our tests are always up-to-date. If you are looking to get started with automation testing using SoapUI and Maven, give this tutorial a try!

Kubernetes Autoscaling 1.26 Explained: HPA v2 Changes and Impact on KEDA

Kubernetes Autoscaling 1.26 Explained: HPA v2 Changes and Impact on KEDA

Introduction

Kubernetes Autoscaling has suffered a dramatic change. Since the Kubernetes 1.26 release, all components should migrate their HorizontalPodAutoscaler objects from the v1 to the new release v2that has been available since Kubernetes 1.23.

HorizontalPodAutoscaler is a crucial component in any workload deployed on a Kubernetes cluster, as the scalability of this solution is one of the great benefits and key features of this kind of environment.

A little bit of History

Kubernetes has introduced a solution for the autoscaling capability since the version Kubernetes 1.3 a long time ago, in 2016. And the solution was based on a control loop that runs at a specific interval that you can configure with the property --horizontal-pod-autoscaler-sync-period parameters that belong to the kube-controller-manager.

So, once during this period, it will get the metrics and evaluate through the condition defined on the HorizontalPodAutoscaler component. Initially, it was based on the compute resources used by the pod, main memory, and CPU.

Kubernetes Autoscaling 1.26: A Game-Changer for KEDA Users?

This provided an excellent feature, but with the past of time and adoption of the Kubernetes environment, it has been shown as a little narrow to handle all the scenarios that we should have, and here is where other awesome projects we have discussed here, such as KEDA brings into the picture to provide a much more flexible set of features.

Kubernetes AutoScaling Capabilities Introduced v2

With the release of the v2 of the Autoscaling API objects, we have included a range of capabilities to upgrade the flexibility and options available now. There most relevant ones are the following:

  • Scaling on custom metrics: With the new release, you can configure an HorizontalPodAutoscaler object to scale using custom metrics. When we talk about custom metrics, we talk about any metric generated from Kubernetes. You can see a detailed walkthrough about using Custom metrics in the official documentation
  • Scaling on multiple metrics: With the new release, you also have the option to scale based on more than one metric. So now the HorizontalPodAutoscalerwill evaluate each scaling rule condition, propose a new scale value for each of them, and take the maximum value as the final one.
  • Support for Metrics API: With the new release, the controller from the HoriztalPodAutoscaler components retrieves metrics from a series of registered APIs, such as metrics.k8s.io, custom.metrics.k8s.io ,external.metrics.k8s.io. For more information on the different metrics available, you can take a look at the design proposal
  • Configurable Scaling Behavior: With the new release, you have a new field, behavior, that allows configuring how the component will behave in terms of scaling up or scaling down activity. So, you can define different policies for the scaling up and others for the scaling down, limit the max number of replicas that can be added or removed in a specific period, to handle the issues with the spikes of some components as Java workloads, among others. Also, you can define a stabilization window to avoid stress when the metric is still fluctuating.

Kubernetes Autoscaling v2 vs KEDA

We have seen all the new benefits that Autoscaling v2 provides, so I’m sure that most of you are asking the same question: Is Kubernetes Autoscaling v2 killing KEDA?

Since the latest releases of KEDA, KEDA already includes the new objects under the autoscaling/v2 group as part of their development, as KEDA relies on the native objects from Kubernetes, and simplify part of the process you need to do when you want to use custom metric or external ones as they have scalers available for pretty much everything you could need now or even in the future.

But, even with that, there are still features that KEDA provides that are not covered here, such as the scaling “from zero” and “to zero” capabilities that are very relevant for specific kinds of workloads and to get a very optimized use of resources. Still, it’s safe to say that with the new features included in the autoscaling/v2 release, the gap is now smaller. Depending on your needs, you can go with the out-of-the-box capabilities without including a new component in your architecture.

📚 Want to dive deeper into Kubernetes? This article is part of our comprehensive Kubernetes Architecture Patterns guide, where you’ll find all fundamental and advanced concepts explained step by step.

Grafana Alerting vs Prometheus Alertmanager: Key Differences and When to Use Each

Grafana Alerting vs Prometheus Alertmanager: Key Differences and When to Use Each

Introduction

Grafana Alerting capabilities continue to improve in each new release the GrafanaLabs team does. Especially with the changes done in Grafana 8 and Grafana 9, many questions have been raised regarding its usage, the capabilities supported, and the comparison with other alternatives.

We want to start setting the context about Grafana Alerting based on the usual stack we deployed to improve the observability of our workloads. Grafana can be used for any workload; there is a preference for some specific ones being the most used solution when we talk about Kubernetes workloads.

In this kind of deployment, the stack we usually deploy is Grafana as the visualization tool and Prometheus as the core to gather all metrics, so all responsibilities are differentiated. Grafana draws all the information using its excellent dashboarding capabilities, gathering the information from Prometheus.

Grafana Alerting vs AlertManager: A Comparison of Two Leading Monitoring Tools

When we plan to start including alerts, as we cannot accept that we need to have a specific team just watching dashboards to detect where something is going wrong, we need to implement a way to push alerts.

Alerting capabilities in Grafana have been present since the beginning, but its capabilities in the early stages have been limited to generating graphical alerts focused on the dashboards. Instead of that, Prometheus acting as the brain, includes a side-card component called AlertManager that can handle the creation and notification of any alerts generated from all the information stored in Prometheus.

As main capabilities that Alert Manager provides are the definition of the alerts, a grouping of the alerts, dismiss rules to mute some notifications, and finally, the way to send that alert to any system based on a plugin system and a webhook to be able to extend it to any component available.

Grafana Alerting vs AlertManager: A Comparison of Two Leading Monitoring Tools

So, this is the initial stage, but this has been changed with the latest releases of Grafana in the last months, as commented, and now the barrier between both components is much fuzzier, as we’re going to see.

What are the main capabilities Grafana Alerting provides today?

Grafana Alerting allows you to define Alert rules defining the criteria under which this alert should fire. It can have different queries, conditions, evaluation frequency, and the duration over which the condition is met.

This alert can be generated from any of the sources supported in Grafana, and that’s a very relevant topic as this is not limited to the Prometheus data. With the eclosion of the GrafanaLabs stack with many new products such as Grafana Loki and Grafana Mimir, among others, this is especially relevant.

Once each of the alerts once it fires, you can define a Notification policy to decide where, when, and how each of these alerts is routed to. A notification policy also has a contact point associated with one or more notifiers.

Additionally, you can silence alerts to stop receiving notifications of a specific alert instance and mute alerts when you can define some period where new alerts will not be generated or notified.

All of that with powerful dashboarding capabilities using all the power of the Grafana dashboard features.

Grafana Alerting vs AlertManager: A Comparison of Two Leading Monitoring Tools

 Grafana Alerting vs Prometheus Alert Manager

After reading the previous section probably, you are confused because most of the new features added are very similar to the ones we have available on Prometheus AlertManager.

So, in that case, what tool should we use? Should we replace Prometheus AlertManager and start using Grafana Alerting? Should we use both? As you can imagine, this is one of these questions that doesn’t have clear answers as it will depend a lot on the context and your specific scenario, but let me give you some pointers around it.

  • Grafana Alerting can be very powerful if you are already inside the Grafana stack. If you are already using Grafana Loki (and require to generate alerts from it), Grafana Mimir, or directly Grafana cloud, probably Grafana Alert would provide a better fit for your ecosystem.
  • If you require complex alerts defined with complex queries and calculations, Prometheus AlertManager will provide a much more complex and rich ecosystem to generate your alerts.
  • If you are looking for a SaaS approach, Grafana Alerting is also provided as part of Grafana Cloud, so it can be used without the requirement to be installed in your ecosystem.
  • If you are using Grafana Alerting, you need to consider that the same component serving the dashboards is computing and generating the alerts, which would require additional HA capabilities. It will be a non-evitable relationship between both features (dashboards and alerts). Suppose that doesn’t resonate well with you because the criticality of your dashboard is not the same as the alerts, or you think your dashboard’s usage can affect the alerts’ performance. In that case, Prometheus Alert Manager will provide a better approach as it runs in a specific pod in isolation.
  • At this moment, Grafana Alerting uses a SQL Database to manage duplication among other features, so depending on the number of alerts you need to work on could not be enough in terms of performance, and the usage of the time series database from Prometheus can be a better fit.

Summary

Grafana Alerting is incredible progress on the journey of the Grafana Labs team to provide an end-to-end observability stack with a great fit on the rest of the ecosystem with the option to run it in SaaS mode and focus on ease of use. But there are better options than depending on your needs.

📚 Want to dive deeper into Kubernetes? This article is part of our comprehensive Kubernetes Architecture Patterns guide, where you’ll find all fundamental and advanced concepts explained step by step.

Mastering Istio ServiceEntry: Connect Your Service Mesh to APIs

Mastering Istio ServiceEntry: Connect Your Service Mesh to APIs

What Is An Istio ServiceEntry?

Istio ServiceEntry is the way to define an endpoint that doesn’t belong to the Istio Service Registry. Once the ServiceEntry is part of the registry, it can define rules and enforce policies as if they belong to the mesh.

Istio Service Entry answers the question you probably have done several times when using a Service Mesh. How can I do the same magic with external endpoints that I can do when everything is under my service mesh scope? And Istio Service Entry objects provide precisely that:

A way to have an extended mesh managing another kind of workload or, even better, in Istio’s own words:

ServiceEntry enables adding additional entries into Istio’s internal service registry so that auto-discovered services in the mesh can access/route to these manually specified services.

These services could be external to the mesh (e.g., web APIs) or mesh-internal services that are not part of the platform’s service registry (e.g., a set of VMs talking to services in Kubernetes).

What are the main capabilities of Istio ServiceEntry?

Here you can see a sample of the YAML definition of a Service Entry:

apiVersion: networking.istio.io/v1beta1
kind: ServiceEntry
metadata:
  name: external-svc-redirect
spec:
  hosts:
  - wikipedia.org
  - "*.wikipedia.org"
  location: MESH_EXTERNAL
  ports:
  - number: 443
    name: https
    protocol: TLS
  resolution: NONE

In this case, we have an external-svc-redirectServiceEntry object that is handling all calls going to the wikipedia.org, and we define the port and protocol to be used (TLS – 443) and classify this service as external to the mesh (MESH_EXTERNAL) as this is an external Web page.

You can also specify more details inside the ServiceEntry configuration, so you can, for example, define a hostname or IP and translate that to a different hostname and port because you can also specify the resolution mode you want to use for this specific Service Entry. If you see the snippet above, you will find a resolution field with NONE value that says it will not make any particular resolution. But other values valid are the following ones:

  • NONE: Assume that incoming connections have already been resolved (to a specific destination IP address).
  • STATIC: Use the static IP addresses specified in endpoints as the backing instances associated with the service.
  • DNS: Attempt to resolve the IP address by querying the ambient DNS asynchronously.
  • DNSROUNDROBIN: Attempt to resolve the IP address by querying the ambient DNS asynchronously. Unlike DNS, DNSROUNDROBIN only uses the first IP address returned when a new connection needs to be initiated without relying on complete results of DNS resolution, and references made to hosts will be retained even if DNS records change frequently eliminating draining connection pools and connection cycling.

To define the target of the ServiceEntry, you need to specify its endpoints by using a WorkloadEntry object. To do that, you need to provide the following data:

  • address: Address associated with the network endpoint without the port.
  • ports: Set of ports associated with the endpoint
  • weight: The load balancing weight associated with the endpoint.
  • locality: The locality associated with the endpoint. A locality corresponds to a failure domain (e.g., country/region/zone).
  • network: Network enables Istio to group endpoints resident in the same L3 domain/network.

What Can You Do With Istio ServiceEntry?

The number of use cases is enormous. Once a ServiceEntry is similar to what you have a Virtual Service defined, you can apply any destination rule to them to do a load balancer, a protocol switch, or any logic that can be done with the DestinationRule object. The same applies to the rest of the Istio CRD, such as RequestAuthentication, and PeerAuthorization, among others.

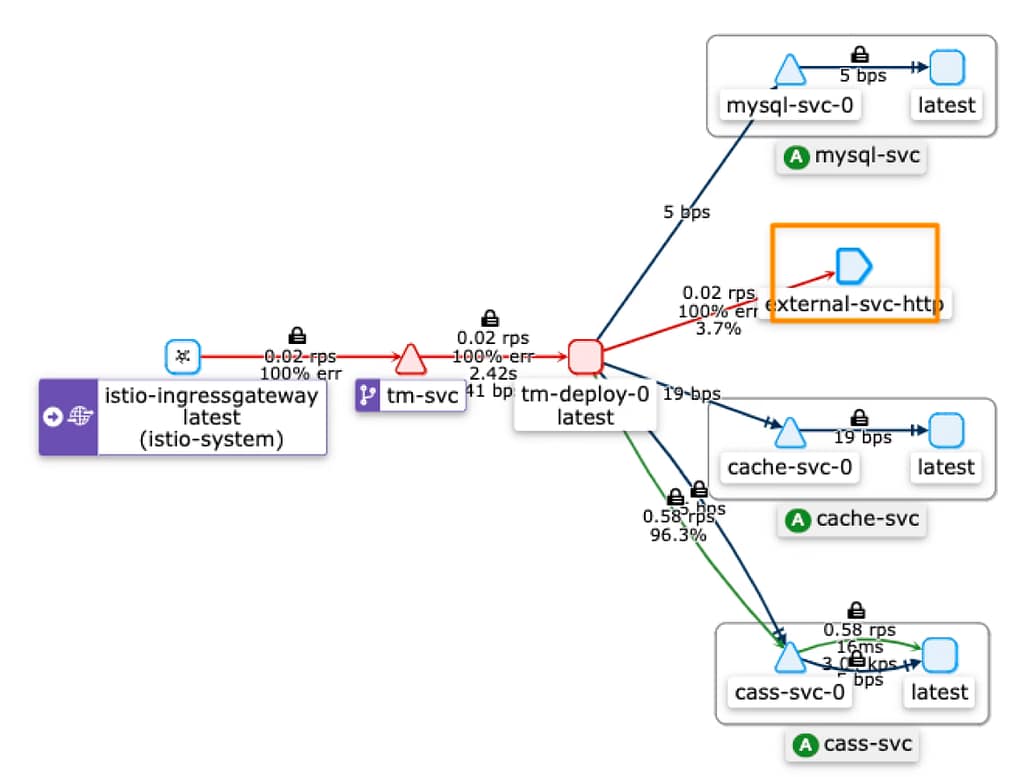
You can also have a graphical representation of the ServiceEntry inside Kiali, a visual representation for the Istio Service Mesh, as you can see in the picture below:

Understanding Istio ServiceEntry: How to Extend Your Service Mesh to External Endpoints

As you can define, an extended mesh with endpoints outside the Kubernetes cluster is something that is becoming more usual with the explosion of clusters available and the hybrid environments when you need to manage clusters of different topologies and not lose the centralized policy-based network management that the Istio Service Mesh provides to your platform.

Secure Your Services with Istio: A Step-by-Step Guide to Setting up Istio TLS Connections

Secure Your Services with Istio: A Step-by-Step Guide to Setting up Istio TLS Connections

Introduction

Istio TLS configuration is one of the essential features when we enable a Service Mesh. Istio Service Mesh provides so many features to define in a centralized, policy way how transport security, among other characteristics, is handled in the different workloads you have deployed on your Kubernetes cluster.

One of the main advantages of this approach is that you can have your application focus on the business logic they need to implement. These security aspects can be externalized and centralized without necessarily including an additional effort in each application you have deployed. This is especially relevant if you are following a polyglot approach (as you should) across your Kubernetes cluster workloads.

So, this time we’re going to have our applications just handling HTTP traffic for both internal and external, and depending on where we are reaching, we will force that connection to be TLS without the workload needed to be aware of it. So, let’s see how we can enable this Istio TLS configuration

Scenario View

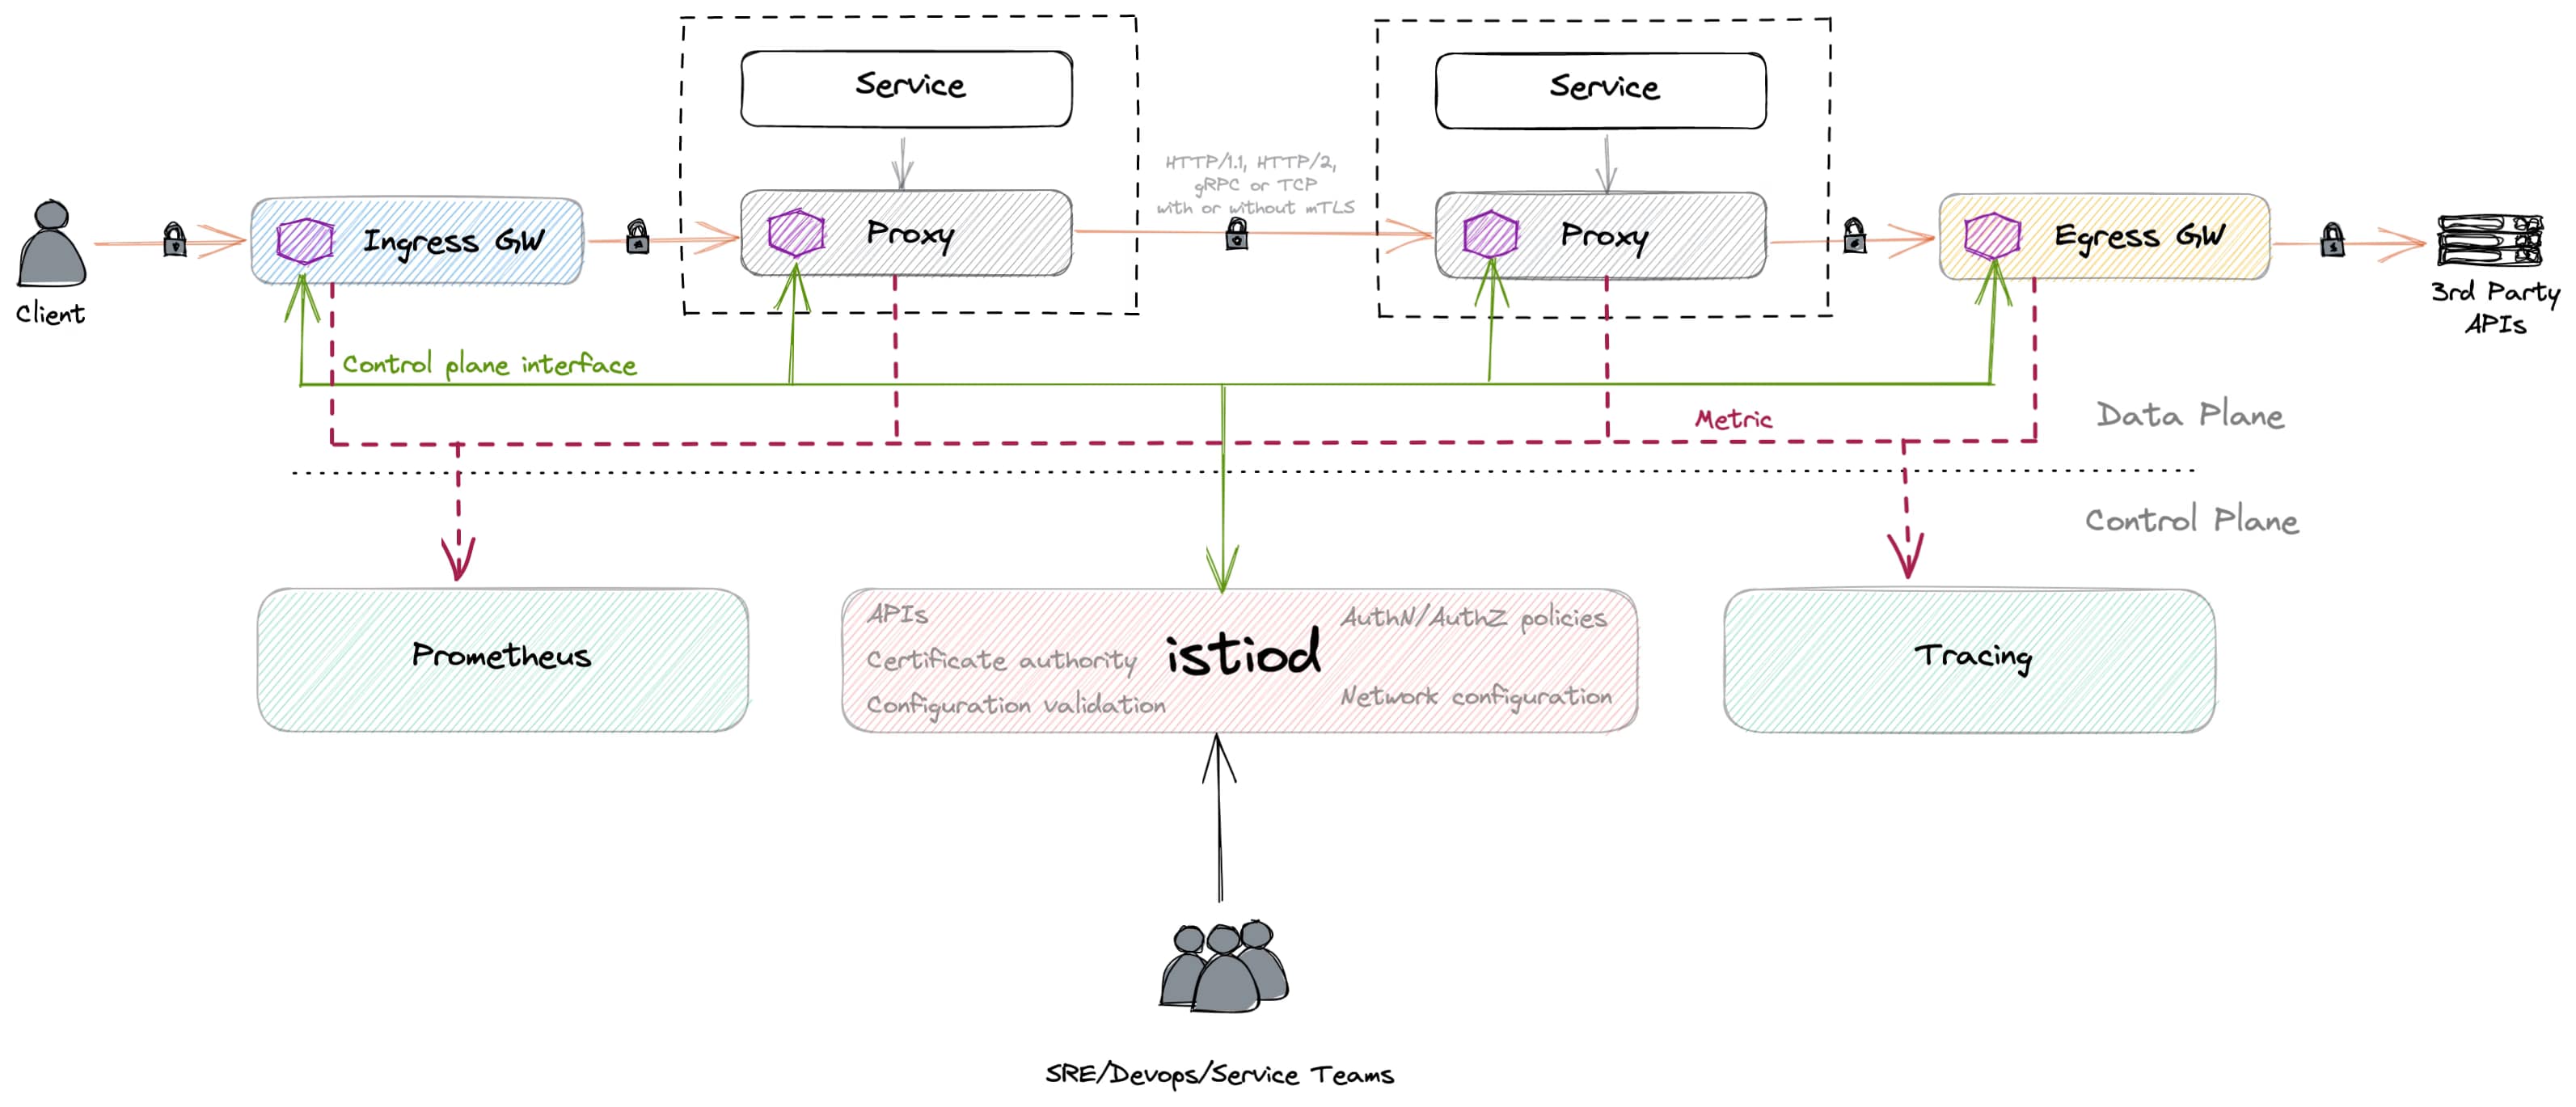
We will use this picture you can see below to keep in mind the concepts and components that will interact as part of the different configurations we will apply to this.

  • We will use the ingress gateway to handle all incoming traffic to the Kubernetes cluster and the egress gateway to handle all outcoming traffic from the cluster.
  • We will have a sidecar container deployed in each application to handle the communication from the gateways or the pod-to-pod communication.

To simplify the testing applications, we will use the default sample applications Istio provides, which you can find here.

How to Expose TLS in Istio?

This is the easiest part, as all the incoming communication you will receive from the outside will enter the cluster through the Istio Ingress Gateway, so it is this component the one that needs to handle the TLS connection and then use the usual security approach to talk to the pod exposing the logic.

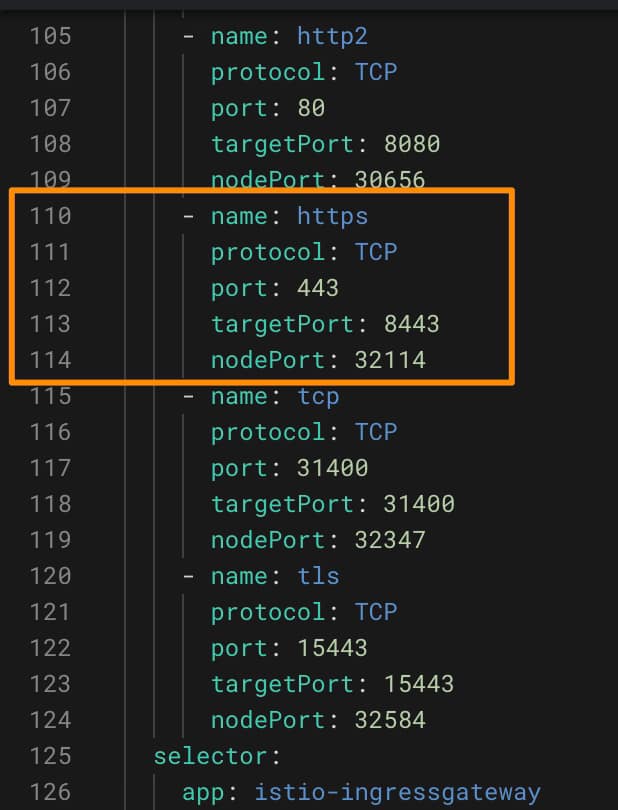
By default, the Istio Ingress Gateway already exposes a TLS port, as you can see in the picture below:

Secure Your Services with Istio: A Step-by-Step Guide to Setting up Istio TLS Connections

So we will need to define a Gateway that receives all this traffic through the HTTPS and redirect that to the pods, and we will do it as you can see here:

apiVersion: networking.istio.io/v1alpha3
kind: Gateway
metadata:
  name: bookinfo-gateway-https
  namespace: default
spec:
  selector:
    istio: ingressgateway
  servers:
    - hosts:
        - '*'
      port:
        name: https
        number: 443
        protocol: HTTPS
      tls:
        mode: SIMPLE # enables HTTPS on this port
        credentialName: httpbin-credential 

As we can see, it is a straightforward configuration, just adding the port HTTPS on the 443 and providing the TLS configuration:

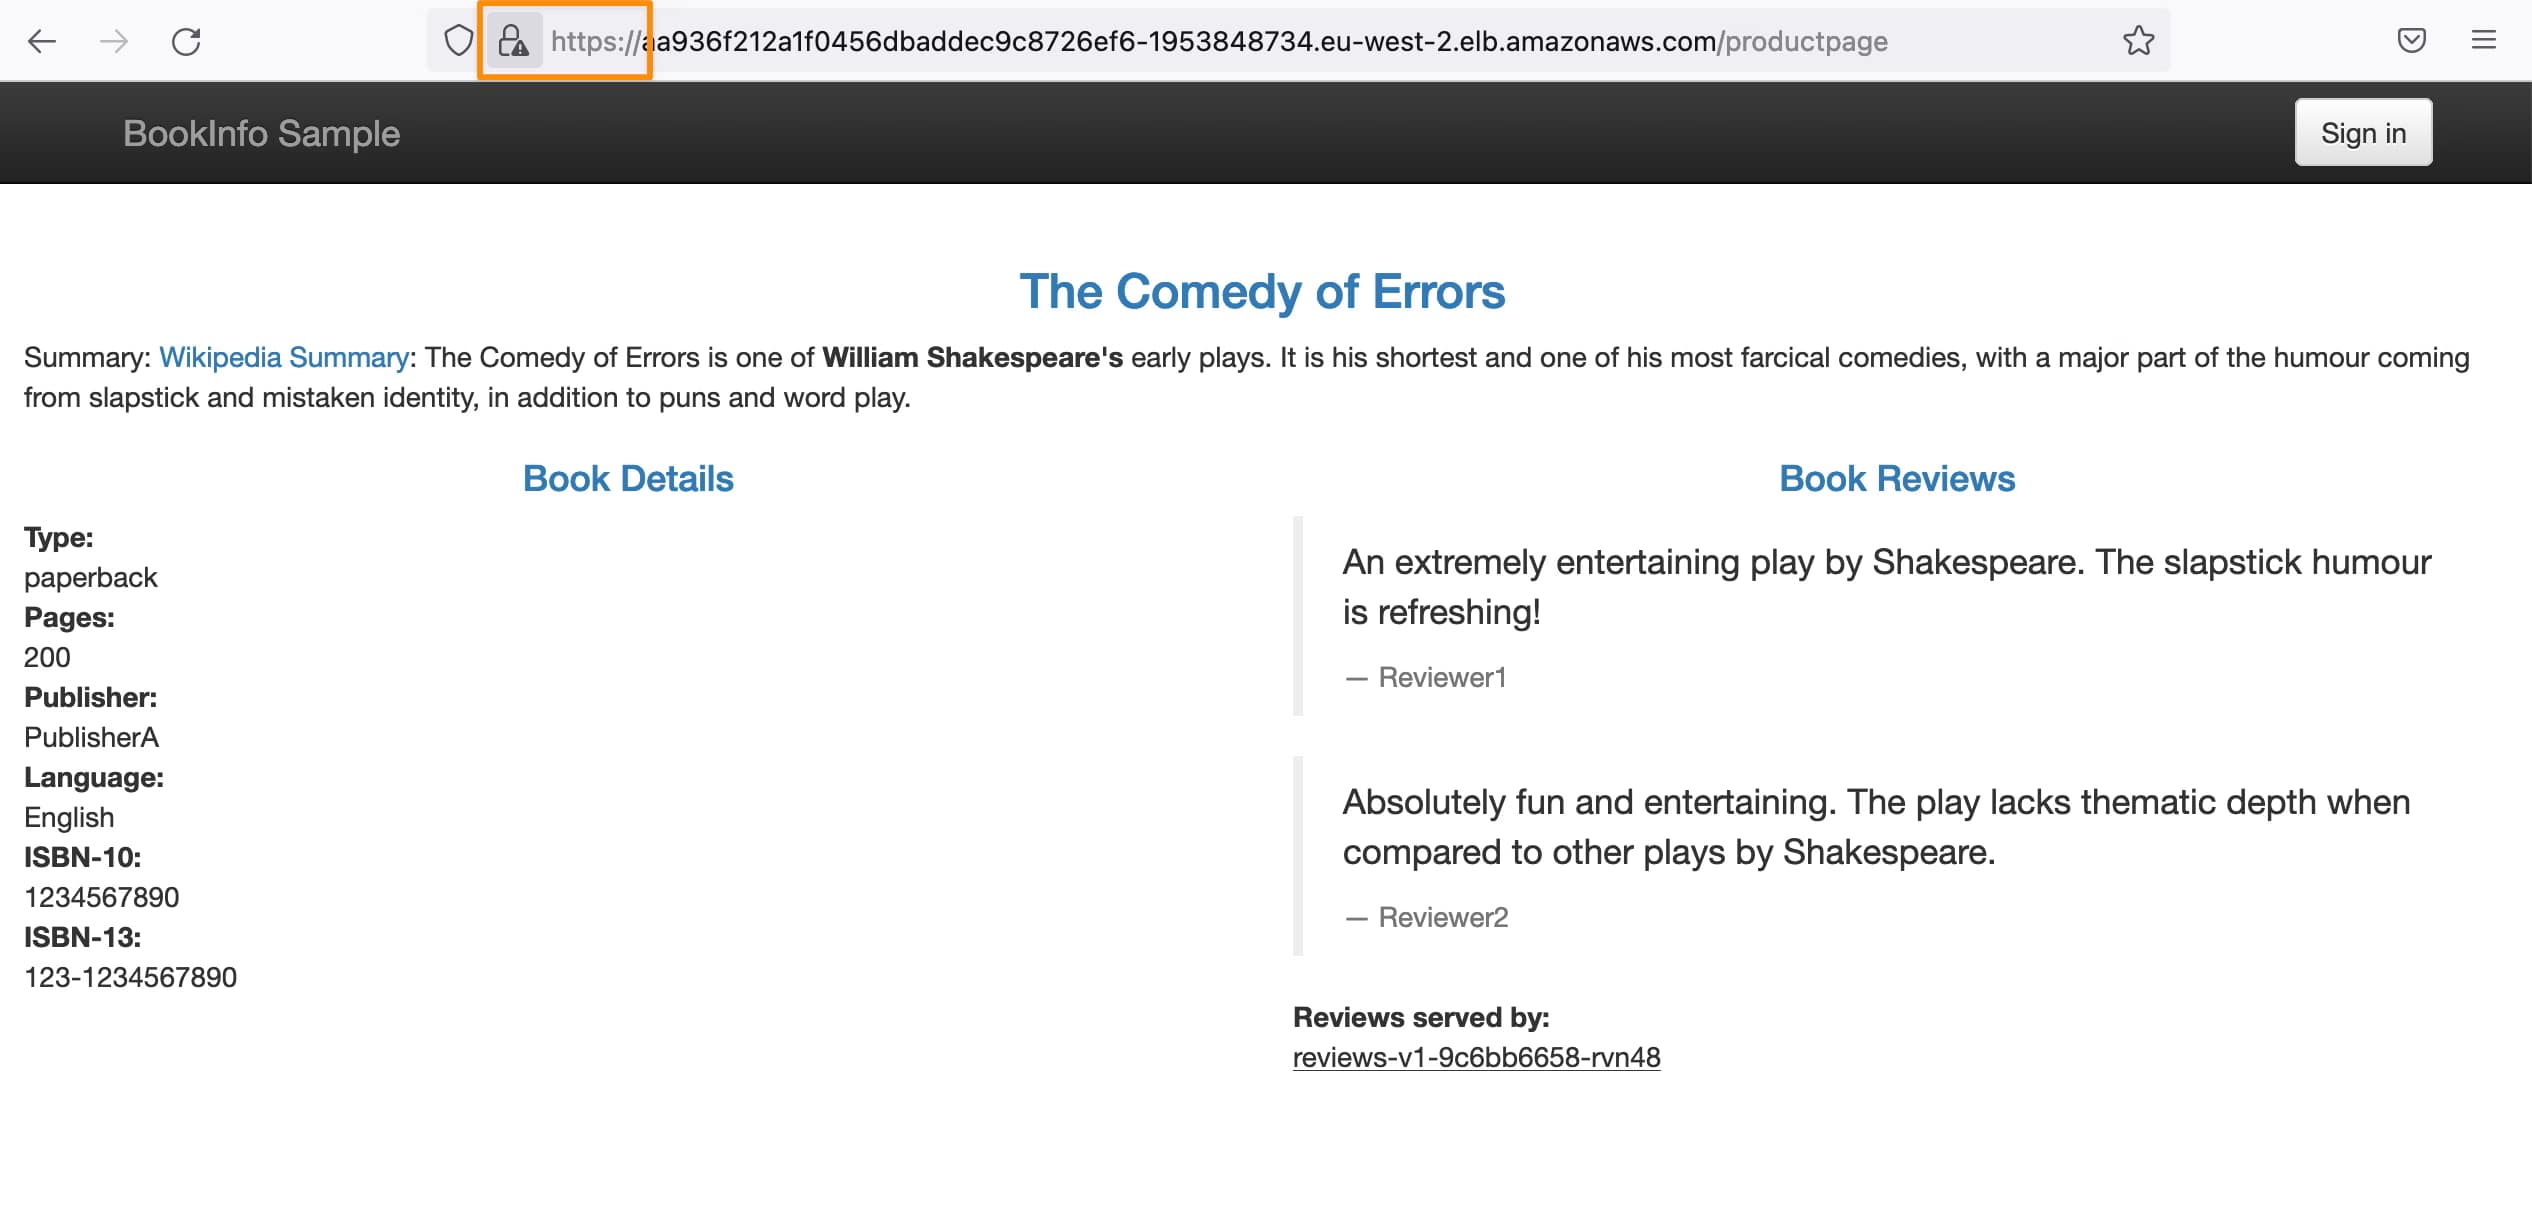
And with that, we can already reach using SSL the same pages:

Secure Your Services with Istio: A Step-by-Step Guide to Setting up Istio TLS Connections

How To Consume SSL from Istio?

Now that we have generated a TLS incoming request without the application knowing anything, we will go one step beyond that and do the most challenging configuration. We will set up TLS/SSL connection to any outgoing communication outside the Kubernetes cluster without the application knowing anything about it.

To do so, we will use one of the Istio concepts we have already covered in a specific article. That concept is the Istio Service Entry that allows us to define an endpoint to manage it inside the MESH.

Here we can see the Wikipedia endpoint added to the Service Mesh registry:

 apiVersion: networking.istio.io/v1beta1
kind: ServiceEntry
metadata:
  name: se-app
  namespace: default
spec:
  hosts:
  - wikipedia.org
  ports:
  - name: https
    number: 443
    protocol: HTTPS
  resolution: DNS

Once we have configured the ServiceEntry, we can define a DestinationRule to force all connections to wikipedia.org will use the TLS configuration:

apiVersion: networking.istio.io/v1beta1
kind: DestinationRule
metadata:
  name: tls-app
  namespace: default
spec:
  host: wikipedia.org
  trafficPolicy:
    tls:
      mode: SIMPLE

📚 Want to dive deeper into Kubernetes? This article is part of our comprehensive Kubernetes Architecture Patterns guide, where you’ll find all fundamental and advanced concepts explained step by step.

Kiali Explained: Observability and Traffic Visualization for Istio Service Mesh

Kiali Explained: Observability and Traffic Visualization for Istio Service Mesh

What Is Kiali?

Kiali is an open-source project that provides observability for your Istio service mesh. Developed by Red Hat, Kiali helps users understand the structure and behavior of their mesh and any issues that may arise.

Kiali provides a graphical representation of your mesh, showing the relationships between the various service mesh components, such as services, virtual services, destination rules, and more. It also displays vital metrics, such as request and error rates, to help you monitor the health of your mesh and identify potential issues.

 What are Kiali Main Capabilities?

One of the critical features of Kiali is its ability to visualize service-to-service communication within a mesh. This lets users quickly see how services are connected, and requests are routed through the mesh. This is particularly useful for troubleshooting, as it can help you quickly identify problems with service communication, such as misconfigured routing rules or slow response times.

Kiali 101: Understanding and Utilizing this Essential Service Mesh Management Tool

Kiali also provides several tools for monitoring the health of your mesh. For example, it can alert you to potential problems, such as a high error rate or a service not responding to requests. It also provides detailed tracking information, allowing you to see the exact path a request took through the mesh and where any issues may have occurred.

In addition to its observability features, Kiali provides several other tools for managing your service mesh. For example, it includes a traffic management module, which allows you to control the flow of traffic through your mesh easily, and a configuration management module, which helps you manage and maintain the various components of your mesh.

Overall, Kiali is an essential tool for anyone using an Istio service mesh. It provides valuable insights into the structure and behavior of your mesh, as well as power monitoring and management tools. Whether you are starting with Istio or an experienced user, Kiali can help ensure that your service mesh runs smoothly and efficiently.

What are the main benefits of using Kiali?

The main benefits of using Kiali are:

  • Improved observability of your Istio service mesh. Kiali provides a graphical representation of your mesh, showing the relationships between different service mesh components and displaying key metrics. This allows you to quickly understand the structure and behavior of your mesh and identify potential issues.
  • Easier troubleshooting. Kiali’s visualization of service-to-service communication and detailed tracing information make it easy to identify problems with service communication and pinpoint the source of any issues.
  • Enhanced traffic management. Kiali includes a traffic management module allowing you to control traffic flow through your mesh easily.
  • Improved configuration management. Kiali’s configuration management module helps you manage and maintain the various components of your mesh.

How To Install Kiali?

There are several ways to install Kiali as part of your Service Mesh deployment, being the preferred option to use the Operator model available here.

You can install this operator using Helm or OperatorHub. To install it using Helm Charts, you need to add the following repository using this command:

 helm repo add kiali https://kiali.org/helm-charts

** Remember that once you add a new repo, you need to run the following command to update the charts available

helm repo update

Now, you can install it using the helm installprimitive such as in the following sample:

helm install \
    --set cr.create=true \
    --set cr.namespace=istio-system \
    --namespace kiali-operator \
    --create-namespace \
    kiali-operator \
    kiali/kiali-operator

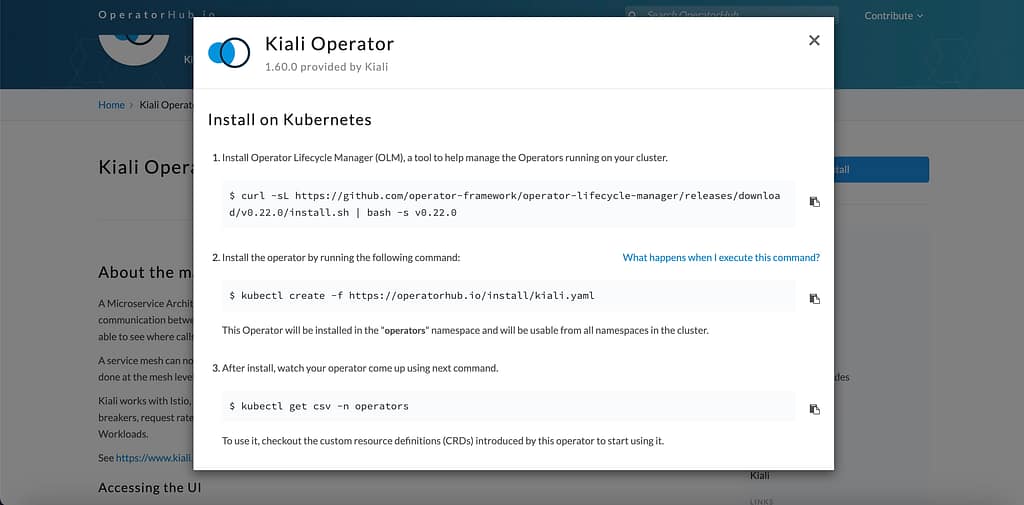
If you prefer going down the route of OperatorHub, you can use the following URL . Now, by clicking on the Install button, you will see the steps to have the component installed in your Kubernetes environment.

Kiali 101: Understanding and Utilizing this Essential Service Mesh Management Tool

In case you want a simple installation of Kiali, you can also use the sample YAML available inside the Istio installation folder using the following command:

kubectl apply -f $ISTIO_HOME/samples/addons/kiali.yaml

How does Kiali work?

Kiali is just the graphical representation of the information available regarding how the service mesh works. So it is not the responsibility of Kiali to store those metrics but to retrieve them and draw them in a relevant way for the user of the tool.

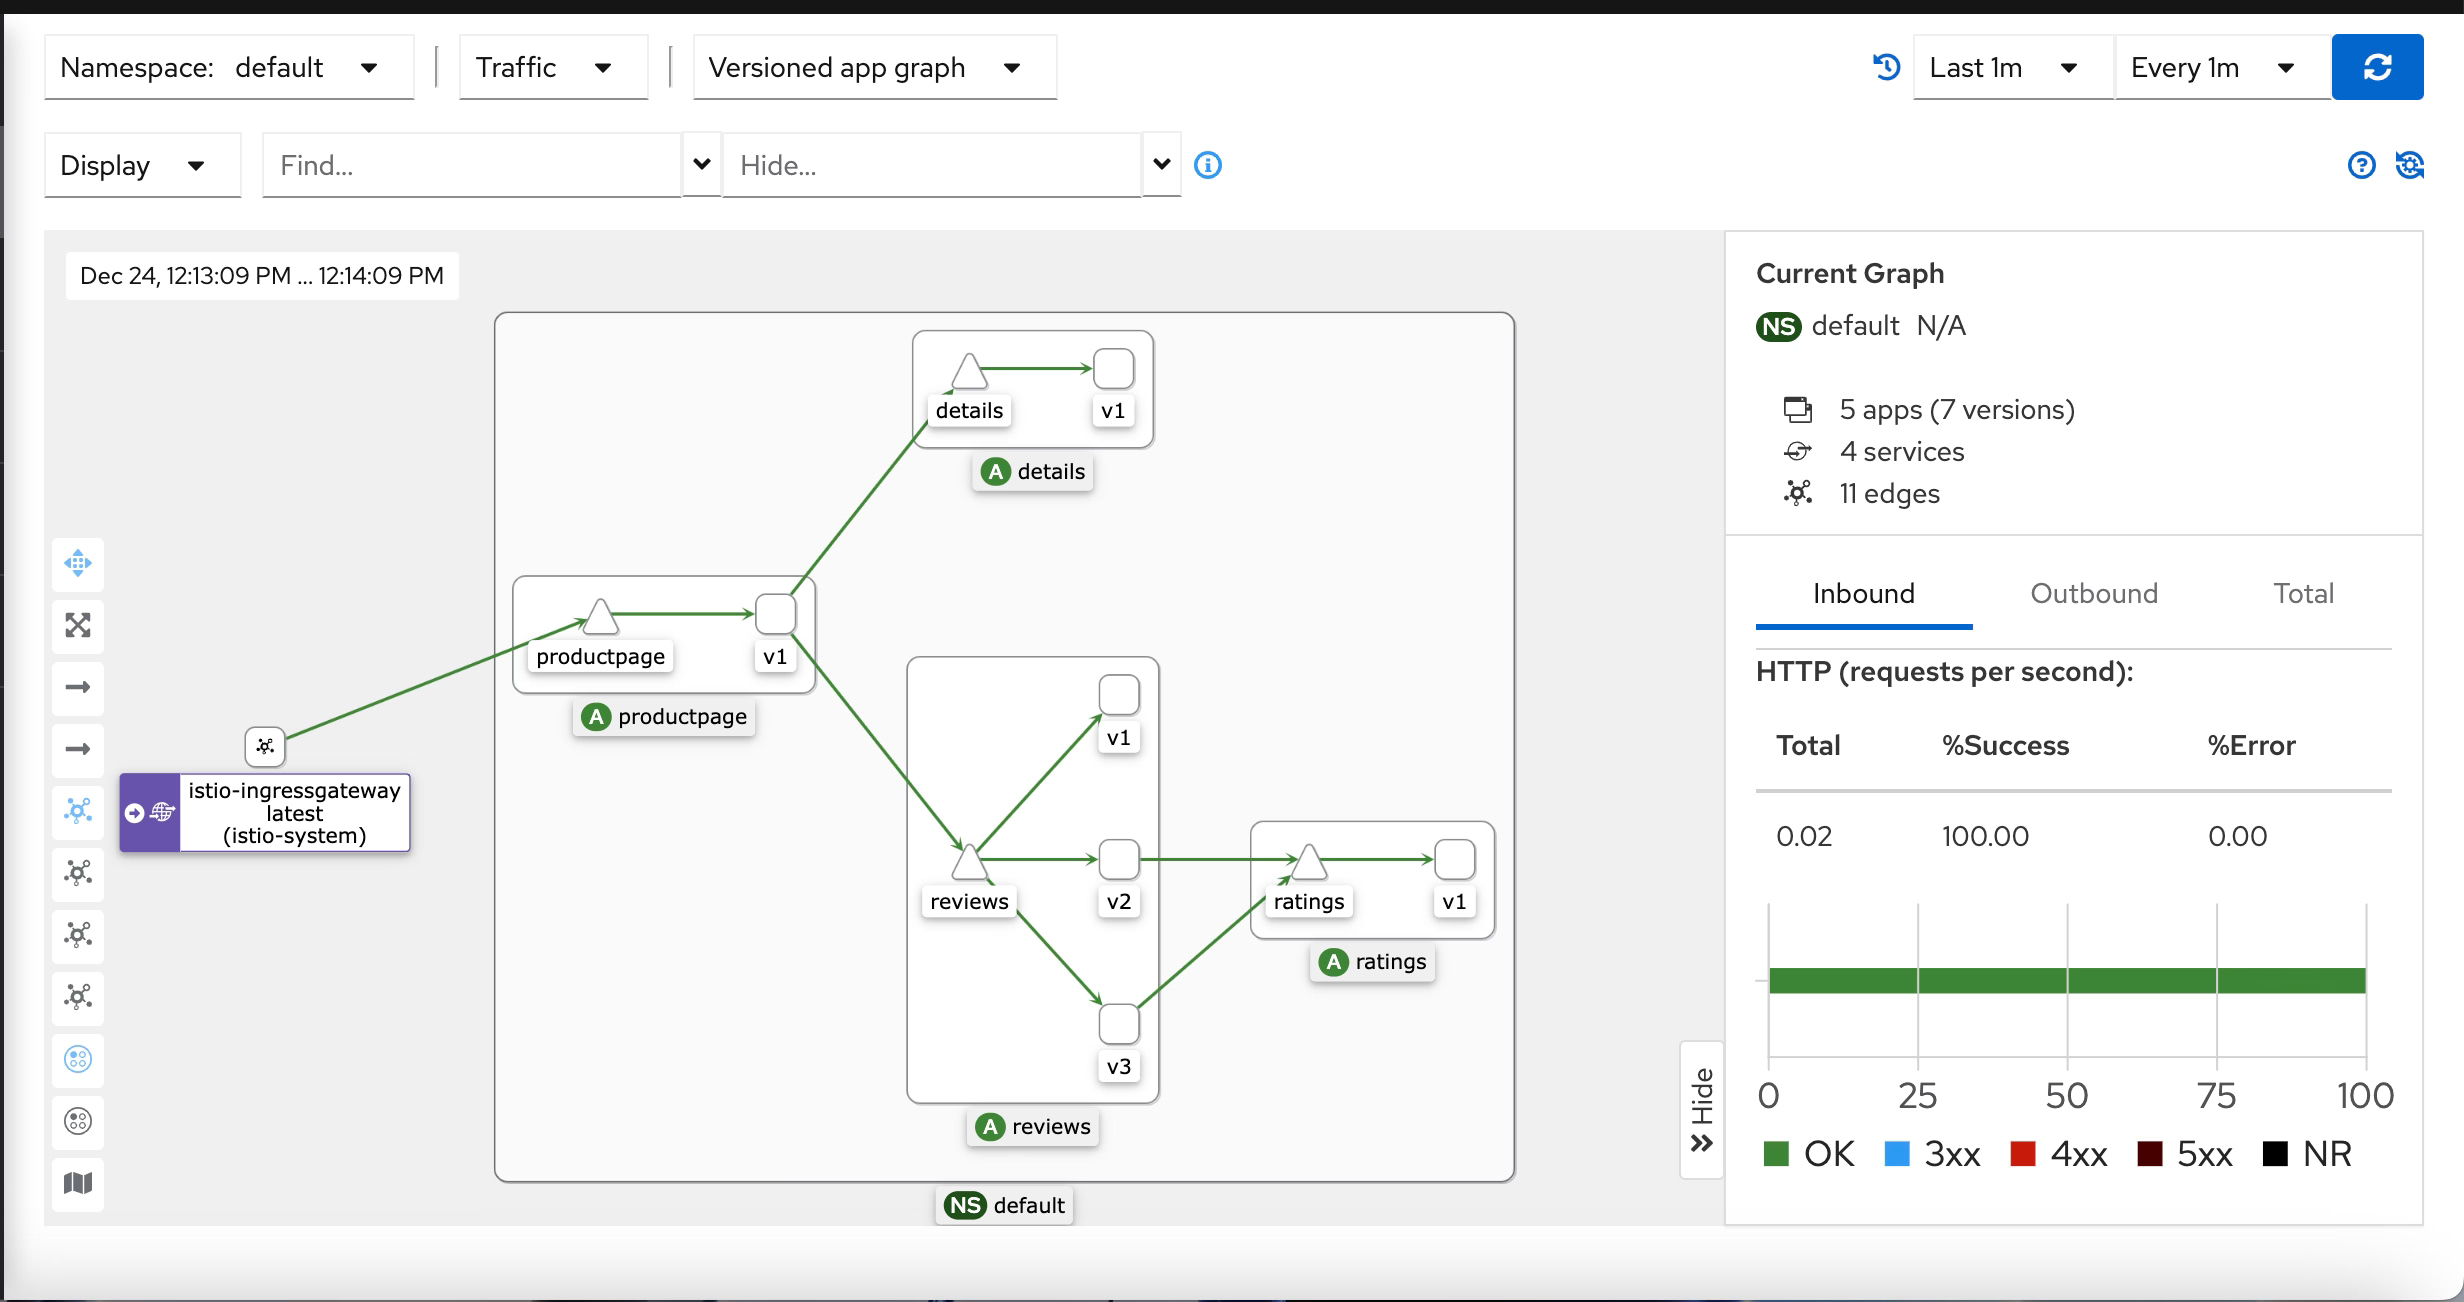
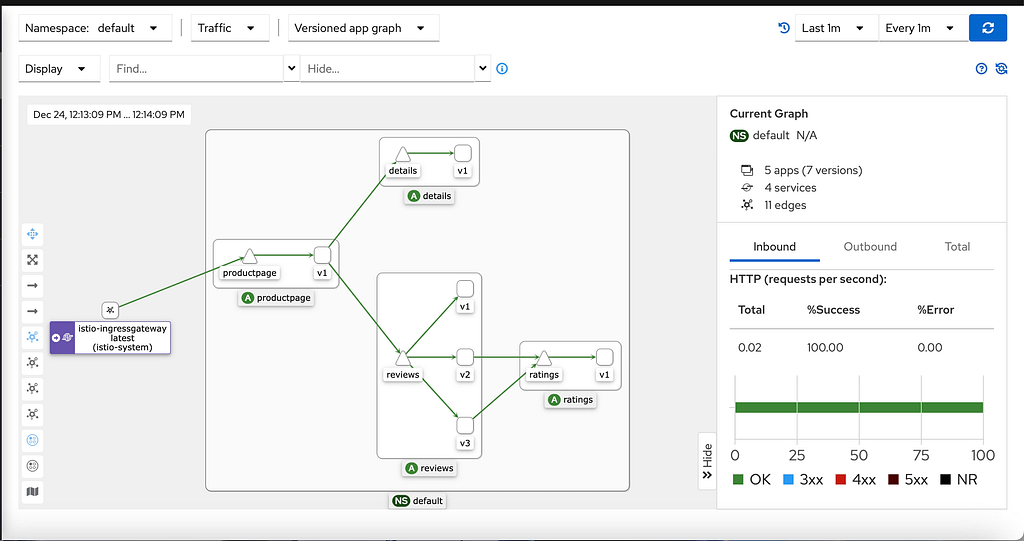
Prometheus does the storage of this data, so Kiali uses the Prometheus REST API to retrieve the information and draw it graphically, as you can see here:

  • It is going to show several relevant parts of the graph. It will show the namespace selected and inside of them the different apps (it would detect an app in case you have a label added to the workload with the name app ). Inside, each app will add different services and pods with other icons (triangles for the services and squares for the pods).
  • It will also show how the traffic reaches the cluster through the different ingress gateways and how it goes out in case we have any egress gateway configured.
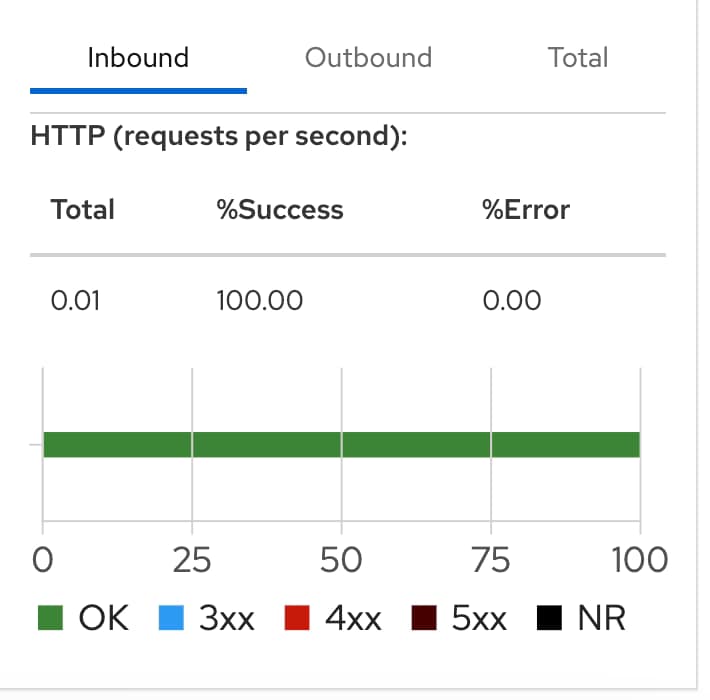
  • It will show the kind of traffic we’re handling and the different error rates based on the kind of protocol, such as TCP, HTTP, and so on, as you can see in the picture below. The protocol is decided based on a naming convention on the port name from the service with the expected format: protocol-name
Kiali 101: Understanding and Utilizing this Essential Service Mesh Management Tool

Can Kiali be used with any service mesh?

No, Kiali is specifically designed for use with Istio service meshes.

It provides observability, monitoring, and management tools for Istio service meshes but is incompatible with other service mesh technologies.

If you use a different service mesh, you will need to find an additional tool for managing and monitoring it.

Are there other alternatives to Kiali?

Even if you cannot see natural alternatives to Kiali to visualize your workloads and traffic through the Istio Service Mesh, you can use other tools to grab the metrics that feed Kiali and have custom visualization using more generic tools such as Grafana, among others.

Let’s talk about similar tools to Kialia for other Service Meshes, such as Linkerd, Consul Connect, or even Kuma. Most follow a different approach where the visualization part is not a separate “project” but relies on a standard visualization tool. That gives you much more flexibility, but at the same time, it lacks most of the excellent visualization of the traffic that Kialia provides, such as graph views or being able to modify the traffic directly from the graph view.

📚 Want to dive deeper into Kubernetes? This article is part of our comprehensive Kubernetes Architecture Patterns guide, where you’ll find all fundamental and advanced concepts explained step by step.

Helm Templates in Files Explained: Customize ConfigMaps and Secrets Content

Helm Templates in Files Explained: Customize ConfigMaps and Secrets Content

Helm Templates in Files, such as ConfigMaps Content or Secrets Content, is of the most common requirements when you are in the process of creating a new helm chart. As you already know, Helm Chart is how we use Kubernetes to package our application resources and YAML in a single component that we can manage at once to ease the maintenance and operation process.


External template files are a powerful technique for managing complex configurations. Discover more advanced Helm templating strategies in our definitive Helm package management guide.

Helm Templates Overview

By default, the template process works with YAML files, allowing us to use some variables and some logic functions to customize and templatize our Kubernetes YAML resources to our needs.

So, in a nutshell, we can only have yaml files inside the templates folder of a YAML. But sometimes we would like to do the same process on ConfigMaps or Secrets or to be more concrete to the content of those ConfigMaps, for example, properties files and so on.

Helm Templates in Files: How To Customize ConfigMaps Content Simplified
Helm Templates in Files: Helm Templates Overview Overview showing the Files outside the templates that are usually required

As you can see it is quite normal to have different files such as json configuration file, properties files, shell scripts as part of your helm chart, and most of the times you would like to give some dynamic approach to its content, and that’s why using helm Templates in Files it is so important to be the main focus for this article

Helm Helper Functions to Manage Files

By default, Helm provides us with a set of functions to manage files as part of the helm chart to simplify the process of including them as part of the chart, such as the content of ConfigMap or Secret. Some of these functions are the following:

  • .Files.Glob: This function allows to find any pattern of internal files that matches the pattern, such as the following example:
    { range $path, $ := .Files.Glob ".yaml" }
  • .Files.Get: This is the simplest option to gather the content of a specific file that you know the full path inside your helm chart, such as the following sample: {{ .Files.Get "config1.toml" | b64enc }}

You can even combine both functions to use together such as in the following sample:

 {{ range $path, $_ :=  .Files.Glob  "**.yaml" }}
      {{ $.Files.Get $path }}
{{ end }}

Then you can combine that once you have the file that you want to use with some helper functions to easily introduce in a ConfigMap and a Secret as explained below:

  • .AsConfig : Use the file content to be introduced as ConfigMap handling the pattern: file-name: file-content
  • .AsSecrets: Similar to the previous one, but doing the base64 encoding for the data.

Here you can see a real example of using this approach in an actual helm chart situation:

apiVersion: v1
kind: Secret
metadata:
  name: zones-property
  namespace: {{ $.Release.Namespace }}
data: 
{{ ( $.Files.Glob "tml_zones_properties.json").AsSecrets | indent 2 }} 

You can find more information about that here. But this only allows us to grab the file as is and include it in a ConfigMap. It is not allowing us to do any logic or any substitution to the content as part of that process. So, if we want to modify this, this is not a valid sample.

How To Use Helm Templates in Files Such as ConfigMaps or Secrets?

In case we can do some modifications to the content, we need to use the following formula:

apiVersion: v1
kind: Secret
metadata:
  name: papi-property
  namespace: {{ $.Release.Namespace }}
data:
{{- range $path, $bytes := .Files.Glob "tml_papi_properties.json" }}
{{ base $path | indent 2 }}: {{ tpl ($.Files.Get $path) $ | b64enc }}
{{ end }}

So, here we are doing is first iterating for the files that match the pattern using the .Files.Glob function we explained before, iterating in case we have more than one. Then we manually create the structure following the pattern : file-name: file-content.

To do that, we use the function base to provide just the filename from a full path (and add the proper indentation) and then use the .Files.Get to grab the file’s content and do the base64 encoding using the b64encfunction because, in this case, we’re handling a secret.

The trick here is adding the tpl function that allows this file’s content to go through the template process; this is how all the modifications that we need to do and the variables referenced from the .Values object will be adequately replaced, giving you all the power and flexibility of the Helm Chart in text files such as properties, JSON files, and much more.

I hope this is as useful for you as it has been for me in creating new helm charts! And Look here for other tricks using loops or dependencies.

DevSecOps vs DevOps: Key Differences Explained by Answering 3 Core Questions

DevSecOps vs DevOps: Key Differences Explained by Answering 3 Core Questions

DevSecOps is a concept you probably have heard extensively in the last few months. You will see it in alignment with the traditional idea of DevOps. This probably, at some point, makes you wonder about a DevSecOps vs DevOps comparison, even trying to understand what are the main differences between them or if they are the same concept. And also, with other ideas starting to appear, such as Platform Engineering or Site Reliability, it is beginning to create some confusion in the field that I would like to clarify today in this article.

What is DevSecOps?

DevSecOps is an extension of the DevOps concept and methodology. Now, it is not a joint effort between Development and Operation practices but a joint effort among Development, Operation, and Security.

DevSecOps vs DevOps: Key Differences Explained by Answering 3 Core Questions
Diagram by GeekFlare: A DevSecOps Introduction (https://geekflare.com/devsecops-introduction/)

Implies introducing security policies, practices, and tools to ensure that the DevOps cycles provide security along this process. We already commented on including security components to provide a more secure deployment process. We even have specific articles about these tools, such as scanners, docker registries, etc.

Why DevSecOps is important?

DevSecOps, or to be more explicit, including security practices as part of the DevOps process, is critical because we are moving to hybrid and cloud architectures where we incorporate new design, deployment, and development patterns such as containers, microservices, and so on.

This situation makes that we are moving from one side to having hundreds of applications in the most complex cases to thousands of applications, and to have dozens of servers to thousands of containers, each of them with different base images and third-party libraries that can be obsolete, have a security hole or just be raised new vulnerabilities such as we have seen in the past with the Spring Framework or the Log4J library to shout some of the most recent global substantial security issues that the companies dealt with.

So, even the most extensive security team cannot be at pace checking manually or with a set of scripting all the different new challenges to the security if we don’t include them as part of the overall process of the development and deployment of the components. This is where the concept of shift-left security is usually considered, and we already covered that in this article you can read here.

DevSecOps vs DevOps: Is DevSecOps just updated DevOps?

So based on the above definition, you can think: “Ok, so when somebody talks about DevOps as not thinking about security”. This is not true.

In the same aspect, when we talk about DevOps, it is not explicitly all the detailed steps, such as software quality assurance, unit testing, etc. So, as happens with many extensions in this industry, the original, global or generic concept includes the contents of the wings as well.

So, in the end, DevOps and DevSecOps are the same things, especially today when all companies and organizations are moving to the cloud or hybrid environments where security is critical and non-negotiable. Hence, every task that we do, from developing software to access to any service, needs to be done with Security in mind. But I used both concepts in different scenarios. I will use DevSecOps when I would like to explicitly highlight the security aspect because of the audience, the context, or the topic we are discussing to do differentiation.

Still, in any generic context, DevOps will include the security checks will be retained for sure because if it is not, it is just useless. Me.

 Summary

So, in the end, when somebody speaks today about DevOps, it implicitly includes the security aspect, so there is no difference between both concepts. But you will see and also find it helpful to use the specific term DevSecOps when you want to highlight or differentiate this part of the process.