Learn what Amazon Managed Service for Prometheus provides and how you can benefit from it.
Monitoring is one of the hot topics when we talk about cloud-native architectures. Prometheus is a graduated Cloud Native Computing Foundation (CNCF) open-source project and one of the industry-standard solutions when it comes to monitoring your cloud-native deployment, especially when Kubernetes is involved.
Following its own philosophy of providing a managed service for some of the most used open-source projects but fully integrated with the AWS ecosystem, AWS releases a general preview (at the time of writing this article): Amazon Managed Service for Prometheus (AMP).
The first thing is to define what Amazon Managed Service for Prometheus is and what features provide. So, this is the Amazon definition of the service:
A fully managed Prometheus-compatible monitoring service that makes it easy to monitor containerized applications securely and at scale.
And I would like to spend some time on some parts of this sentence.
- Fully managed service: So, this will be hosted and handle by Amazon, and we are just going to interact with it using API as we do with other Amazon services like EKS, RDS, MSK, SQS/SNS, and so on.
- Prometheus-compatible: So, that means that even if this is not a pure-Prometheus installation, the API is going to be compatible. So the Prometheus clients who can use Grafana or others to get the information from Prometheus will work without changing their interfaces.
- Service at-scale: Amazon, as part of the managed service, will take care of the solution’s scalability. You don’t need to define an instance-type or how much RAM or CPU you do need. This is going to be handled by AWS.
So, that sounds perfect. So you can think that you are going to delete your Prometheus server, and it will start using this service. Maybe you are even typing something like helm delete prom… WAIT WAIT!!
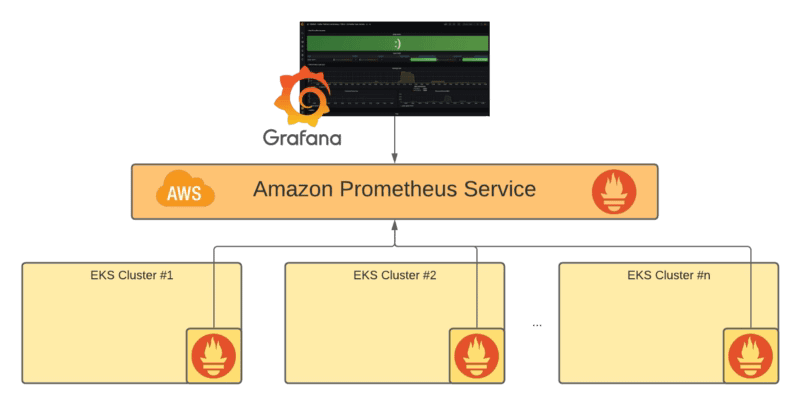
Because at this point, this is not going to replace your local Prometheus server, but it will allow the integration with it. So, that means that your Prometheus server is going to act like a scraper for the whole monitoring scalable solution that AMP is providing, something as you can see in the picture below:

So, you are still going to need a Prometheus server, that is right, but all the complexity are going to be avoided and leverage to the managed service: Storage configuration, High availability, API optimization, and so on is going to be just provided to you out of the box.
Ingesting information into Amazon Managed Service for Prometheus
At this moment, there is two way to ingest data into the Amazon Prometheus Service:
- From an existing Prometheus server using the remote_write capability and configuration, so that means that each series that is scraped by the local Prometheus is going to be sent to the Amazon Prometheus Service.
- Using AWS Distro for OpenTelemetry to integrate with this service using the Prometheus Receiver and the AWS Prometheus Remote Write Exporter components to get that.
Summary
So this is a way to provide an enterprise-grade installation leveraging on all the knowledge that AWS has hosting and managing this solution at scale and optimized in terms of performance. You can focus on the components you need to get the metrics ingested into the service.
I am sure this will not be the last movement from AWS in observability and metrics management topics. I am sure they will continue to provide more tools to the developer’s and architects’ hands to define optimized solutions as easily as possible.
📚 Want to dive deeper into Kubernetes? This article is part of our comprehensive Kubernetes Architecture Patterns guide, where you’ll find all fundamental and advanced concepts explained step by step.

