Helm Templates in Files: How To Customize ConfigMaps Content Simplified in 10 Minutes

Helm Templates in Files, such as ConfigMaps Content or Secrets Content, is of the most common requirements when you are in the process of creating a new helm chart. As you already know, Helm Chart is how we use Kubernetes to package our application resources and YAML in a single component that we can manage at once to ease the maintenance and operation process.

Helm Templates Overview

By default, the template process works with YAML files, allowing us to use some variables and some logic functions to customize and templatize our Kubernetes YAML resources to our needs.

So, in a nutshell, we can only have yaml files inside the templates folder of a YAML. But sometimes we would like to do the same process on ConfigMaps or Secrets or to be more concrete to the content of those ConfigMaps, for example, properties files and so on.

Helm Templates in Files: How To Customize ConfigMaps Content Simplified
Helm Templates in Files: Helm Templates Overview Overview showing the Files outside the templates that are usually required

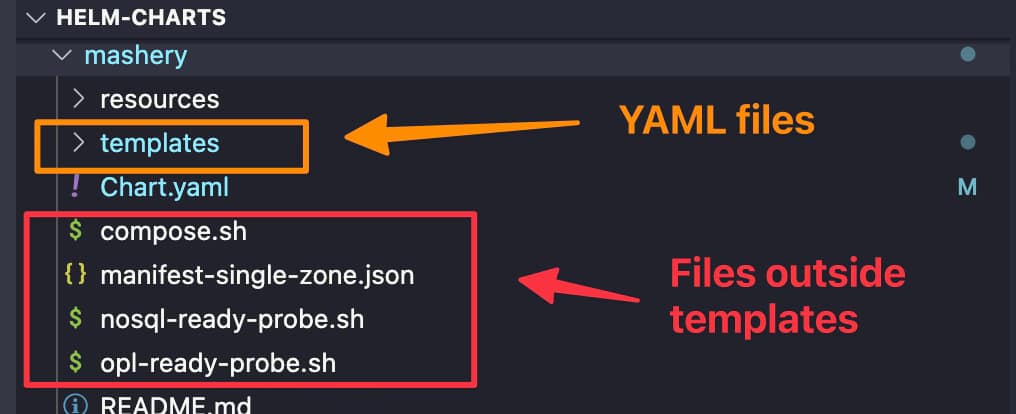
As you can see it is quite normal to have different files such as json configuration file, properties files, shell scripts as part of your helm chart, and most of the times you would like to give some dynamic approach to its content, and that’s why using helm Templates in Files it is so important to be the main focus for this article

Helm Helper Functions to Manage Files

By default, Helm provides us with a set of functions to manage files as part of the helm chart to simplify the process of including them as part of the chart, such as the content of ConfigMap or Secret. Some of these functions are the following:

  • .Files.Glob: This function allows to find any pattern of internal files that matches the pattern, such as the following example:
    { range $path, $ := .Files.Glob ".yaml" }
  • .Files.Get: This is the simplest option to gather the content of a specific file that you know the full path inside your helm chart, such as the following sample: {{ .Files.Get "config1.toml" | b64enc }}

You can even combine both functions to use together such as in the following sample:

 {{ range $path, $_ :=  .Files.Glob  "**.yaml" }}
      {{ $.Files.Get $path }}
{{ end }}

Then you can combine that once you have the file that you want to use with some helper functions to easily introduce in a ConfigMap and a Secret as explained below:

  • .AsConfig : Use the file content to be introduced as ConfigMap handling the pattern: file-name: file-content
  • .AsSecrets: Similar to the previous one, but doing the base64 encoding for the data.

Here you can see a real example of using this approach in an actual helm chart situation:

apiVersion: v1
kind: Secret
metadata:
  name: zones-property
  namespace: {{ $.Release.Namespace }}
data: 
{{ ( $.Files.Glob "tml_zones_properties.json").AsSecrets | indent 2 }} 

You can find more information about that here. But this only allows us to grab the file as is and include it in a ConfigMap. It is not allowing us to do any logic or any substitution to the content as part of that process. So, if we want to modify this, this is not a valid sample.

How To Use Helm Templates in Files Such as ConfigMaps or Secrets?

In case we can do some modifications to the content, we need to use the following formula:

apiVersion: v1
kind: Secret
metadata:
  name: papi-property
  namespace: {{ $.Release.Namespace }}
data:
{{- range $path, $bytes := .Files.Glob "tml_papi_properties.json" }}
{{ base $path | indent 2 }}: {{ tpl ($.Files.Get $path) $ | b64enc }}
{{ end }}

So, here we are doing is first iterating for the files that match the pattern using the .Files.Glob function we explained before, iterating in case we have more than one. Then we manually create the structure following the pattern : file-name: file-content.

To do that, we use the function base to provide just the filename from a full path (and add the proper indentation) and then use the .Files.Get to grab the file’s content and do the base64 encoding using the b64encfunction because, in this case, we’re handling a secret.

The trick here is adding the tpl function that allows this file’s content to go through the template process; this is how all the modifications that we need to do and the variables referenced from the .Values object will be adequately replaced, giving you all the power and flexibility of the Helm Chart in text files such as properties, JSON files, and much more.

I hope this is as useful for you as it has been for me in creating new helm charts! And Look here for other tricks using loops or dependencies.

Nomad vs Kubernetes: 1 Emerging Contestant Defying The Proven King

Nomad is the Hashicorp alternative to the typical pattern of using a Kubernetes-based platform as the only way to orchestrate your workloads efficiently. Nomad is a project started in 2019, but it is getting much more relevant nowadays after 95 releases, and the current version of this article is 1.4.1, as you can see in their GitHub profile.

Nomad approaches the traditional challenges of isolating the application lifecycle for the infrastructure operation lifecycle where that application resides. Still, instead of going full to a container-based application, it tries to provide a solution differently.

What are the main Nomad Features?

Based on its own definition, as you can read on their GitHub profile, they already highlight some of the points of difference between the de-facto industry standard:

Nomad is an easy-to-use, flexible, and performant workload orchestrator that can deploy a mix of microservice, batch, containerized, and non-containerized applications

Easy-to-use: This is the first statement they include in their definition because the Nomad approach is much simpler than alternatives such as Kubernetes because it works on a single-binary approach where it has all the capabilities that are needed running as a node agent based on its own “vocabulary” that you can read more of it in their official documentation.

Flexibility: This is the other critical thing they provide a hypervisor, an intermediate layer between the application and the underlying infrastructure. It is not just limited to container applications but also supports this kind of deployment. It also allows the deploy it as part of a traditional virtual machine approach. The primary use cases highlighted are running standard windows applications, which is tricky when talking about Kubernetes deployments; even though Windows containers have been a thing for so long, their adoption is not at the same level, as you can see in the Linux container world.

Hashicorp Integration: As part of the Hashicorp portfolio, it also includes seamless integration with other Hashicorp projects such as Hashicorp Vault, which we have covered in several articles, or Hashicorp Consul, which helps to provide additional capabilities in terms of security, configuration management, and communication between the different workloads.

Nomad vs Kubernetes: How Nomad Works?

As commented above, Nomad covers everything with a single-component approach. A nomad binary is an agent that can work in server mode or client mode, depending on the role of the machine executing it.

So Nomad is based on a Nomad cluster, a set of machines running a nomad agent in server mode. Those servers are split depending on the role of the leader or followers. The leader performs most of the cluster management, and the followers can create scheduling plans and submit them to the leader for approval and execution. This is represented in the picture below from the Hashicorp Nomad official page:

Nomad vs Kubernetes: 1 Contestant Against the Orchestration King
Nomad simple architecture from nomadproject.io

Once we have the cluster ready, we need to create our jobs, and a job is a definition of the task we would like to execute on the Nomad cluster we have previously set up. A task is the smallest unit of work in Nomad. Here is where the flexibility comes to Nomad because the task driver executes each task, allowing different drivers to execute various workloads. This is how following the same approach, we will have a docker driver to run our container deployment or an exec driver to execute it on top of a virtual infrastructure. Still, you can create your task drivers following a plugin mechanism that you can read more about here.

Jobs and Task are defined using a text-based approach but not following the usual YAML or JSON kind of files but a different format, as you can see in the picture below (click here to download the whole file from the GitHub Nomad Samples repo):

 Is Nomad a Replace for Kubernetes?

Nomad vs Kubernetes: 1 Contestant Against the Orchestration King

It is a complex question to answer, and even Hashicorp they have documented different strategies. You can undoubtedly use Nomad to run container-based deployments instead of running them on Kubernetes. But at the same time, they also position the solution alongside Kubernetes to run some workloads on one solution and another on the other.

In the end, both try to solve and address the same challenges in terms of scalability, infrastructure sharing and optimization, agility, flexibility, and security from traditional deployments.

Kubernetes focus on different kind of workloads, but everything follows the same deployment mode (container-based) and adopts recent paradigms (service-based, microservice patterns, API-led, and so on) with a robust architecture that allows excellent scalability, performance, flexibility, and with adoption levels in the industry that has become the current de-facto only alternative for modern workload orchestration platforms.

But, at the same time, it also requires effort in management and transforming existing applications to new paradigms.

On the other hand, Nomad tries to address it differently, minimizing the change of the existing application to take advantage of the platform’s benefits and reducing the overhead of management and complexity that a usual Kubernetes platform provides, depending on the situation.

Trivy: Get To Scan Docker Local Images with Success

Scan Docker images or, to be more honest, scan your container images is becoming one of the everyday tasks to be done as part of the development of your application. The change of pace of how easily the new vulnerabilities arise, the explosion of dependencies that each of the container images has, and the number of deployments per company make it quite complex to keep the pace to ensure that they can mitigate the security issues.

We already covered this topic some time ago when the Docker Desktop tool introduced the scan option based on an integration with Synk and, more recently, with the latest release of Lens. This is one of the options to check the container images of the “corporate” version of the tool. And since some time also, the central registries from the Cloud have Provided such an ECR, including the Scanning option as one of the capabilities for any image deployed there.

But what happens if you are already moving from Docker Desktop to another option, such as podman or Rancher Desktop? How can you scan your docker images?

Several scanners can be used to scan your container images locally, and some of them are easier than others to set up. One of the main knowns is Clair which is also being used as part of the RedHat Quay registry and has a lot of traction. It works on a client-server mode that is great to be used by different teams that require a more “enterprise” deployment, usually closely related to a Registry. Still, it doesn’t play well to be run locally as it requires several components and relationships.

As an easy option to try locally, you have Trivy. Trivy is an exciting tool developed by AquaSecurity. You may remember the company as this is the one that is behind other developments related to security in Kubernetes, such as KubeBench, that we already covered in the past.

In its own words, “Trivy is a comprehensive security scanner. It is reliable, fast, and straightforward to use and works wherever you need it.”

How to Install Trivy?

The installation process is relatively easy, and documented for every significant platform here. Still, in the end, it relies on binary packages available such as RPM, DEB, Brew, MacPorts, or even a Docker image.

How To Scan Docker Images With Trivy ?

Once it is installed, you can just run the commands such as this:

 trivy image python:3.4-alpine

This will do the following tasks:

  • Update the repository DB with all the vulnerabilities
  • Pull the image in case this is not available locally
  • Detect the languages and components present in that image
  • Validate the images and generate an output

What Output Is Provided By Trivy?

As a sample, this is the output for the python:3.4-alpine as of Today:

Scan Docker Images With Trivy

You will get a table with one row per library or component that has detected a vulnerability showing the Library name and the exposure related to it with the CVE code. CVE code is usually how vulnerabilities are referred to as they are present in a common repository with all their descriptions and details of them. In addition to that, it shows the severity of the vulnerability based on the existing report. It also provides the current version detected on the image and in case there is a different version that fixed that vulnerability, the initial version that has solved that vulnerability, and finally, a title to provide a little bit more context about the vulnerability:

If a Library is related to more than one vulnerability, it will split the cells on that row to access the different data for each vulnerability.

Helm Dependency: Discover How it Works

Helm Dependency is a critical part of understanding how Helm works as it is the way to establish relationships between different helm packages. We have talked a lot here about what Helm is, and some topics around that, and we even provided some tricks if you create your charts.

So, as commented, Helm Chart is nothing more than a package that you put around the different Kubernetes objects that need to be deployed for your application to work. The usual comparison is that it is similar to a Software Package. When you install an application that depends on several components, all of those components are packaged together, and here is the same thing.

What is a Helm Dependency?

A Helm Dependency is nothing more than the way you define that your Chart needs another chart to work. For sure, you can create a Helm Chart with everything you need to deploy your application, but something you would like to split that work into several charts just because they are easy to maintain or the most common use case because you want to leverage another Helm Chart that is already available.

One use case can be a web application that requires a database, so you can create on your Helm Chart all the YAML files to deploy your web application and your Database in Kubernetes, or you can have your YAML files for your web application (Deployment, Services, ConfigMaps,…) and then say: And I need a database and to provide it I’m going to use this chart.

This is similar to how it works with the software packages in UNIX systems; you have your package that does the job, like, for example, A, but for that job to be done, it requires the library L, and to ensure that when you are installing A, Library L is already there or if not it will be installed you declare that your application A depends on Library L, so here is the same thing. You declare that your Chart depends on another Chart to work. And that leaves us to the next point.

How do we declare a Helm Dependency?

This is the next point; now that we understand what a Helm Dependency is conceptually and we have a use case, how can we do that in our Helm Chart?

All the work is done in the Chart.yml file. If you remember, the Chart.yml file is the file where you declare all the metadata of your Helm Chart, such as the name, the version of the chart, the application version, location URL, icon, and much more. And usually has a structure like this one:

apiVersion: v2
name: MyChart
description: My Chart Description
type: application
version: 0.2.0
appVersion: "1.16.0"

So here we can add a section dependencies and, in that section is where we are going to define the charts that we depend on. As you can see in the snippet below:

apiVersion: v2
name: MyChart
description: My Chart Description
type: application
version: 0.2.0
appVersion: "1.16.0"
dependencies:
- name: Dependency
  version: 1.0.0
  repository: "file:///location_of_my_chart"

Here we are declaring Dependency as our Helm Dependency. We specify the version that we would like to use (similar to the version we say in our chart), and that will help us to ensure that we will provide the same version that has been tested as part of the resolution of the dependency and also the location using an URL that can be an external URL is this is pointing to a Helm Chart that is available on the internet or outside your computer or using a File Path in case you are pointing to a local resource in your machine.

That will do the job of defining the helm dependency, and this way, when you install your chart using the command helm install, it will also provide the dependence.

How do I declare a Helm Conditional Dependency?

Until now, we learned how to declare a dependency, and each time I provision my application, it will also provide the dependence. But usually, we would like to have a fine-grained approach to that. Imagine the same scenario as above: We have our Web Application that depends on the Database, and we have two options, we can provision the database as part of the installation of the web application, or we can point to an external database and in that case, it makes no sense to provision the Helm Dependency. How can we do that?

So, easy, because one of the optional parameters you can add to your dependency is condition and do exactly that, condition allow you to specify a flag in your values.yml that in the case is equal to true, it will provide the dependency but in the case is equal to false it will skip that part similar to the snippet shown below:

 apiVersion: v2
name: MyChart
description: My Chart Description
type: application
version: 0.2.0
appVersion: "1.16.0"
dependencies:
- name: Dependency
  version: 1.0.0
  repository: "file:///location_of_my_chart"
  condition: database.enabled 

And with that, we will set the enabled parameter under database in our values.yml to true if we would like to provision it.

How do I declare a Helm Dependency With a Different version?

As shown in the snippets above, we offer that when we declare a Helm Dependency, we specify the version; that is a safe way to do it because it ensures that any change done to the helm chart will not affect your package. Still, at the same time, you cannot be aware of security fixes or patches to the chart that you would like to leverage in your deployment.

To simplify that, you have the option to define the version in a more flexible way using the operator ~ in the definition of the version, as you can see in the snippet below:

apiVersion: v2
name: MyChart
description: My Chart Description
type: application
version: 0.2.0
appVersion: "1.16.0"
dependencies:
- name: Dependency
  version: ~1.0.0
  repository: "file:///location_of_my_chart"
  condition: database.enabled 

This means that any patch done to the chart will be accepted, so this is similar that this chart will use the latest version of 1.0.X. Still, it will not use the 1.1.0 version, so that allows to have more flexibility, but at the same time keeping things safe and secured in case of a breaking change on the Chart you depend on. This is just one way to define that, but the flexibility is enormous as the Chart versions use “Semantic Versions,” You can learn and read more about that here: https://github.com/Masterminds/semver.

OpenLens vs Lens: A New Battle Starts in January 2023

OpenLens vs Lens: A New Battle Starting in January 2023

Introduction

We already talked about Lens several times in different articles but today I am bringing it here OpenLens because after the release of Lens 6 in late July a lot of questions have arrises, especially regarding its change and the relationship with the OpenLens project, so I thought it could be very interesting to bring some of this data all together in the same place so any of you is quite confused. So I would try to explain and answer the main questions you can have at the moment.

What is OpenLens?

OpenLens is the open source project that is behind the code that supports the main functionality of Lens, the software to help you manage and run your Kubernetes Clusters. It is available on GitHub here (https://github.com/lensapp/lens) and it is totally open-source and distributed over an MIT License. In its own words this is the definition:

This repository ("OpenLens") is where Team Lens develops the Lens IDE product together with the community. It is backed by a number of Kubernetes and cloud-native ecosystem pioneers. This source code is available to everyone under the MIT license

OpenLens vs Lens?

So the main question you could have at the moment is what is the difference between Lens and OpenLens. The main difference is that Lens is built on top of OpenLens including some additional software and libraries with different licenses. It is developed by the Mirantis team (the same company that owns the Docker Enterprise) and it is distributed under a traditional EULA.

OpenLens vs Lens: A New Battle Starting in January 2023

Is Lens going to be private?

We need to start by saying that since the beginning Lens has been released under a traditional EULA, so on that front there is not much difference, we can say that OpenLens is Open Source but Lens is Freeware or at least was freeware at that point. But on 28th July we had the release of Lens 6 where the difference between projects started to arise.

As commented on the Mirantis Blog Post a lot of changes and new capabilities have been included but on top of that also the vision has been revealed. As the Mirantis team says they don’t stop at the current level Lens has today to manage the Kubernetes cluster they want to go beyond providing also a Web version of Lens to simplify even more the access, also extend its reach beyond Kubernetes, and so on.

So, you can admit that this is a very compelling vision and very ambitious at the same time and that’s why also they are doing some changes to the license and model, which we are going to talk about below.

Is Lens still free?

We already commented that Lens was always released under a traditional EULA so it was not Open Source like other projects such as its core in OpenLens, but was free to use. With the release on July 28th, this is changing a bit to support their new vision.

They are releasing a new subscription model depending on the usage you are doing of the tool and the approach is very similar to the one they did at the time with Docker Desktop if you remember that we handle that on an article too.

  • Lens Personal subscriptions are for personal use, education, and startups (less than $10 million in annual revenue or funding). They are free of charge.
  • Lens Pro subscriptions are required for professional use in larger businesses. The pricing is $19.90 per user/month or $199 per user/year.

The new license applied with the release of Lens 6 on 28th July but they have provided a Grace Period until January 2023 so you can adapt to this new model.

Should I stop using Lens now?

This is, as always, up to you, but things are going to be the same until January 2023 and at that point, you need to formalize your situation with Lens and Mirantis. If you are under the situation of a Lens Personal license because you are working for a startup or open-source, you can continue to do so without any problem. If that’s not the case, it is up to the company if the additional features they are providing now and also the vision to the future justify the investment you need to do on the Lens Pro license.

You will always have the option to switch from Lens to OpenLens it will not be 100% the same but the core functionalities and approach at this moment will continue to be the same and the project for sure will be very very active. And also as Mirantis already confirmed in the same blog post: “There are no changes to OpenLens licensing or any other upstream open source projects used by Lens Desktop.” So you cannot expect the same situation happens if you are switching to OpenLens or already using OpenLens.

How can I install OpenLens?

Installation of OpenLens is a little bit tricky because you need to generate your build from the source, but to ease that path has been several awesome people that are doing that on their GitHub repositories such as Muhammed Kalkan that is providing a repo with the latest versions with only Open Source components for the major platforms (Windows, macOS X (Intel and Silicon) or Linux) available here:

What Features I am Losing if I switch to OpenLens?

For sure there will be some features that you will be losing if you switch from Lens to OpenLens which are the ones that are provided using the licensed pieces of software. Here we include a non-exclusive list of our experiences using both products:

  • Account Synchronization: All the capabilities of having all your Kubernetes Cluster under your Lens Account and sync will not be available on OpenLens. You will rely on the content of the kubeconfig file
  • Spaces: The option to have your configuration shared between different users that belongs to the same team is not available on OpenLens.
  • Scan Image: One of the new capabilities of the Lens 6 is the option to scan the image of the containers deployed on the cluster, but this is not available on OpenLens.

BanzaiCloud Logging Operator in Kubernetes Simplified in 5 minutes.

How to Configure BanzaiCloud Logging Operator in Kubernetes In Less Than 5 minutes
How to Configure BanzaiCloud Logging Operator in Kubernetes In Less Than 5 minutes (Photo by Markus Spiske on Unsplash)

In the previous article, we described what capability BanzaiCloud Logging Operator provides and its main features. So, today we are going to see how we can implement it.

The first thing we need to do is to install the operator itself, and to do that, we have a helm chart at our disposal, so the only thing that we will need to do are the following commands:

 helm repo add banzaicloud-stable https://kubernetes-charts.banzaicloud.com
helm upgrade --install --wait --create-namespace --namespace logging logging-operator banzaicloud-stable/logging-operator

That will create a logging namespace (in case you didn’t have it yet), and it will deploy the operator components itself, as you can see in the picture below:

BanzaiCloud Logging Operator installed using HelmChart

So, now we can start creating the resources we need using the CRD that we commented on in the previous article but to do a recap. These are the ones that we have at our disposal:

  • logging – The logging resource defines the logging infrastructure for your cluster that collects and transports your log messages. It also contains configurations for Fluentd and Fluent-bit.
  • output / clusteroutput – Defines an Output for a logging flow, where the log messages are sent. output will be namespaced based, and clusteroutput will be cluster based.
  • flow / clusterflow – Defines a logging flow using filters and outputs. The flow routes the selected log messages to the specified outputs. flow will be namespaced based, and clusterflows will be cluster based.

So, first of all, we are going to define our scenario. I don’t want to make something complex; I wish that all the logs that my workloads generate, no matter what namespace they are in, are sent to a Grafana Loki instance that I have also installed on that Kubernetes Cluster on a specific endpoint using the Simple Scalable configuration for Grafana Loki.

So, let’s start with the components that we need. First, we need a Logging object to define my Logging infrastructure, and I will create it with the following command.

kubectl -n logging apply -f - <<"EOF"
apiVersion: logging.banzaicloud.io/v1beta1
kind: Logging
metadata:
  name: default-logging-simple
spec:
  fluentd: {}
  fluentbit: {}
  controlNamespace: logging
EOF

We will keep the default configuration for fluentd and fluent-bit just for the sake of the sample, and later on in upcoming articles, we can talk about a specific design, but that’s it.

Once the CRD is processed, the components will appear on your logging namespace. In my case that I’m using a 3-node cluster, I will see 3 instances for fluent-bit deployed as a DaemonSet and a single example of fluentd, as you can see in the picture below:

BanzaiCloud Logging Operator configuration after applying Logging CRD

So, now we need to define the communication with Loki, and as I would like to use this for any namespace I can have on my cluster, I will use the ClusterOutput option instead of the normal Output one that is namespaced based. And to do that, we will use the following command (please ensure that the endpoint is the right one; in our case, this is loki-gateway. default as it is running inside the Kubernetes Cluster:

kubectl -n logging apply -f - <<"EOF"
apiVersion: logging.banzaicloud.io/v1beta1
kind: ClusterOutput
metadata:
 name: loki-output
spec:
 loki:
   url: http://loki-gateway.default
   configure_kubernetes_labels: true
   buffer:
     timekey: 1m
     timekey_wait: 30s
     timekey_use_utc: true
EOF

And pretty much we have everything; we just need one flow to communicate our Logging configuration to the ClusterOutput we just created. And again, we will go with the ClusterFlow because we would like to define this at the Cluster level and not in a by-namespaced fashion. So we will use the following command:

 kubectl -n logging  apply -f - <<"EOF"
apiVersion: logging.banzaicloud.io/v1beta1
kind: ClusterFlow
metadata:
  name: loki-flow
spec:
  filters:
    - tag_normaliser: {}
  match:
    - select: {}
  globalOutputRefs:
    - loki-output
EOF

And after some time to do the reload of the configuration (1-2 minutes or so), you will start to see in the Loki traces something like this:

Grafana showing the logs submitted by the BanzaiCloud Logging Operator

And that indicates that we are already receiving push of logs from the different components, mainly the fluentd element we configured in this case. But I think it is better to see it graphically with Grafana:

Grafana showing the logs submitted by the BanzaiCloud Logging Operator

And that’s it! And to change our logging configuration is as simple as changing the CRD component we defined, applying matches and filters, or sending it to a new place. Straightforwardly we have this completely managed.

Empower Log Aggregation in Kubernetes with BanzaiCloud Logging Operator

Empower Log Aggregation in Kubernetes with BanzaiCloud Logging Operator
Empower Log Aggregation in Kubernetes with BanzaiCloud Logging Operator (Photo by Markus Spiske on Unsplash)

We already have talked about the importance of Log Aggregation in Kubernetes and why the change in the behavior of the components makes it a mandatory requirement for any new architecture we deployed today.

To solve that part, we have a lot of different stacks that you probably have heard about. For example, if we follow the traditional Elasticsearch path, we will have the pure ELK stack from Elasticsearch, Logstash, and Kibana. Now this stack has been extended with the different “Beats” (FileBeat, NetworkBeat, …) that provides a light log forwarder to be added to the task.

Also, you can change Logstash for a CNCF component such as Fluentd that probably you have heard about, and in that case, we’re talking about an EFK stack following the same principle. And also, have the Grafana Labs view using promtail, Grafana Loki, and Grafana for dashboarding following a different perspective.

Then you can switch and change any component for the one of your preference, but in the end, you will have three different kinds of components:

  • Forwarder: Component that will listen to all the log inputs, mainly the stdout/stderr output from your containers, and push it to a central component.
  • Aggregator: Component that will receive all the traces for the forwarded, and it will have some rules to filter some of the events, format, and enrich the ones received before sending it to central storage.
  • Storage: Component that will receive the final traces to be stored and retrieved for the different clients.

To simplify the management of that in Kubernetes, we have a great Kubernetes Operator named BanzaiCloud Logging Operator that tries to follow that approach in a declarative / policy manner. So let’s see how it works, and to explain it better, I will use its central diagram from its website:

BanzaiCloud Logging Operator Architecture

This operator uses the same technologies we were talking about. It covers mainly the two first steps: Forwarding and Aggregation and the configuration to be sent to a Central Storage of your choice. To do that works with the following technologies, all of them part of the CNCF Landscape:

  • Fluent-bit will act as a forwarded deployed on a DaemonSet mode to collect all the logs you have configured.
  • Fluentd will act as an aggregator defining the flows and rules of your choice to adapt the trace flow you are receiving and sending to the output of your choice.

And as this is a Kubernetes Operator, this works in a declarative way. We will define a set of objects that will define our logging policies. We have the following components:

  • logging – The logging resource defines the logging infrastructure for your cluster that collects and transports your log messages. It also contains configurations for Fluentd and Fluent-bit.
  • output / clusteroutput – Defines an Output for a logging flow, where the log messages are sent. output will be namespaced based, and clusteroutput will be cluster based.
  • flow / clusterflow – Defines a logging flow using filters and outputs. The flow routes the selected log messages to the specified outputs. flow will be namespaced based, and clusterflows will be cluster based.

In the picture below, you will see how these objects are “interacting” to define your desired logging architecture:

BanzaiCloud Logging Operator CRD Relationship

And apart from the policy mode, it also includes a lot of great features such as:

  • Namespace isolation
  • Native Kubernetes label selectors
  • Secure communication (TLS)
  • Configuration validation
  • Multiple flow support (multiply logs for different transformations)
  • Multiple output support (store the same logs in multiple storages: S3, GCS, ES, Loki, and more…)
  • Multiple logging system support (multiple Fluentd, Fluent Bit deployment on the same cluster)

In upcoming articles we were talking about how we can implement this so you can see all the benefits that this CRD-based, policy-based approach can provide to your architecture.

Grafana Loki and MinIO: A Perfect Match!

Grafana Loki and MinIO: A Perfect Match!

Grafana Loki is becoming one of the de-facto standards for log aggregation in Kubernetes workloads nowadays, and today, we are going to show how we can use together Grafana Loki and MinIO. We already have covered on several occasions the capabilities of Grafana Loki that have emerged as the main alternative to the Elasticsearch leadership in the last 5-10 years for log aggregation.

With a different approach, more lightweight, more cloud-native, more focus on the good things that Prometheus has provided but for logs and with the sponsorship of a great company such as Grafana Labs with the dashboard tools as the leader of each day more enormous stack of tools around the observability world.

And also, we already have covered MinIO as an object store that can be deployed anywhere. It’s like having your S3 service on whatever cloud you like or on-prem. So today, we are going to see how both can work together.

Grafana Loki mainly supports three deployment models: monolith, simple-scalable, and distributed. Pretty much everything but monolith has the requirement to have an Object Storage solution to be able to work on a distributed scalable mode. So, if you have your deployment in AWS, you already have covered with S3. Also, Grafana Loki supports most of the Object Storage solutions for the cloud ecosystem of the leading vendors. Still, the problem comes when you would like to rely on Grafana Loki for a private cloud or on-premises installation.

In that case, is where we can rely on MinIO. To be honest, you can use MinIO also in the cloud world to have a more flexible and transparent solution and avoid any lock-in with a cloud vendor. Still, for on-premises, its uses have become mandatory. One of the great features of MinIO is that it implements the S3 API, so pretty much anything that supports S3 will work with MinIO.

In this case, I just need to adapt some values on the helm chart from Loki in the simple-distributed mode as shown below:

 loki:
  storage:
    s3:
      s3: null
      endpoint: http://minio.minio:9000
      region: null
      secretAccessKey: XXXXXXXXXXX
      accessKeyId: XXXXXXXXXX
      s3ForcePathStyle: true
      insecure: true

We’re just pointing to the endpoint from our MinIO tenant, in our case, also deployed on Kubernetes on port 9000. We’re also providing the credentials to connect and finally just showing that needs s3ForcePathSyle: true is required for the endpoint to be transformed to minio.minio:9000/bucket instead to bucket.minio.minio:9000, so it will work better on a Kubernetes ecosystem.

And that’s pretty much it; as soon as you start it, you will begin to see that the buckets are starting to be populated as they will do in case you were using S3, as you can see in the picture below:

MinIO showing buckets and objects from Loki configuration

We already covered the deployment models from MinIO. As shown here, you can use its helm chart or the MinIO operator. But, the integration with Loki it’s even better because the helm charts from Loki already included MinIO as a sub-chart so you can deploy MinIO as part of your Loki deployment based on the configuration you will find on the values.yml as shown below:

 # -------------------------------------
# Configuration for `minio` child chart
# -------------------------------------
minio:
  enabled: false
  accessKey: enterprise-logs
  secretKey: supersecret
  buckets:
    - name: chunks
      policy: none
      purge: false
    - name: ruler
      policy: none
      purge: false
    - name: admin
      policy: none
      purge: false
  persistence:
    size: 5Gi
  resources:
    requests:
      cpu: 100m
      memory: 128Mi

So with a single command, you can have both platforms deployed and configured automatically! I hope this is as useful for you as it was for me when I discovered and did this process.

Learn How to Write Kubernetes YAML Manifest more Efficiently

Learn How to Write Kubernetes YAML Manifest more Efficiently
Learn How to Write Kubernetes YAML Manifest more Efficiently (Photo by Stillness InMotion on Unsplash)

When we are all in this new cloud-native environment where Kubernetes is the uncontestable king, you need to learn how to deal with Kubernetes YAML manifest all the time. You will become an expert on indent sections to make sure this can be processed and so on. But we need to admit that it is tedious. All the benefits from the Kubernetes deployment make an effort worth it, but even with that, it is pretty complex to be able to handle it.

It is true that, to simplify this situation, there are a lot of projects that have been launched, such as Helm to manage templates of related Kubernetes YAML manifest or Kustomize different approaches to get to the sample place or even solutions that are specific to a Kubernetes distribution such as the Openshift Templates. But in the end, none of this can solve the problem at the primary level. So you need to write those files manually yourself.

And what is the process now? You are probably following a different one, but I will tell you my approach. Depending on what I’m trying to create, I try to find a template available for the Kubernetes YAML Manifest that I want to make. This template can be some previous resource that I have already created. Hence, I use that as a base, it could be something generated for some workload that is already deployed (so great that Lens has existed to simplify the management of Running Kubernetes workloads! If you don’t know Lens, please take a look at this article) or if you don’t have anything at hand, you search on google about something similar probably in the Kubernetes documentation, stack overflow or the first reasonable resource that Google provides to you.

And after that, the approach is the same. You go to your Text Editor, VS Code in my case. I have a lot of different plugins to make this process less painful. A lot of different linters validate the structure of the Kubernetes YAML Manifest to make sure everything is indented property, that there are no repeated tags or no missing mandatory tags in the latest version of the resource, and so on.

Things got a bit tricky if you are creating a Helm Chart because in that case the linters for YAML don’t work that well and detect some false positives because they don’t truly understand the Helm syntax. You also complete your setup with a few more linters for Helm, and that’s it. You fight error and error and change by change to have your desired Kubernetes YAML Manifest.

But, it should be a better way to do that? Yes, it should, and this is what tools such as Monokle try to provide a better experience of that process. Let’s see how that works. Starting from their contributor words:

Monokle is your friendly desktop UI for managing Kubernetes manifests. Monokle helps you quickly get a high-level view of your manifests and their contained resources, easily edit resources without having to learn yaml syntax, diff resources against your cluster, preview and debug resources generated with kustomize or Helm, and more.

Monokle helps you in the following ways. First of all, present at the beginning of your work with a set of templates to create your Kubernetes YAML Manifests, as you can see in the picture below:

Monokle Template Selection Dialog

When you select a template, you can populate the required values graphically without needing to type YAML code yourself, as you can see in the picture below:

Monokle Template Value Population Process

It also supports Helm Chart and Kustomize resource recognition so you will quickly see your charts, and you can edit them in a more fashion mode even graphically for some of the resources as well:

Helm Chart Modification using Monokle

If allows good integration in several ways, first of all with OPA so it can validate all the rules and best-practice that you have defined and also you can connect to a running cluster to see the resources from there and also see the difference between them if exists to simplify the process and provide more agility on the Kubernetes YAML Manifest creation process

On top of all of that, Monokle is a certified component from the CNCF foundation, so you will be using a project that is backup from the same foundation is that takes care of Kubernetes itself, among other tasks:

Monokle is part of the CNCF Foundation Landscape

If you want to download Monokle, give it a try and you can do it from its web page: https://monokle.kubeshop.io/ and I’m sure your performance writing Kubernetes YAML Manifest will thank you shortly!

Kubernetes Operators: 5 Things You Truly Need to Know

Kubernetes Operators: 5 Things You Truly Need to Know
Kubernetes Operators: 5 Things You Truly Need to Know (Photo by Dan Lohmar on Unsplash)

Kubernetes Operator has been the new normal to deploy big workloads on Kubernetes, but as some of these principles don’t align immediately with the main concepts of Kubernetes usually generates a little bit of confusion and doubts when you need to use them or even create them.

What Are Kubernetes Operators?

Operators are the way to extend Kubernetes capabilities to manage big workloads where different options are related. In components with a distributed architecture such as monitoring system, log aggregation system, or even service mesh, you can find that. Based on the words from the Kubernetes official documentation , operators are defined as below:

Operators are software extensions to Kubernetes that use custom resources to manage applications and their components. Operators follow Kubernetes principles, notably the control loop.

Its primary usage is for standard services and not as much as the simple application or user workloads, but it could be used in cases even for that scenario.

How Does Kubernetes Operator Works?

The central concept behind the Kubernetes Operator is the extension concept. It is based on the definition and management of custom Kubernetes objects named Custom Resource Definition (CRDs) that allow a description in a Kubernetes way of new concepts that you could need for your workloads.

Some samples of these CRDs are the ServiceMonitor or PodMonitor that we explained in the previous posts, for example, but many more to add. So, that means that now you have a new YAML file to define your objects, and you can use the main primitives from Kubernetes to create, edit, or delete them as needed.

So, for these components to do any work, you need to code some specific controllers that are translating the changes done to those YAML files to reach primitives to the status of the cluster.

Kubernetes Operator Pattern (https://github.com/cncf/tag-app-delivery/blob/eece8f7307f2970f46f100f51932db106db46968/operator-wg/whitepaper/Operator-WhitePaper_v1-0.md#foundation)

How To Manage Kubernetes Operators?

The Kubernetes operator can be installed like any other Kubernetes workload, so depending on the case can be distributed as a YAML file or a Helm Chart. You even can find a shared repository of operators on OperatorsHub.

OperatorHub: Central Repository for Kubernetes Operators

Kubernetes Operator vs. Helm Charts

As already discussed, they are not the same kind of object as Helm Charts because Helm Charts only work at the deployment level doing the packaging and managing of those releases, but operators go a step beyond that because managing and controlling the lifecycle at the runtime level. And as commented, Helm and Operators are compatible; this is, for example, how Prometheus Operator works that have a Helm Chart to deploy itself, as you can find here.

How To Build a Kubernetes Operator

If your goal after reading this is to create a Kubernetes Operator, you need to know that there are already some frameworks that will make your life easier at that task.

Tools like Kopf, kubebuilder, metacontroller , or even the CNCF Operator Framework will provide you the tools and the everyday tasks to start focusing on what your operator needs to do, and they will handle the main daily tasks for you.

 More Resources To Learn about Kubernetes Operator

Suppose you want to learn more about Kubernetes Operators or the Operator pattern. In that case, I strongly recommend you look at the CNCF Operator Whitepaper that you can find here.

This will cover all the topics discussed above in more technical detail and introduce other vital issues, such as security lifecycle management or event best practices.

Other interesting resources are the bibliography resource from the Whitepaper itself that I am going to add here just in case you want to jump directly to the source:

  • Dobies, J., & Wood, J. (2020). Kubernetes Operators. O’Reilly.
  • Ibryam, B. (2019). Kubernetes Patterns. O’Reilly.
  • Operator Framework. (n.d.). Operator Capabilities. Operator Framework. Retrieved 11 2020, 24, from https://operatorframework.io/operator-capabilities/
  • Philips, B. (2016, 03 16). Introducing Operators: Putting Operational Knowledge into Software. CoreOS Blog. Retrieved 11 24, 2020, from https://coreos.com/blog/introducing-operators.html
  • Hausenblas, M & Schimanski, S. (2019). Programming Kubernetes. O’Reilly.