• Skip to primary navigation
  • Skip to main content
Alexandre Vazquez
  • Home
  • TIBCO
    • TIBCO BusinessWorks
    • Flogo
    • TIBFAQS
  • Architecture
    • API
    • Security
    • Integration
    • Event Processing
  • Kubernetes
  • Monitoring
    • Observability
    • Prometheus
    • Log Aggregation
      • Loki
  • Service Mesh
    • Istio
  • Helm
  • Editorial
  • About Me

Prometheus Storage: Optimize the Disk Usage on Your Deployment With These Hacks

Published on 2021-03-12. Last Updated on 2022-09-15 by Alexandre Vazquez

Check out the properties that will let you an optimized use of your disk storage and savings storing your monitoring data

Prometheus Storage: Optimize The Disk Usage On Your Deployment
Photo by JOSHUA COLEMAN on Unsplash

Prometheus has become a standard component in our cloud architectures and Prometheus storage is becoming a critical aspect. So I am going to guess that if you are reading this you already know what Prometheus is. If this is not the case, please take your time to take a look at other articles that I have created:

Prometheus Storage: Optimize The Disk Usage On Your Deployment With These Hacks
Prometheus Monitoring for Microservices using TIBCO
We’re living a world with constant changes and this is even more true in the Enterprise Application world. I’ll not spend much time talking about things you already know, but just say that the microservices architecture approach and the PaaS solutions have been a game-changer for all enterprise integration technologies. This time I’d like to […]
Prometheus Storage: Optimize The Disk Usage On Your Deployment With These Hacks
Kubernetes Service Discovery for Prometheus
In previous posts, we described how to set up Prometheus to work with your TIBCO BusinessWorks Container Edition apps, and you can read more about it here. In that post, we described that there were several ways to update Prometheus about the services that ready to monitor. And we choose the most simple at that […]

We know that usually when we monitor using Prometheus we have so many exporters available at our disposal and also that each of them exposes a lot of very relevant metrics that we need to track everything we need to and that lead to very intensive usage of the storage available if we do not manage accordingly.

There are two factors that affect this. The first one is to optimize the number of metrics that we are storing and we already provide tips to do that in other articles as the ones shown below:

Prometheus Storage: Optimize The Disk Usage On Your Deployment With These Hacks
How it optimize the disk usage in the Prometheus database?
Learn some tricks to analyze and optimize the usage that you are doing of the TSDB and save money on your cloud deployment. Photo by Markus Spiske on Unsplash In previous posts, we discussed how the storage layer worked for Prometheus and how effective it was. But in the current times, we are of cloud computing […]

The other one is how long we store the metrics called the “retention period in Prometheus.” And this property has suffered a lot of changes during the different versions. If you would like to see all the history please take a look at this article from Robust Perception:

Prometheus Storage: Optimize The Disk Usage On Your Deployment With These Hacks
Configuring Prometheus storage retention – Robust Perception | Prometheus Monitoring Experts
How can you control how much history Prometheus keeps?

The main properties that you can configure are the following ones:

  • storage.tsdb.retention.time: Number of days to store the metrics by default to 15d. This property replaces the deprecated one storage.tsdb.retention.
  • storage.tsdb.retention.size: You can specify the limit of size to be used. This is not a hard limit but a minimum so please define some margin here. Units supported: B, KB, MB, GB, TB, PB, EB. Ex: “512MB”. This property is experimental so far as you can see in the official documentation:

https://prometheus.io/docs/prometheus/latest/storage

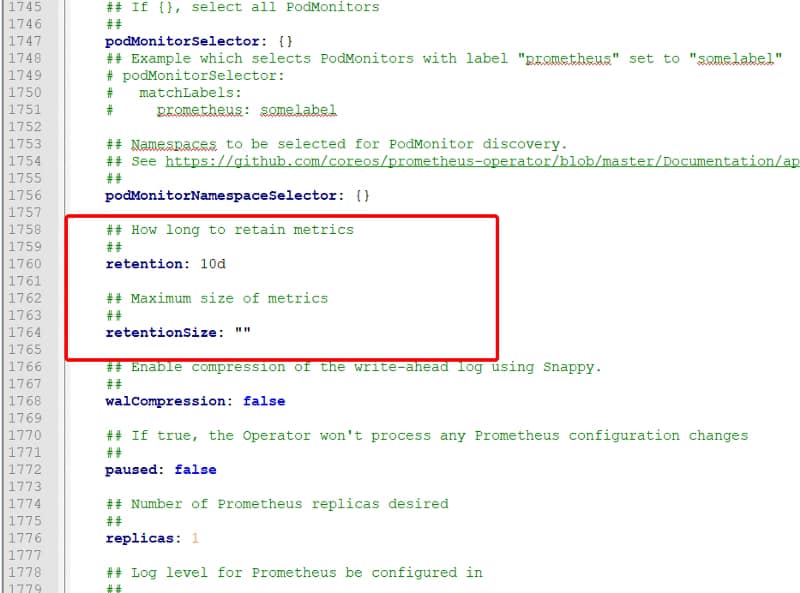
What about setting this configuration in the operator for Kubernetes? In that case, you also have similar options available in the values.yaml configuration file for the chart as you can see in the image below:
Prometheus Storage: Optimize The Disk Usage On Your Deployment With These Hacks
Values.yml For The Prometheus Operator Helm&Nbsp;Chart

This should help you get an optimized deployment of Prometheus that ensures all the features that Prometheus has but at the same time an optimal use of the resources at your disposal.

Additional to that, you should also check the Managed Service options that some providers have regarding Prometheus, such as the Amazon Managed Services for Prometheus, as you can see in the link below:

Prometheus Storage: Optimize The Disk Usage On Your Deployment With These Hacks
Amazon Prometheus Service to Provide More Availability to Your Monitoring Solution
Learn what Amazon Managed Service for Prometheus provides and how you can benefit from it. Photo by Casey Horner on Unsplash Monitoring is one of the hot topics when we talk about cloud-native architectures. Prometheus is a graduated Cloud Native Computing Foundation (CNCF) open-source project and one of the industry-standard solutions when it comes to monitoring your […]
If you find this content interesting please think about making a contribution using the button below to keep this content updated and increased!


Related articles:

Prometheus Storage: How Optimize The Disk Usage?Prometheus Storage: How optimize the disk usage? Aws Prometheus Service To Provide More Availability To Your Monitoring SolutionAWS Prometheus Service to Provide More Availability to Your Monitoring Solution Prometheus Monitoring In Tibco Cloud IntegrationPrometheus Monitoring in TIBCO Cloud Integration Why Is The Prometheus Agent Mode So Great?Why is the Prometheus Agent Mode So Great?

Copyright © 2023 · Custom on Genesis Framework · WordPress · Log in