Grafana Loki with MinIO: Scalable Log Storage for Kubernetes without S3

Grafana Loki with MinIO: Scalable Log Storage for Kubernetes without S3

Grafana Loki is becoming one of the de-facto standards for log aggregation in Kubernetes workloads nowadays, and today, we are going to show how we can use together Grafana Loki and MinIO. We already have covered on several occasions the capabilities of Grafana Loki that have emerged as the main alternative to the Elasticsearch leadership in the last 5-10 years for log aggregation.

With a different approach, more lightweight, more cloud-native, more focus on the good things that Prometheus has provided but for logs and with the sponsorship of a great company such as Grafana Labs with the dashboard tools as the leader of each day more enormous stack of tools around the observability world.

And also, we already have covered MinIO as an object store that can be deployed anywhere. It’s like having your S3 service on whatever cloud you like or on-prem. So today, we are going to see how both can work together.

Grafana Loki mainly supports three deployment models: monolith, simple-scalable, and distributed. Pretty much everything but monolith has the requirement to have an Object Storage solution to be able to work on a distributed scalable mode. So, if you have your deployment in AWS, you already have covered with S3. Also, Grafana Loki supports most of the Object Storage solutions for the cloud ecosystem of the leading vendors. Still, the problem comes when you would like to rely on Grafana Loki for a private cloud or on-premises installation.

In that case, is where we can rely on MinIO. To be honest, you can use MinIO also in the cloud world to have a more flexible and transparent solution and avoid any lock-in with a cloud vendor. Still, for on-premises, its uses have become mandatory. One of the great features of MinIO is that it implements the S3 API, so pretty much anything that supports S3 will work with MinIO.

In this case, I just need to adapt some values on the helm chart from Loki in the simple-distributed mode as shown below:

 loki:
  storage:
    s3:
      s3: null
      endpoint: http://minio.minio:9000
      region: null
      secretAccessKey: XXXXXXXXXXX
      accessKeyId: XXXXXXXXXX
      s3ForcePathStyle: true
      insecure: true

We’re just pointing to the endpoint from our MinIO tenant, in our case, also deployed on Kubernetes on port 9000. We’re also providing the credentials to connect and finally just showing that needs s3ForcePathSyle: true is required for the endpoint to be transformed to minio.minio:9000/bucket instead to bucket.minio.minio:9000, so it will work better on a Kubernetes ecosystem.

And that’s pretty much it; as soon as you start it, you will begin to see that the buckets are starting to be populated as they will do in case you were using S3, as you can see in the picture below:

MinIO showing buckets and objects from Loki configuration

We already covered the deployment models from MinIO. As shown here, you can use its helm chart or the MinIO operator. But, the integration with Loki it’s even better because the helm charts from Loki already included MinIO as a sub-chart so you can deploy MinIO as part of your Loki deployment based on the configuration you will find on the values.yml as shown below:

 # -------------------------------------
# Configuration for `minio` child chart
# -------------------------------------
minio:
  enabled: false
  accessKey: enterprise-logs
  secretKey: supersecret
  buckets:
    - name: chunks
      policy: none
      purge: false
    - name: ruler
      policy: none
      purge: false
    - name: admin
      policy: none
      purge: false
  persistence:
    size: 5Gi
  resources:
    requests:
      cpu: 100m
      memory: 128Mi

So with a single command, you can have both platforms deployed and configured automatically! I hope this is as useful for you as it was for me when I discovered and did this process.

📚 Want to dive deeper into Kubernetes? This article is part of our comprehensive Kubernetes Architecture Patterns guide, where you’ll find all fundamental and advanced concepts explained step by step.

Top 3 Ways to Deploy Grafana Loki on Kubernetes for Scalable Logging

Top 3 Ways to Deploy Grafana Loki on Kubernetes for Scalable Logging

Deployment Models for a Scalable Log Aggregation Architecture using Loki

Deploy a scalable Loki is not an straightforward task. We already have talked about Loki in previous posts on the site, and it is becoming more and more popular, and usage becomes much more regular each day. That is why I think it makes sense to include another post regarding Loki Architecture.

Loki has several advantages that promote it as a default choice to deploy a Log Aggregation Stack. One of them is its scalability because you can see across different deployment models how many components you like to deploy and their responsibilities. So the target of the topic is to show you how to deploy an scalable Loki solution and this is based on two concepts: components available and how you group them.

So we will start with the different components:

  • ingester: responsible for writing log data to long-term storage backends (DynamoDB, S3, Cassandra, etc.) on the write path and returning log data for in-memory queries on the read path.
  • distributor: responsible for handling incoming streams by clients. It’s the first step in the write path for log data.
  • query-frontend: optional service providing the querier’s API endpoints and can be used to accelerate the read path
  • querier: service handles queries using the LogQL query language, fetching logs from the ingesters and long-term storage.
  • ruler: responsible for continually evaluating a set of configurable queries and performing an action based on the result.

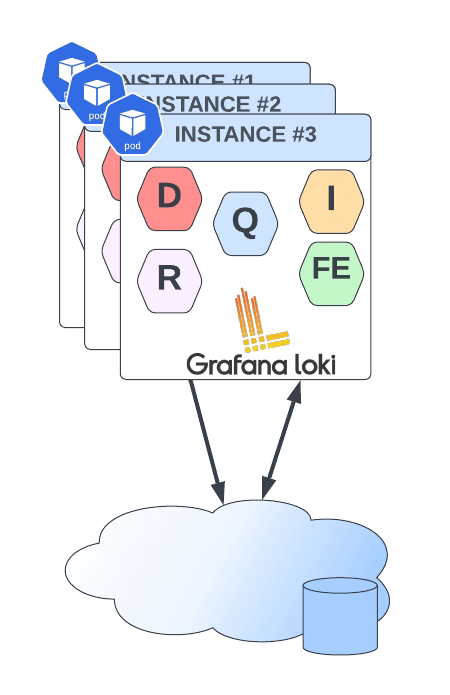
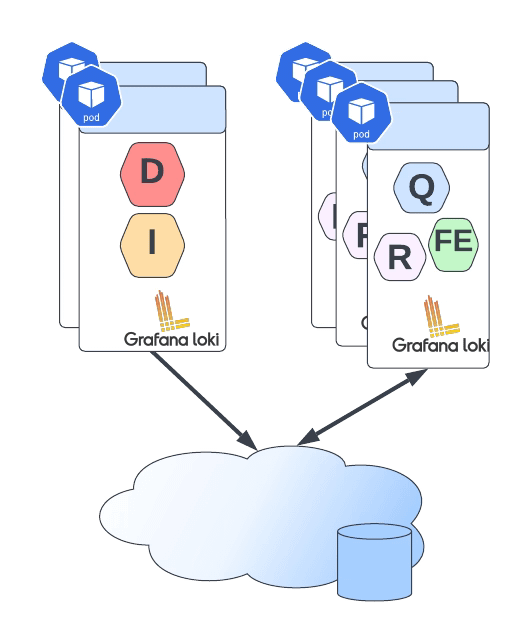
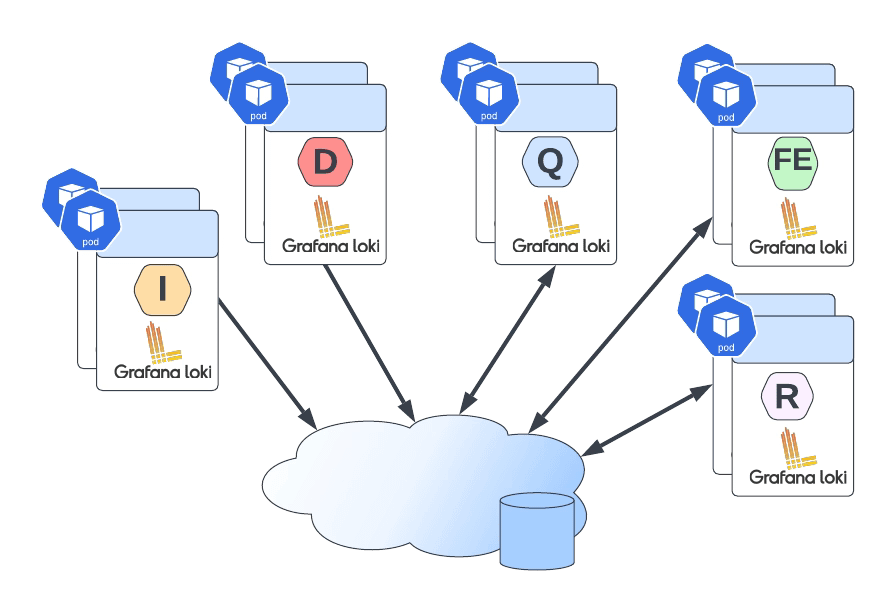
Then you can join them into different groups, and depending on the size of these groups, you have a different deployment topology, as shown below:

Top 3 Ways to Deploy Grafana Loki on Kubernetes for Scalable Logging
Loki Monolith Deployment Mode
  • Monolith: As you can imagine, all components are running together in a single instance. This is the simplest option and is recommended as a 100 GB / day starting point. You can even scale this deployment, but it will scale all components simultaneously, and it should have a shared object state.
Top 3 Ways to Deploy Grafana Loki on Kubernetes for Scalable Logging
Loki Simple Scalable Deployment Mode
  • Simple Scalable Deployment Model: This is the second level, and it can scale up at several TB of logs per day. It consists of splitting the components into two different profiles: read and write.
Top 3 Ways to Deploy Grafana Loki on Kubernetes for Scalable Logging
Loki Microservice Deployment Mode
  • Microservices: That means that each component will be managed independently, giving you all the power at your hand to scale each of these components alone.

Defining the deployment model of each instance is very easy, and it is based on a single parameter named target. So depending on the value of the target it will follow one of the previous deployment models:

  • all (default): It will deploy as in monolith mode.
  • write: It will be the write path on the simple scalable deployment model
  • read: It will be the reading group on the simple, scalable deployment model
  • ingester, distributor, query-frontend, query-scheduler, querier, index-gateway, ruler, compactor: Individual values to deploy a single component for the microservice deployment model.

The target argument will help for an on-premises kind of deployment. Still, if you are using Helm for the installation, Loki already provides different helm charts for the other deployment models:

But all those helm charts are based on the same principle commented above on defining the role of each instance using the argument target, as you can see in the picture below:

Top 3 Ways to Deploy Grafana Loki on Kubernetes for Scalable Logging

📚 Want to dive deeper into Kubernetes? This article is part of our comprehensive Kubernetes Architecture Patterns guide, where you’ll find all fundamental and advanced concepts explained step by step.

Loki vs ELK Stack: Lightweight Log Aggregation for Kubernetes and Cloud-Native

Loki vs ELK Stack: Lightweight Log Aggregation for Kubernetes and Cloud-Native

Learn about the new horizontally-scalable, highly available, multi-tenant log aggregation system inspired by Prometheus that can be the best fit for your logging architecture

Loki vs ELK is something you are reading and hearing each time more often as from some time it is a raise on the dispute of becoming the de-factor standard for log aggregation architectures.

When we talk about Cloud-Native Architecture, log aggregation is something key that you need to consider. The old practices that we followed in the on-premises virtual machine approach for logging are not valid anymore.

We already cover this topic in my previous post that I recommend you to talk a look in case you haven’t read it yet, but this is not the topic for today.

Elasticsearch as the core and the different derívate de stacks like ELK/EFK had gained popularity in the last years, being pretty much the default open-source option when we talked about log aggregation and one of the options. The main public cloud providers have also adopted this solution as part of their own offering as the Amazon Elasticsearch Service provides.

But Elasticsearch is not perfect. If you have already used it, you probably know about it. Still, because their features are so awesome, especially on the searching and indexing capabilities, it has been the kind of leader today. But other topics like the storage use, the amount of power you need to handle it, and the architecture with different kinds of nodes (master, data, ingester) increase its complexity for cases when we need something smaller.

And to fill this gap is where our main character for today’s post arrives: Loki or Grafana Loki.

Loki vs ELK Stack: Lightweight Log Aggregation for Kubernetes and Cloud-Native
Grafana Loki Logo from https://grafana.com/oss/loki/

Loki is a logging management system created as part of the Grafana project, and it has been created with a different approach in mind than Elasticsearch.

Loki is a horizontally-scalable, highly-available, multi-tenant log aggregation system inspired by Prometheus. It is designed to be very cost effective and easy to operate. It does not index the contents of the logs, but rather a set of labels for each log stream.

So as we can read in the definition from their own page above, it covers several interesting topics in comparison with Elasticsearch:

  • First of all, it addresses some of the usual pain points for ELK customers: It is very cost-effective and easy to operate.
  • It clearly says that the approach is not the same as ELK, you are not going to have a complete index of the payload for the events, but it is based on different labels that you can define for each log stream.
  • Prometheus inspires that, which is critical because it enabled the idea to use log traces as metrics to empower our monitoring solutions.

Let’s start with the initial questions when we show an interesting new technology, and we would like to start testing it.

How can I install Loki?

Loki is distributed in different flavors to be installed in your environment in the way you need it.

  • SaaS: provided as part of the hosting solution of Grafana Cloud.
  • On-Premises: Provided as a normal binary to be download to run in an on-premises mode.
  • Cloud: Provided a docker image or even a Helm Chart to be deployed into your Kubernetes-based environment.

GrafanaLabs teams also provide Enterprise Support for Loki if you would like to use it on production mode in your company. Still, at the same time, all the code is licensed using Apache License 2.0, so you can take a look at all the code and contribute to it.

How does Loki work?

Loki vs ELK Stack: Lightweight Log Aggregation for Kubernetes and Cloud-Native
High-level Loki Architecture from https://grafana.com/blog/2018/12/12/loki-prometheus-inspired-open-source-logging-for-cloud-natives/

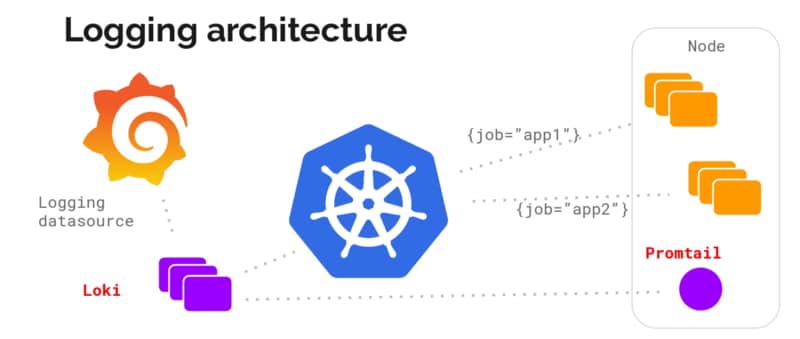
Architecture wise is very similar to the ELK/EFK stack and follow the same approach of “collectors” and “indexers” as ELK has:

  • Loki itself is the central node of the architecture responsible for storing the log traces and their labels and provided an API to search among them based on their own language LogQL (a similar approach to the PromQL from Prometheus).
  • promtail is the agent component that runs in the edge getting all those log traces that we need that can be running on a machine on-prem or a DaemonSet fashion in our own Kubernetes cluster. It plays the same role as Logstash/Fluent-bit/Fluentd works in the ELK/EFK stack. Promtail provides the usual plugin mode to filter and transforms our log traces as the other solutions provide. At the same time, it provides an interesting feature to convert those log traces into Prometheus metrics that can be scraped directly by your Prometheus server.
  • Grafana is the UI for the whole stack and plays a similar role as Kibana in the ELK/EFK stack. Grafana, among other plugins, provides direct integration with Loki as a Datasource to explore those traces and include them in the Dashboards.

Summary

Grafana Loki can be a great solution for your logging architecture to cover address two points: Provide a Lightweight log aggregation solution for your environment and at the same time enable your log traces as a source for your metrics, allowing you to create detailed, more business-oriented metrics that use in your dashboards and your monitoring systems.

📚 Want to dive deeper into Kubernetes? This article is part of our comprehensive Kubernetes Architecture Patterns guide, where you’ll find all fundamental and advanced concepts explained step by step.