Write Kubernetes YAML Manifests More Efficiently: Tools, Templates, and Best Practices

Write Kubernetes YAML Manifests More Efficiently: Tools, Templates, and Best Practices

When we are all in this new cloud-native environment where Kubernetes is the uncontestable king, you need to learn how to deal with Kubernetes YAML manifest all the time. You will become an expert on indent sections to make sure this can be processed and so on. But we need to admit that it is tedious. All the benefits from the Kubernetes deployment make an effort worth it, but even with that, it is pretty complex to be able to handle it.

It is true that, to simplify this situation, there are a lot of projects that have been launched, such as Helm to manage templates of related Kubernetes YAML manifest or Kustomize different approaches to get to the sample place or even solutions that are specific to a Kubernetes distribution such as the Openshift Templates. But in the end, none of this can solve the problem at the primary level. So you need to write those files manually yourself.

And what is the process now? You are probably following a different one, but I will tell you my approach. Depending on what I’m trying to create, I try to find a template available for the Kubernetes YAML Manifest that I want to make. This template can be some previous resource that I have already created. Hence, I use that as a base, it could be something generated for some workload that is already deployed (so great that Lens has existed to simplify the management of Running Kubernetes workloads! If you don’t know Lens, please take a look at this article) or if you don’t have anything at hand, you search on google about something similar probably in the Kubernetes documentation, stack overflow or the first reasonable resource that Google provides to you.

And after that, the approach is the same. You go to your Text Editor, VS Code in my case. I have a lot of different plugins to make this process less painful. A lot of different linters validate the structure of the Kubernetes YAML Manifest to make sure everything is indented property, that there are no repeated tags or no missing mandatory tags in the latest version of the resource, and so on.

Things got a bit tricky if you are creating a Helm Chart because in that case the linters for YAML don’t work that well and detect some false positives because they don’t truly understand the Helm syntax. You also complete your setup with a few more linters for Helm, and that’s it. You fight error and error and change by change to have your desired Kubernetes YAML Manifest.

But, it should be a better way to do that? Yes, it should, and this is what tools such as Monokle try to provide a better experience of that process. Let’s see how that works. Starting from their contributor words:

Monokle is your friendly desktop UI for managing Kubernetes manifests. Monokle helps you quickly get a high-level view of your manifests and their contained resources, easily edit resources without having to learn yaml syntax, diff resources against your cluster, preview and debug resources generated with kustomize or Helm, and more.

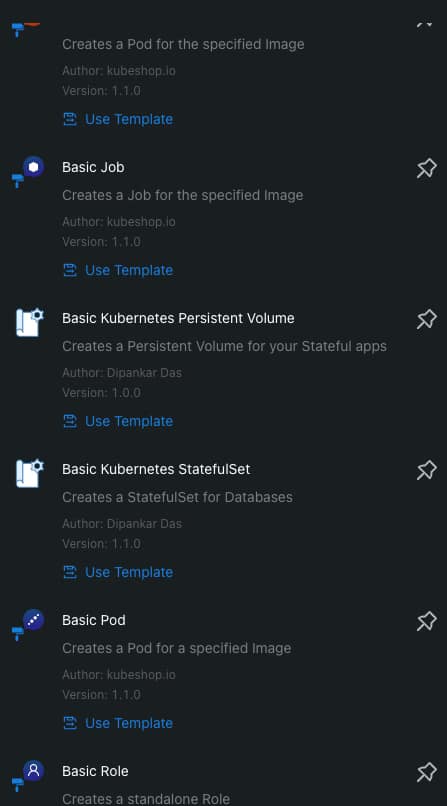
Monokle helps you in the following ways. First of all, present at the beginning of your work with a set of templates to create your Kubernetes YAML Manifests, as you can see in the picture below:
Write Kubernetes YAML Manifests More Efficiently: Tools, Templates, and Best Practices
Monokle Template Selection Dialog

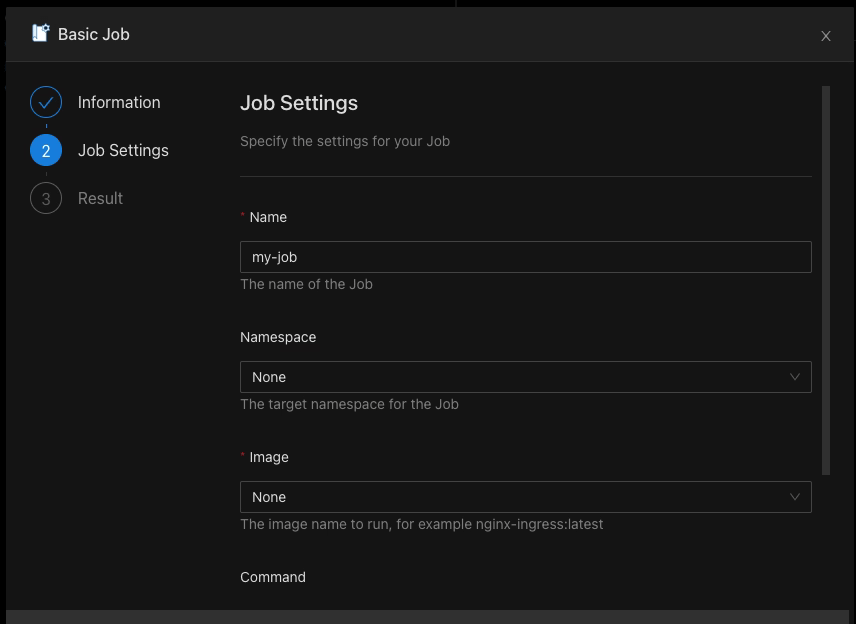
When you select a template, you can populate the required values graphically without needing to type YAML code yourself, as you can see in the picture below:
Write Kubernetes YAML Manifests More Efficiently: Tools, Templates, and Best Practices
Monokle Template Value Population Process

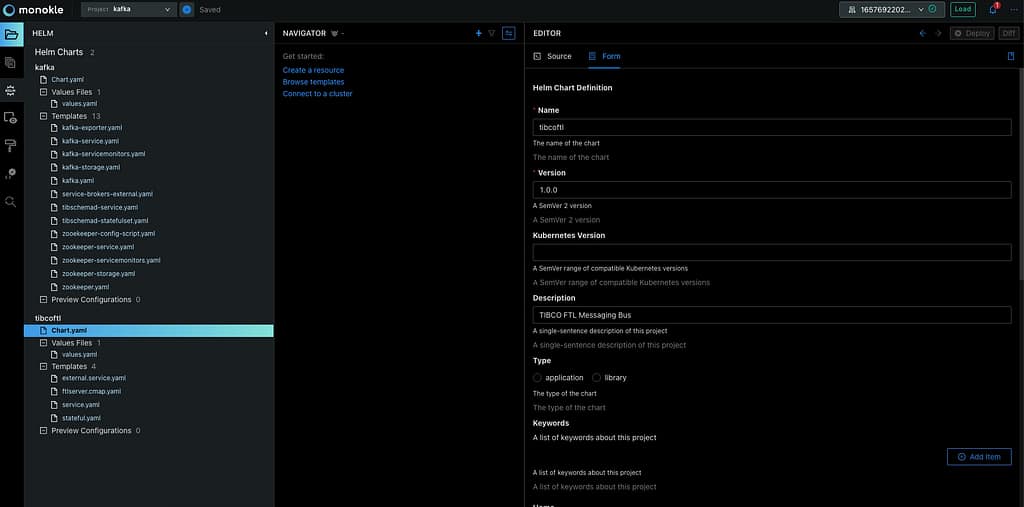
It also supports Helm Chart and Kustomize resource recognition so you will quickly see your charts, and you can edit them in a more fashion mode even graphically for some of the resources as well:
Write Kubernetes YAML Manifests More Efficiently: Tools, Templates, and Best Practices
Helm Chart Modification using Monokle

If allows good integration in several ways, first of all with OPA so it can validate all the rules and best-practice that you have defined and also you can connect to a running cluster to see the resources from there and also see the difference between them if exists to simplify the process and provide more agility on the Kubernetes YAML Manifest creation process

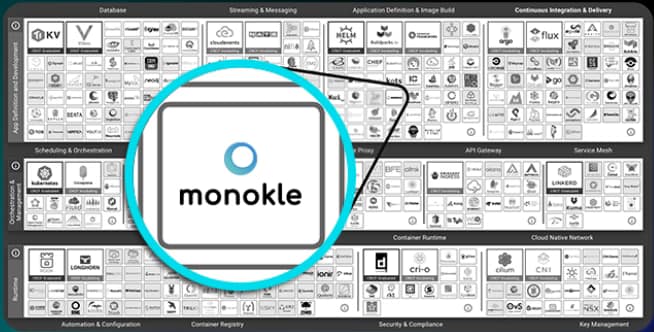
On top of all of that, Monokle is a certified component from the CNCF foundation, so you will be using a project that is backup from the same foundation is that takes care of Kubernetes itself, among other tasks:
Write Kubernetes YAML Manifests More Efficiently: Tools, Templates, and Best Practices
Monokle is part of the CNCF Foundation Landscape

If you want to download Monokle, give it a try and you can do it from its web page: https://monokle.kubeshop.io/ and I’m sure your performance writing Kubernetes YAML Manifest will thank you shortly!

📚 Want to dive deeper into Kubernetes? This article is part of our comprehensive Kubernetes Architecture Patterns guide, where you’ll find all fundamental and advanced concepts explained step by step.

How To Improve Your Kubernetes Workload Development Productivity

timelapse photo of highway during golden hour

Telepresence is the way to reduce the time between your lines of code and a cloud-native workload running.

timelapse photo of highway during golden hour
Photo by Joey Kyber on Unsplash

We all know how cloud-native workloads and Kubernetes have changed how we do things. There are a lot of benefits that come with the effect of containerization and orchestration platforms such as Kubernetes, and we have discussed a lot about it: scalability, self-healing, auto-discovery, resilience, and so on.

But some challenges have been raised, most of them on the operational aspect that we have a lot of projects focused on tackling, but usually, we forget about what the ambassador has defined as the “inner dev cycle.”

The “inner dev cycle” is the productive workflow that each developer follows when working on a new application, service, or component. This iterative flow is where we code, test what we’ve coded, and fix what is not working or improve what we already have.

This flow has existed since the beginning of time; it doesn’t matter if you were coding in C using STD Library or COBOL in the early 1980 or doing nodejs with the latest frameworks and libraries at your disposal.

We have seen movements towards making this inner cycle more effective, especially in front-end development. We have many options to see the last change we have done in code, just saving the file. But for the first time when the movement to a container-based platform, this flow makes devs less productive.

The main reason is that the number of tasks a dev needs to do has increased. Imagine this set of steps that we need to perform:

  • Build the app
  • Build the container image
  • Deploy the container image in Kubernetes

These actions are not as fast as testing your changes locally, making devs less productive than before, which is what the “telepresence” project is trying to solve.

Telepresence is an incubator project from the CNCF that has recently focused a lot of attention because it has included OOTB in the latest releases of the Docker Desktop component. Based on its own words, this is the definition of the telepresence project:

Telepresence is an open-source tool that lets developers code and test microservices locally against a remote Kubernetes cluster. Telepresence facilitates more efficient development workflows while relieving the need to worry about other service dependencies.

Ok, so let’s see how we can start? Let’s dive in together. The first thing we need to do is to install telepresence in our Kubernetes cluster:

Note: It is also a way to install telepresence using Helm in your cluster following these steps:

helm repo add datawire  https://app.getambassador.io
helm repo update
kubectl create namespace ambassador
helm install traffic-manager --namespace ambassador datawire/telepresence

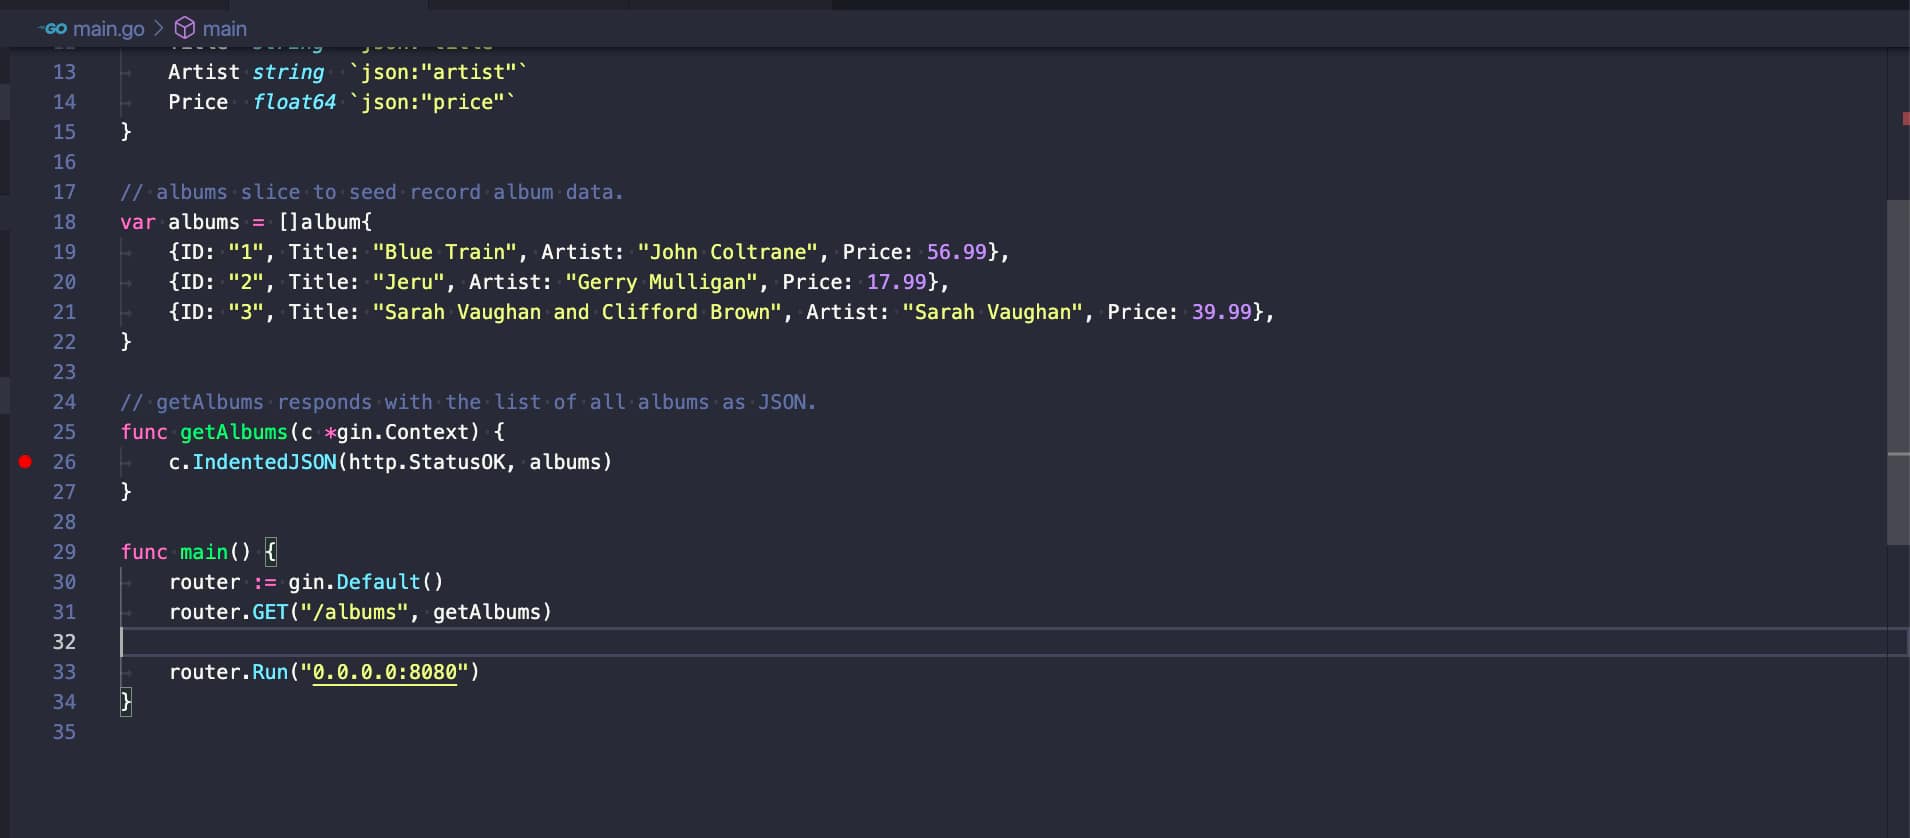
Now I will create a simple container that will host a Golang application that exposes a simple REST service and make it more accessible; I will follow the tutorial that is available below; you can do it as well.

Once we have our golang application ready, we are going to generate the container from it, using the following Dockerfile:

FROM golang:latest

RUN apt-get update
RUN apt-get upgrade -y

ENV GOBIN /go/bin

WORKDIR /app

COPY *.go ./
RUN go env -w GO111MODULE=off
RUN go get .
RUN go build -o /go-rest
EXPOSE 8080
CMD [ "/go-rest" ]

Then once we have the app, we’re going to upload to the Kubernetes server and run it as a deployment, as you can see in the picture below:

kubectl create deployment rest-service --image=quay.io/alexandrev/go-test  --port=8080
kubectl expose deploy/rest-service

Once we have that, it is the moment to start executing the telepresence, and we will start connecting to the cluster using the following command telepresence connect, and it will show an output like this one:

How To Improve Your Kubernetes Workload Development Productivity

Then we are going to list the endpoints available to intercept with the command telepresence listand we will see our rest-service that we have exposed before:

How To Improve Your Kubernetes Workload Development Productivity

Now, we will run the specific interceptor, but before that, we’re going to do the trick so we can connect it to our Visual Studio Code. We will generate a launch.json file in Visual Studio Code with the following content:

{
    // Use IntelliSense to learn about possible attributes.
    // Hover to view descriptions of existing attributes.
    // For more information, visit: https://go.microsoft.com/fwlink/?linkid=830387
    "version": "0.2.0",
    "configurations": [
        {
            "name": "Launch with env file",
            "type": "go",
            "request": "launch",
            "mode": "debug",
            "program": "1",
            "envFile": "NULL/go-debug.env"
           }
    ]
}

The interesting part here is the envFile argument that points to a non-existent file go-debug.env on the same folder, so we need to make sure that we generate that file when we do the interception. So we will use the following command:

telepresence intercept rest-service --port 8080:8080 --env-file /Users/avazquez/Data/Projects/GitHub/rest-golang/go-debug.env

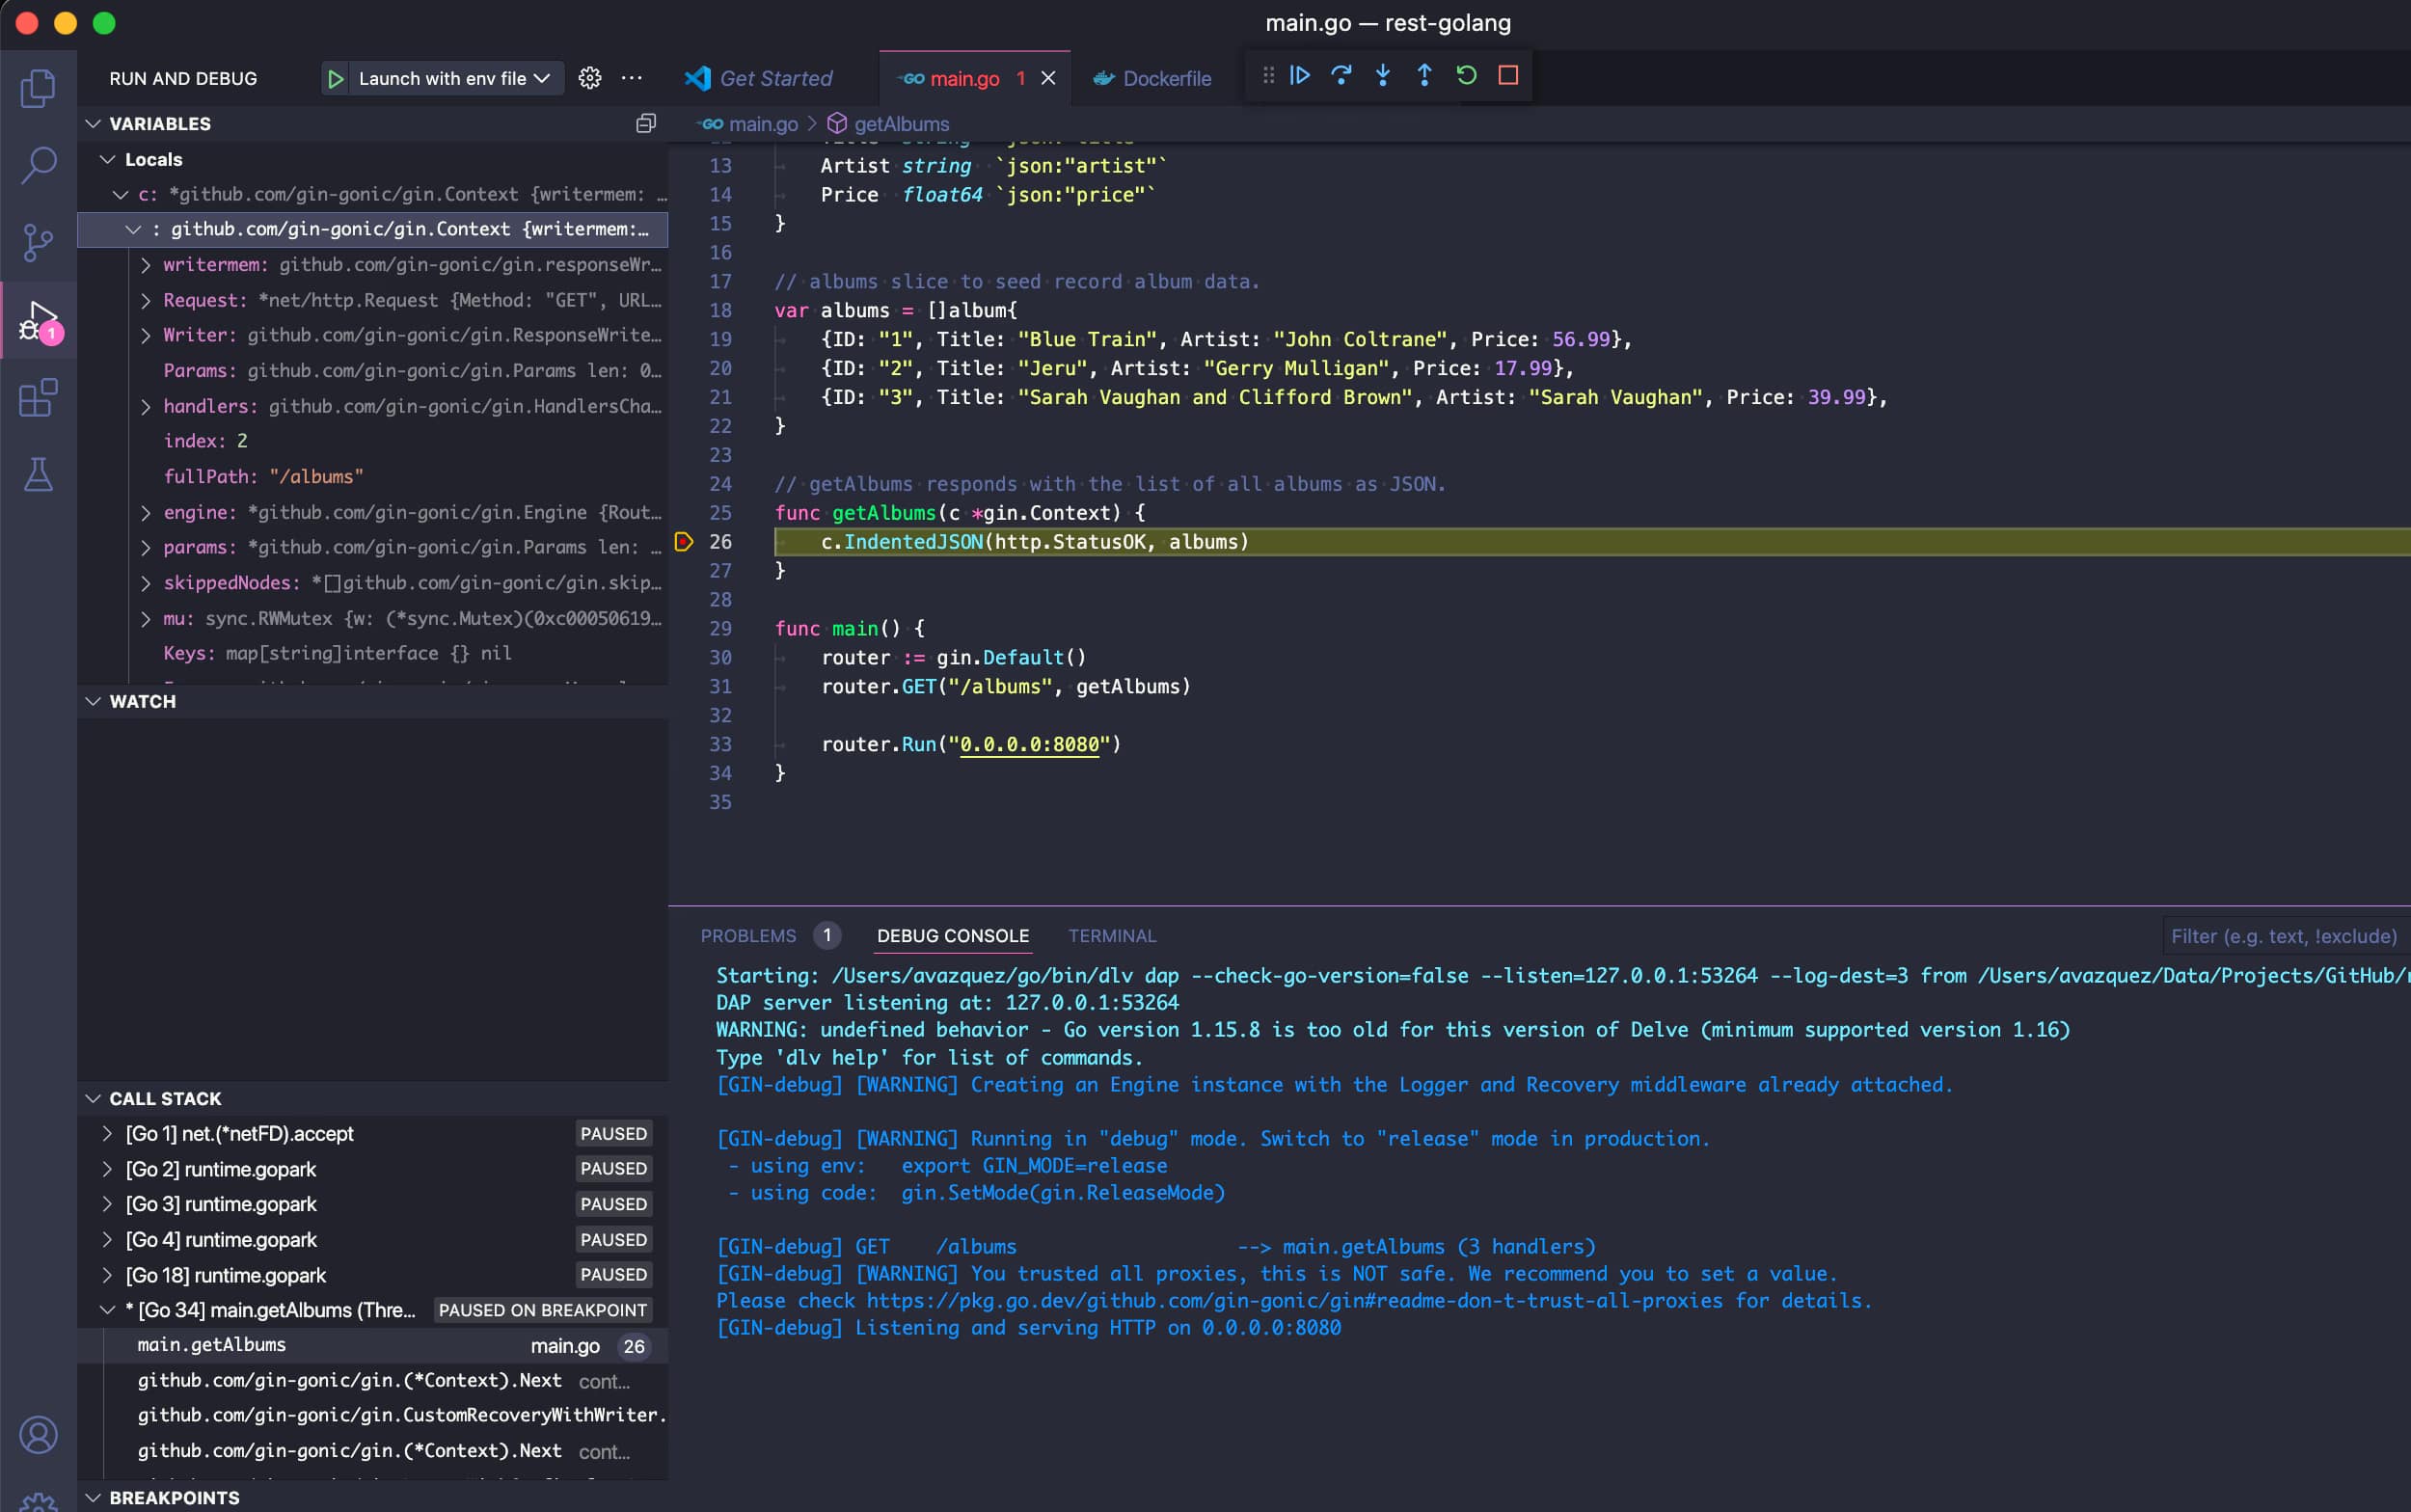
And now, we can start our debug session in Visual Studio code and maybe add a breakpoint and some lines, as you can see in the picture below:

How To Improve Your Kubernetes Workload Development Productivity

So, now, if we hit the pod in Kubernetes, we will see how the breakpoint is being reached as we were in a local debugging session.

How To Improve Your Kubernetes Workload Development Productivity

That means that we can inspect variables and everything, change the code, or do whatever we need to speed up our development!

📚 Want to dive deeper into Kubernetes? This article is part of our comprehensive Kubernetes Architecture Patterns guide, where you’ll find all fundamental and advanced concepts explained step by step.

Troubleshoot Network Connections in Kubernetes Workloads (Live Traffic Debugging)

blue UTP cord

Discover Mizu: Traffic Viewer for Kubernetes to ease this challenge and improve your daily work.

One of the most common things we have to do when testing and debugging our cloud-native workloads on Kubernetes is to check the network communication.

This article is part of my comprehensive TIBCO Integration Platform Guide where you can find more patterns and best practices for TIBCO integration platforms.

It could be to check the incoming traffic you are getting so we can inspect the requests we are receiving and see what we are replying to and similar kinds of use-cases. I am sure this sounds familiar to most of you.

I usually solve that using tcpdump on the container, similar to what I would do in a traditional environment, but this is not always easy. Depending on the environment and configuration, you cannot do so because you need to include a new package in your container image, do a new deployment, so it is available, etc.

So, to solve that and other similar problems, I discovered a tool named Mizu, which I would like to have found a few months ago because it would help me a lot. Mizu is precisely that. In its own words:

Mizu is a simple-yet-powerful API traffic viewer for Kubernetes, enabling you to view all API communication between microservices across multiple protocols to help you debug and troubleshoot regressions.

To install, it is pretty straightforward. You need to grab the binary and provide the correct permission on your computer. You have a different binary for each architecture, and in my case (Mac Intel-based), these are the commands that I executed:

curl -Lo mizu github.com/up9inc/mizu/releases/latest/download/mizu_darwin_amd64 && chmod 755 mizu && mv mizu /usr/local/bin

And that’s it, then you have a binary in your laptop that connects to your Kubernetes cluster using Kubernetes API, so you need to have configured the proper context.

In my case, I have deployed a simple nginx server using the command:

 kubectl run simple-app --image=nginx --port 80

And once that the component has been deployed, as it is shown in the Lens screenshot below:

I ran the command to launch mizu from my laptop:

mizu tap

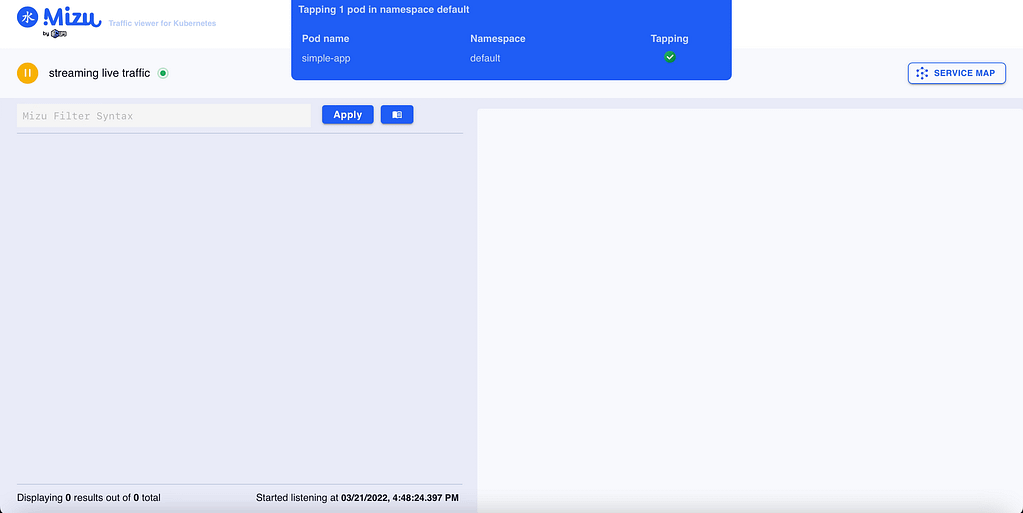
And after a few seconds, I have in front of me a webpage opened monitoring all traffic happening in this pod:

Troubleshoot Network Connections in Kubernetes Workloads (Live Traffic Debugging)

I have made the nginx port expose using the kubectl expose command:

 kubectl expose pod/simple-app

And after that, I deployed a temporary pod using the curl image to start sending some requests with the command shown below:

 kubectl run -it --rm --image=curlimages/curl curly -- sh

now I’ve started to send some requests to my nginx pod using curl:

 curl -vvv http://simple-app:80 

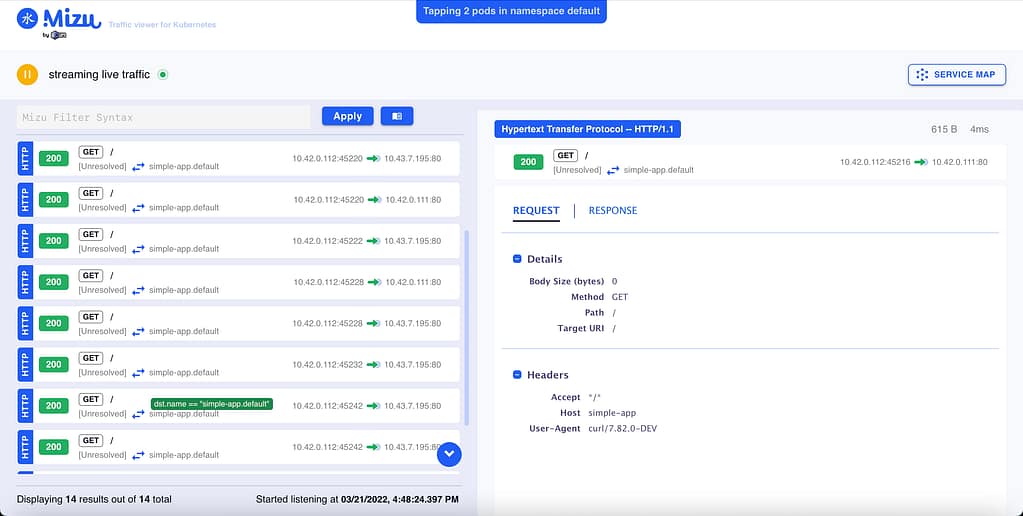
And after a few calls, I could see a lot of information in front of me. First of all, I can see the requests I was sending with all the details of it:

Troubleshoot Network Connections in Kubernetes Workloads (Live Traffic Debugging)

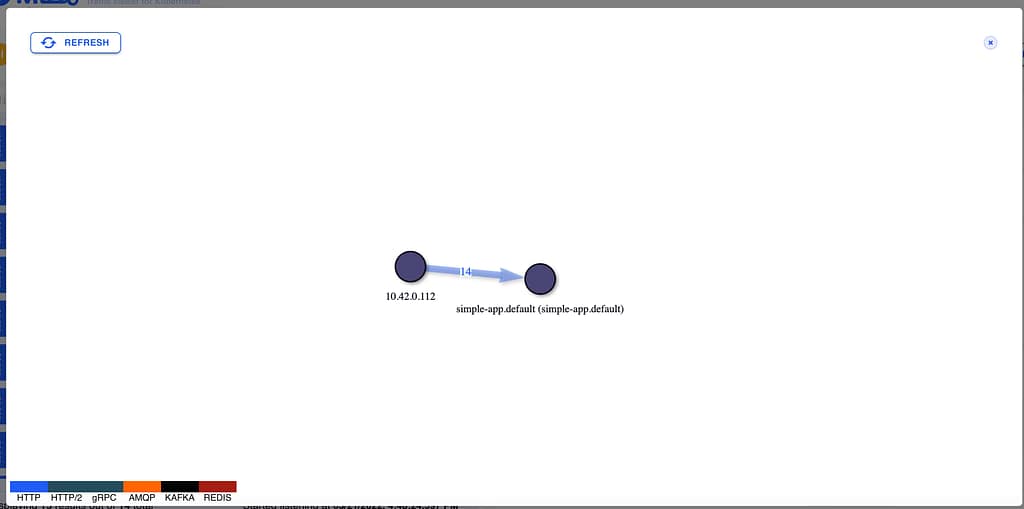
But even more important, I can see a service map diagram showing the dependencies and the calls graphically happening to the pod with the response time and also the protocol usage:

Troubleshoot Network Connections in Kubernetes Workloads (Live Traffic Debugging)

This will not certainly replace a complete observability solution on top of a service mesh. Still, it will be a beneficial tool to add to your toolchain when you need to debug a specific communication between components or similar kinds of scenarios. As commented, it is like a high-level tcpdump for pod communication.

📚 Want to dive deeper into Kubernetes? This article is part of our comprehensive Kubernetes Architecture Patterns guide, where you’ll find all fundamental and advanced concepts explained step by step.

Maid: The Ultimate Open-Source Automated File Organizer for Hackers

Maid: The Ultimate Open-Source Automated File Organizer for Hackers

Maid provides the best of both worlds: Ease of use and flexibility that comes with a code-based interface.

One of the main problems that I have because of my routine practices using computers is the lack of organizational discipline. To me is quite complex to have all the different files organized in the right place all the time, and I finally decided to stop fighting against it.

This is something that had happened to me since the beginning of my use of computers but got worse when I started working in the industry more than ten years ago.

I have colleagues with a solid organization process from mail received (using the well-known Louts or Outlook folders) to the documents they received or produced for the different topics and accounts using specific folder organization.

To me, everything is dropped in some folder, such as Downloads, Desktop, or a similar folder, and I hope to find everything around there. For emails, I have solved this problem because the search capabilities from Gmail are so powerful that they can recover any email in seconds, but finding and arranging my files is much more complex.

Because of that, I have been looking for a tool to do all this work for me because I know I cannot do it. I can try it… I can do it one day or maybe two, but this is a habit I cannot hold for a long period of time.

So, in this search of options, I have tried a lot of things because, in this time, I also have changed a lot from operating systems, so I managed to try Hazel, FileJuggle, Drop, and so on. But no one of them provided the flexibility and the simplicity that I needed at the same time. And over and over I come back to my old friend maid

Maid is a project created by Ben Oakes that he defines in its own words like a Hazel for Hackers, and that’s true. So it provides the same capabilities as Hazel but in a way that is much more flexible for people that have a programming background.

Maid: The Ultimate Open-Source Automated File Organizer for Hackers
Sample rule from maid to move pdf files from Downloads to the Books folder

Based on Ruby On Rails, in the end, your duty is as easy as defining the rules you want to apply using this language. But to make it easier and because it is not needed to be a Ruby expert to be able to use the tools, Ben has already developed a lot of helper functions to simplify the creation of these rules.

Helper functions like weeks.accessed, downloaded_from, image_px, and at the same time the common actions like move, trash, or copy.

So, in the end, it is like you code your rules using a very high-level language, like when you are using a GUI in other programs like Hazel. Still, at the same time as this is code, you also have all the flexibility and power at your disposal to be used when you need it.

To install the tools is as easy as just typing the following commands:

gem install maid
maid sample 

And after that, you will have a sample rules file in your .maid folder to help you create the initial set of rules. And after that point, you are only limited by your needs and your imagination to finally handle this file madness that, at least, myself, I have been for a long time into.

Best Kubernetes Management Tools: Dashboard, CLI, and GUI Options Compared

Best Kubernetes Management Tools: Dashboard, CLI, and GUI Options Compared

Maximizing the productivity of working with Kubernetes Environment with a tool for each persona

We all know that Kubernetes is the default environment for all our new applications we developed we will build. The flavor of that Kubernetes platform can be of different ways and forms, but one thing is clear, it is complex.

The reasons behind this complexity is being able to provide all the flexibility but it is also true that the k8s project never has put much effort to provide a simple way to manage your clusters and kubectl is the point of access to send commands leaving this door open to the community to provide its own solution and these are the things that we are going to discuss today.

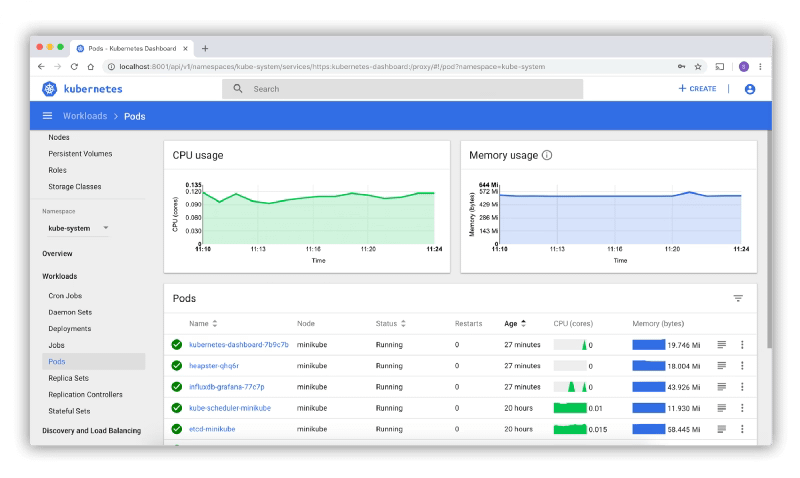
Kubernetes Dashboard: The Default Option

Kubernetes Dashboard is the default option for most of the installations. It is a web-based interface that is part of the K8s project but not deployed by default when you install the cluster

Best Kubernetes Management Tools: Dashboard, CLI, and GUI Options Compared

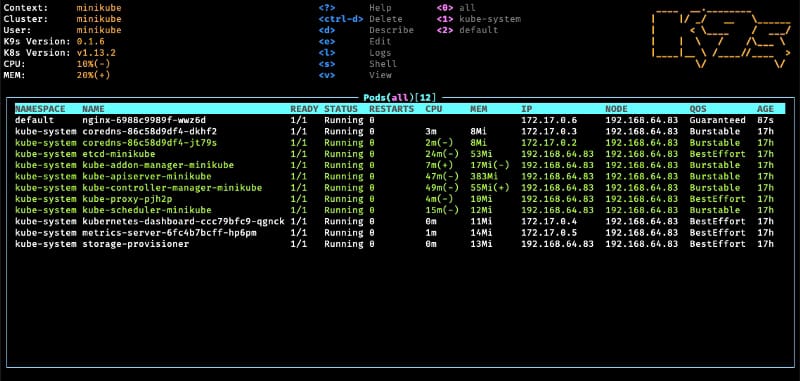
K9S: The CLI option

K9S is one of the most common options for the ones that love a very powerful command-line interface with a lot of options at your disposal

Best Kubernetes Management Tools: Dashboard, CLI, and GUI Options Compared

It is a mix between all the power of a command-line interface with all the keyboard options at your disposals with a very fancy graphical view to have a quick overview of the status of your cluster at glance.

Lens — The Graphical Option

The lens is a very vitaminized GUI option that goes beyond that just showing the status of the K8S cluster or allowing modifications on the components. With integration with other projects such as Helm or support for the CRD. It provides a very pleasant experience of managing clusters with multi-cluster support as well. To know more about Lens you can take a look at this article that we cover its main features:

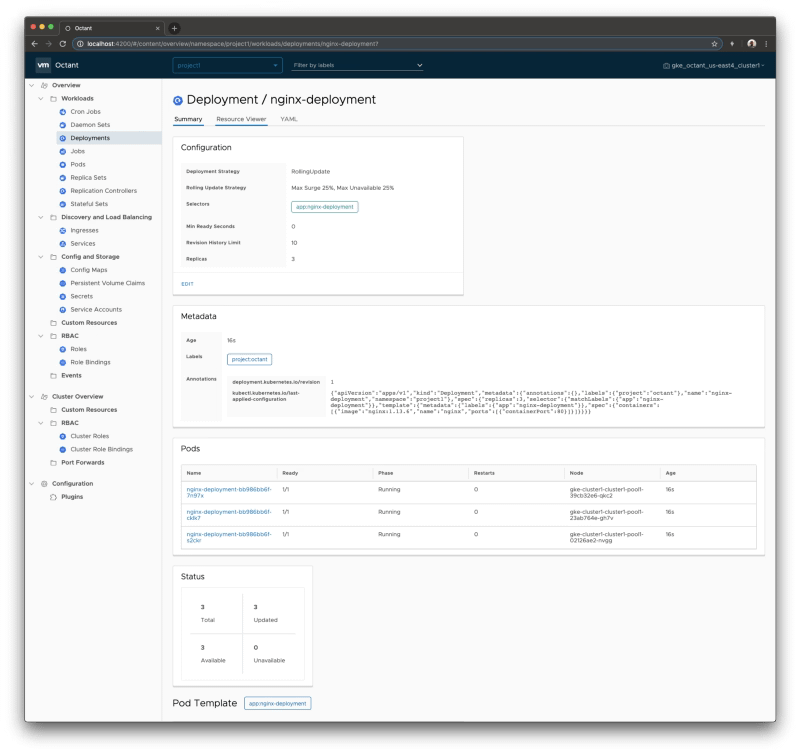
Octant — The Web Option

Octant provides an improved experience compared with the default web option discussed in this article using the Kubernetes dashboard. Built for extension with a plug-in system that allows you to extend or customize the behavior of octant to maximize your productivity managing K8S clusters. Including CRD support and graphical visualization of dependencies provides an awesome experience.

Best Kubernetes Management Tools: Dashboard, CLI, and GUI Options Compared

Summary

The have provided in this article different tools that will help you during the important task to manage or inspect your Kubernetes cluster. Each of them with its own characteristics and each of them focuses on different ways to provide the information (CLI, GUI and Web) so you can always find one that works best for your situation and preferences.

📚 Want to dive deeper into Kubernetes? This article is part of our comprehensive Kubernetes Architecture Patterns guide, where you’ll find all fundamental and advanced concepts explained step by step.

3 Unusual Developer Tools That Seriously Boost Productivity (Beyond VS Code)

3 Unusual Developer Tools That Seriously Boost Productivity (Beyond VS Code)

A non-VS Code list for software engineers

This is not going to be one of those articles about tools that can help you develop code faster. If you’re interested in that, you can check out my previous articles regarding VS Code extensions, linters, and other tools that make your life as a developer easier.

My job is not only about software development but also about solving issues that my customers have. While their issues can be code-related, they can be an operation error or even a design problem.

I usually tend to define my role as a lone ranger. I go out there without knowing what I will face, and I need to be ready to adapt, solve the problem, and make customers happy. This experience has helped me to develop a toolchain that is important for doing that job.

Let’s dive in!


1. MobaXterm

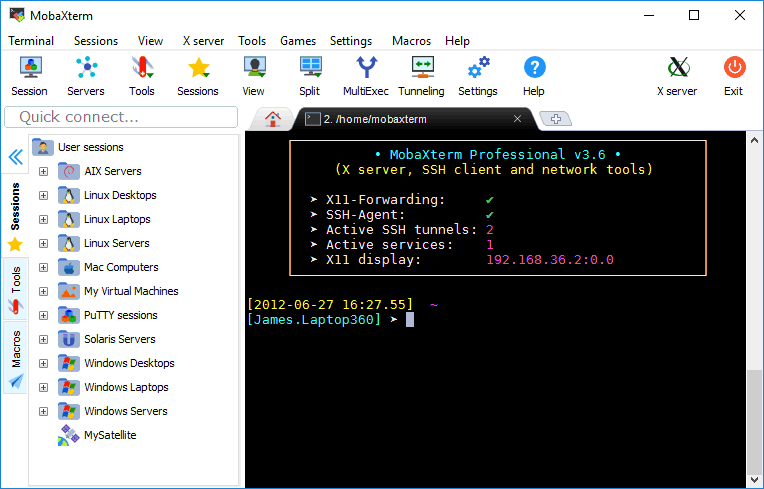
This is the best tool to manage different connections to different servers (SSH access for a Linux server, RDP for a Windows server, etc.). Here are some of its key features:

  • Graphical SSH port-forwarding for those cases when you need to connect to a server you don’t have direct access to.
  • Easy identity management to save the passwords for the different servers. You can organize them hierarchically for ease of access, especially when you need to access so many servers for different environments and even different customers.
  • SFTP automatic connection when you connect to an SSH server. It lets you download and upload files as easily as dropping files there.
  • Automatical X11 forwarding so you can launch graphical applications from your Linux servers without needing to configure anything or use other XServers like XMing.
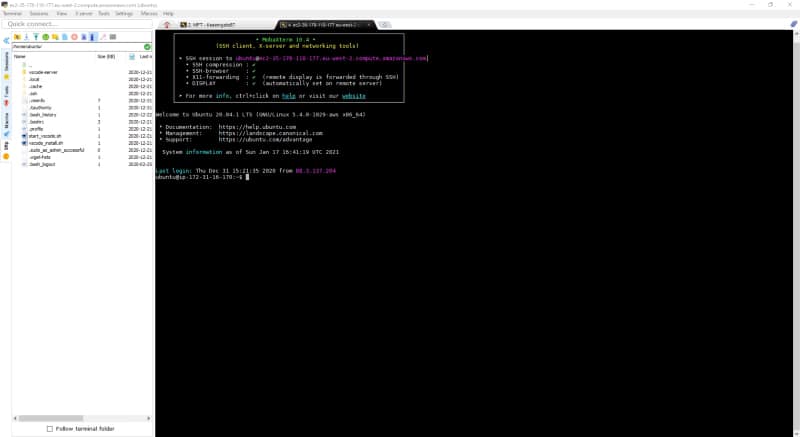
MobaXterm in action
MobaXterm in action

2. Beyond Compare

There are so many tools to compare files, and I think I have used all of them — from standalone applications like WinMerge, Meld, Araxis, KDiff, and others to extensions for text editors like VS Code and Notepad++.

However, none of those can compare to the one and only Beyond Compare.

I covered Beyond Compare when I started working on software engineering in 2010, and it is a tool that comes with me on each project I have. I use it every day. So, what makes this tool different from the rest?

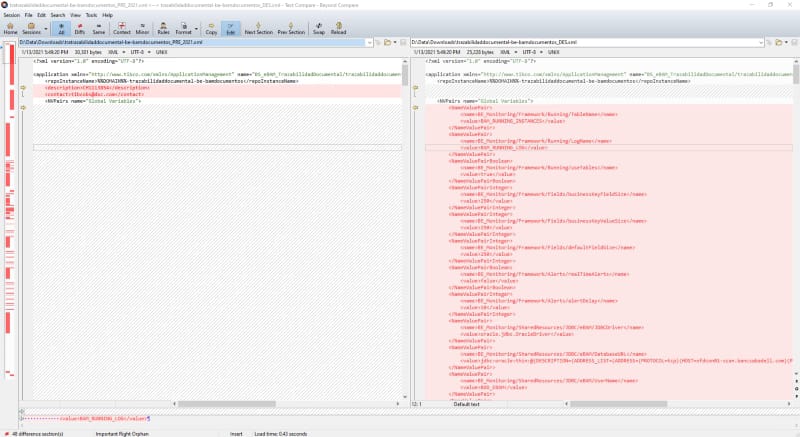
It is simply the best tool to make any comparison because it does not just compare text and folders. It does that perfectly, but at the same time, it also compares ZIP files while browsing the content, JAR files, and so on. This is very important when we’d like to check if two JAR files that are uploaded in DEV and PROD are the same version of the tool or to know if a ZIP file has the right content when it is uploaded.

Beyond Compare in action
Beyond Compare 4

3. Vi Editor

This is the most important one — the best text editor of all time — and it is available pretty much on every server.

It is a command-line text editor with a huge number of shortcuts that allows you to be very productive when you are inside a server checking logs and configuration files to see where the problem is.

For a long time, I have had a Vi cheat sheet printed out to make sure I can master the most important shortcuts and thus increase my productivity while fighting inside the enemy lines (the customer’s servers).

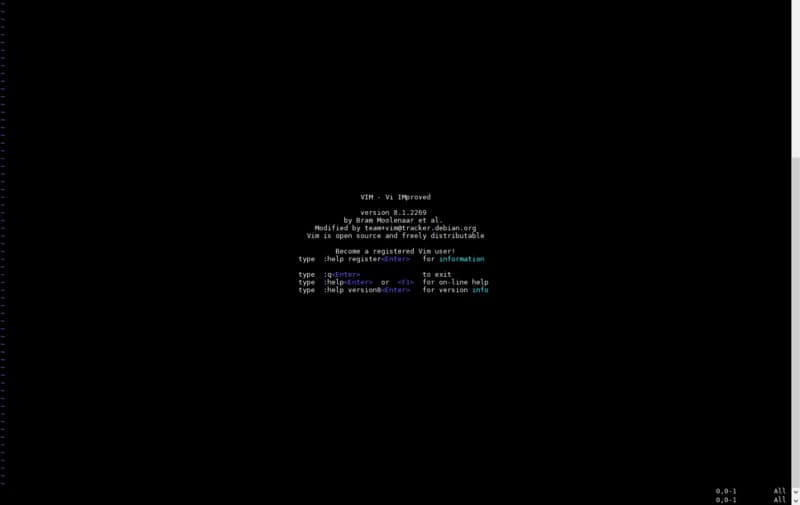
Vi text editor
VIM — Vi improved the ultimate text editor.

4 Reasons Low-Code Applications Boost Developer Productivity and Business Agility

4 Reasons Low-Code Applications Boost Developer Productivity and Business Agility

How truly achieve agility on your organization focusing on what matters to your business and multiply the productivity of your development team

Fashion is cyclical and the same thing happens in Software Engineering. We live in a world where each innovation seems similar to one in the past; we advanced some time ago. That’s because what we’re doing is just refining over and over solutions for the same problems.

We’ve lived for the last years a “developer is the new black” rise, where anything related to writing code is excellent. Even devs are now observed as a cool character like the ones from Silicon Valley (the HBO show) instead of the one you can make fun of like in The I.T Crowd.

But, now, it seems we’re going back to a new rise of what is called Low-Code (or No Code) Applications.

Low-Code Application is a piece of software that helps you generate your applications or services without needing to write code in any programming language, instead of doing that, you can drag & drop some boxes that represent what you’d like to do instead of write it yourself.

That has provided advantages that are now again on the table. Let’s take a look at those advantages in more detail

1.- Provides more agility

That’s clear. No matter how high level your programming language is, no matter how many archetypes you have to generate your project skeleton or the framework and libraries that you use. Typing is always slower than drag some boxes into the white canvas and connects them with some links.

And I’m a person that is a terminal guy and VI power-user, and I realize the power of the keyboard, But let’s be honest and ask you one question:

How many of the keywords you type in your code are providing value to the business and how many are just needed for technical reasons?

Not only things like exception handling, auditing, logging, service discovery, configuration management, but stuff like loop structure, function signature definition, variable definition, class definition, and so on…

You can truly focus on the business value that you’re trying to provide to your business instead of spending time around how to manage any technical capabilities.

2.- Easier to maintain

One month after production only the developer and god knows what the code does. After a year, just god knows…

Coding is awesome but it is at the same time complex to maintain. Mainly on enterprises when developers are shifting from one project to the other, from some departments to others, and new people are being onboarded all the time to maintain and evolve some codes.

And the ones that have been in the industry for some time, know for example the situation when people said: “I prefer not to touch that because we don’t know what’s doing”, “We cannot migrate this Mainframe application because we don’t know it will be able to capture all the functionality they’re providing.”

And that’s bad for several reasons. First of all, it is costly to maintain, more complex to do it, but second is also avoiding you to evolve at the pace that you want to do it.

3.- Safer and Cost-Effective

Don’t get me wrong about this: Programming can be as safer as any low-code application. That’s clear because, in the end, any low-code app ends up generating the same binary or bytecode to be executed.

The problem is that this is going to depend on the skills of the programmer. We live in a situation that, even programming and developers are a cool thing, as you need a big number of devs in your team that implies that not all of them are as experienced and skill as you want them to be.

Reality is much more complex and also you need to deal with your budget reality and find the way to get the best of your team.

Using Low-code application, you are guaranteed the quality of the base components that are verified by a company and that they’ve improved with dedicated teams incorporating feedback for customers all over the world, which makes it safer.

4.- As ready as a code-base solution for specific needs

One of the myths that are saying against Low Code is that it is suitable for generic workloads and use-cases, but it is not capable of being adapted and optimized for your needs.

Regarding this usual push-back, first of all, we need to work on the misconception of the level of specification our software needs. In the end, the times when you need to do something so specific that is not covered by the options available out of the box are so low that it is complex to justify. Are you going to make a slower 99% of your development only to be able to do it quicker than 1%? How much of your workloads are not similar to what other companies are doing in the same industry?

But even for the sake of the discussion, let’s assume that’s true, and you need a single piece of logic a low-code application doesn’t provide out of the box. Ok, Low-Code means that you don’t need to write code, not that you cannot do it.

Most of the platforms support the option to add code if needed as an option to cover these cases. So, even in those cases, you still have the same tools to make it specific without losing all the advantages of your daily activities.

Summary

Low-code applications are one of the solutions you have at your disposal to improve your agility and your productivity in your developments to meet the pace of the changes in your business.

The solutions working on that space are not new, but they’ve been renovated to adapt to the modern developer paradigms (microservices, container-based, API-led, event-driven…) so you’re not going to miss anything but to get more time to provide even more value to your business.