Introducing XSLTPlayground.com — The Modern Way to Test, Optimize, and Debug XSLT in Real Time

Working with XSLT in modern data pipelines and XML-driven systems has always been powerful… but not always easy. Tools are often heavyweight, outdated, or require local setup and complex environments. That’s why I’m thrilled to announce the launch of XSLTPlayground.com — a free, open-source, browser-based XSLT editor designed specifically for real-world use cases.

No installations. No complexity. Just open your browser and transform.

🚀 Why XSLT Playground?

🔁 Real-time XSLT Transformations for Real-World Scenarios

Unlike legacy tools or limited web demos, XSLT Playground supports complex transformations involving multiple XML sources, parameterized templates, and real feedback. Whether you work on data integration, API gateways, XML-based reporting, or legacy system upgrades, this tool helps you test and iterate quickly.

🧩 Multi-Input Parameter Support

One of the biggest pain points in XSLT testing is simulating real environments. With XSLTPlayground.com, you can define multiple input sources (e.g., data feeds, configuration, or metadata), and pass them into your XSLT in a synchronized way — just like a production data pipeline.

⚙️ Automatic Parameter Synchronization

When you load a stylesheet with required parameters, the Playground automatically detects them and creates input fields for you on the side. All you need to do is fill in the values. This smart feature removes the guesswork and helps avoid runtime errors.

⚡ Performance & Optimization Insights

Need to know if your optimization is working? We display execution time for each transformation, helping you compare versions and choose the faster approach — all without deploying full systems or instrumenting code. While it’s not a benchmarking tool, the feedback is invaluable for real-time tuning.

🌐 100% Free, Web-based, and Open Source

No need to install bulky tools like Oxygen XML or run Eclipse plugins just to test a stylesheet. XSLTPlayground.com is entirely web-based, free, and built to be open and extensible. Want to contribute or host your own version? The source is on GitHub.

🖱️ Drag & Drop Support

Upload your XML or XSLT files by simply dragging them into the browser. All components — inputs, stylesheets, outputs — support drag and drop for faster iteration.

🎨 Pretty Print and Export Options

Your output is automatically pretty-printed for readability, and with just one click you can download your XSLT and transformation result, making it easy to share, archive, or import into larger projects.

🔗 Try it now: https://xsltplayground.com

Whether you’re a developer, data engineer, or working with legacy systems, this is the tool you’ve been waiting for. Say goodbye to the complexity of setting up XSLT tests and say hello to instant transformations — anywhere, anytime.

Want to contribute or follow development? Star the project on GitHub or send feedback directly from the site.

Increasing HTTP Logs in TIBCO BusinessWorks in 5 Minutes

Increasing the HTTP logs in TIBCO BusinessWorks when you are debugging or troubleshooting an HTTP-based integration that could be related to a REST or SOAP service is one of the most used and helpful things you can do when developing with TIBCO BusinessWorks.

The primary purpose of increasing the HTTP logs is to get complete knowledge about what information you are sending and which communication you are receiving from your partner communicator to help understand an error or unexpected behavior.

What are the primary use cases for increasing the HTTP logs?

In the end, all the different use cases are variations of the primary use case: “Get full knowledge about the HTTP exchange communication between both parties.” Still, some more detailed ones can be listed below:

  • Understand why a backend server is rejecting a call that could be related to Authentication or Authorization, and you need to see the detailed response by the backend server.
  • Verify the value of each HTTP Header you are sending that could affect the communication’s compression or accepted content type.
  • See why you’re rejecting a call from a consumer

Splitting the communication based on the source

The most important thing to understand is that the logs usually depend on the library you are using, and it is not the same library used to expose an HTTP-based Server as the library you use to consume an HTTP-based service such as REST or a SOAP service.

Starting from what you expose, this is the easiest thing because this will be defined by the HTTP Connector resources you’re using, as you can see in the picture below:

HTTP Shared Resources Connector in BW

All HTTP Connector Resources that you can use to expose REST and SOAP services are based on the Jetty Service implementation, and that means that the loggers that you need to change their configuration are related to the Jetty server itself.

More complex, in theory, are the ones related to the client communication when our TIBCO BusinessWorks application consumes an HTTP-based service provided by a backend because each of these communications has its own HTTP Client Shared Resources. The configuration of each of them will be different because one of the settings we can get here is the Implementation Library, and that will have a direct effect on the way to change the log configuration:

HTTP Client Resource in BW that shows the different implementation libraries to detect the logger to Increasing HTTP Logs in TIBCO BusinessWorks

You have three options when you define an HTTP Client Resource, as you can see in the picture above:

  • Apache HttpComponents: The default one supports HTTP1, SOAP and REST services.
  • Jetty HTTP Client: This client only supports HTTP flows such as HTTP1 and HTTP2, and it would be the primary option when you’re working with HTTP2 flows.
  • Apache Commons: Similar to the first one, but this is currently deprecated, and to be honest, if you have some client component using this configuration, you should change it when you can to the Apache HttpComponents.

So, if we’re consuming a SOAP and REST service, it is clear that we will be using the implementation library Apache HttpComponents, and that will give us the logger we need to use.

Because for Apache HttpComponents, we can rely on the following logger: “org.apache.http” and in case we want to extend the server side, or we’re using Jetty HTTP client, we can use this one: “org.eclipse.jetty.http”

We need to be aware that we cannot extend it just for a single HTTP Client resource because the configuration will be based on the Implementation Library, so in case we set the DEBUG level for the Apache HttpComponents library, it will affect all Shared Resources using this implementation Library, and you’ll need to differentiate based on the data inside the log so that will be part of your data analysis.

How to set HTTP Logs in TIBCO BusinessWorks?

Now that we have the loggers, we must set it to a DEBUG (or TRACE) level. We need to know how to do it, and we have several options depending on how we would like to do it and what access we have. The scope of this article is TIBCO BusinessWorks Container Edition, but you can easily extrapolate part of this knowledge to an on-premises TIBCO BusinessWorks installation.

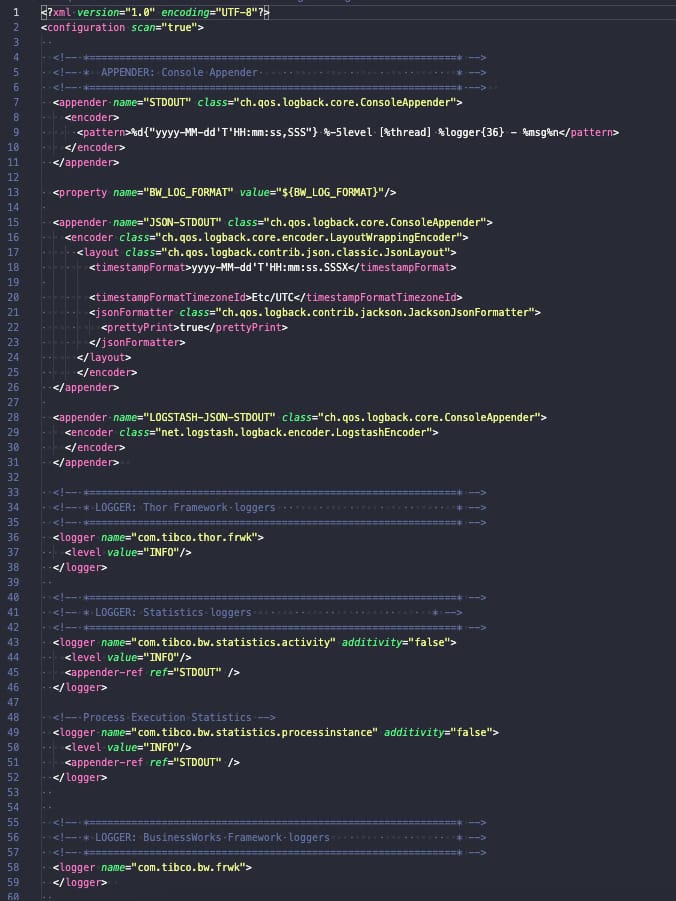
TIBCO BusinessWorks (container or not) relies on its logging capabilities in the log back library, and this library is configured using a file named logback.xml that could have the configuration that you need, as you can see in the picture below:

logback.xml configuration with the default structure in TIBCO BW

So if we want to add a new logging configuration, we need to add a new element loggerto the file with the following structure:

  <logger name="%LOGGER_WE_WANT_TO_SEE">
    <level value="%LEVEL_WE_WANT_TO_SEE%"/>
  </logger>    

So, the logger was precise based on the previous section, and the level will depend on how much info you want to see. The log Levels are the following ones: ERROR, WARN, INFO, DEBUG, TRACE. DEBUG and TRACE are the ones that show more information.

In our case, DEBUG should be enough to get the full HTTP Request and HTTP Response, but you can also apply it to other things where you could need a different log level.

Now you need to add that to the logback.xml file, and to do that, you have several options, as commented:

  • You can find the logback.xml inside the BWCE container (or the AppNode configuration folder) and modify its content. The default location of this file is this one: /tmp/tibco.home/bwce/<VERSION>/config/logback.xml To do this, you will need to have access to do a kubectl exec on the bwce container, and if you do the change, the change will be temporary and lost in the next restart. That could be something good or bad, depending on your goal.
  • If you want to have it permanent or don’t have access to the container, you have two options. The first one is to include a custom copy of the logback.xml in the /resources/custom-logback/ folder in the BWCE base image and set the environment variable CUSTOM_LOGBACK to TRUE value, and that will override the default logback.xml configuration with the content of this file. As commented, this will be “permanent” and will apply since the first deployment of the app with this configuration. You can find more info the official doc here.
  • There is also an additional one since BWCE 2.7.0 and above that allows you to change the logback.xml content without a new copy or changing the base image, and that’s based on the usage of the environment property BW_LOGGER_OVERRIDES with the content in the following way (logger=value) so in our case it would be something like this org.apache.http=DEBUG and in the next deployment you will get this configuration. Similar to the previous one, this will be permanent but doesn’t require adding a file to the base image to be achievable.

So, as you can see, you have different options depending on your needs and access levels.

Conclusion

In conclusion, enhancing HTTP logs within TIBCO BusinessWorks during debugging and troubleshooting is a vital strategy. Elevating log levels provides a comprehensive grasp of information exchange, aiding in analyzing errors and unexpected behaviors. Whether discerning backend rejection causes, scrutinizing HTTP header effects, or isolating consumer call rejections, amplified logs illuminate complex integration scenarios. Adaptations vary based on library usage, encompassing server exposure and service consumption. Configuration through the logback library involves tailored logger and level adjustments. This practice empowers developers to unravel integration intricacies efficiently, ensuring robust and seamless HTTP-based interactions across systems.


How To Create a ReadOnlyFileSystem Image for TIBCO BWCE

This article will cover how to enhance the security of your TIBCO BWCE images by creating a ReadOnlyFileSystem Image for TIBCO BWCE. In previous articles, we have commented on the benefits that this kind of image provides several advantages in terms of security, focusing on aspects such as reducing the attack surface by limiting the kind of things any user can do, even if they gain access to running containers.

The same applies in case any malware your image can have will have limited the possible actions they can do without any write access to most of the container.

How ReadOnlyFileSystem affects a TIBCO BWCE image?

This has a clear impact as the TIBCO BWCE image is an image that needs to write in several folders as part of the expected behavior of the application. That’s mandatory and non-dependent on the scripts you used to build your image.

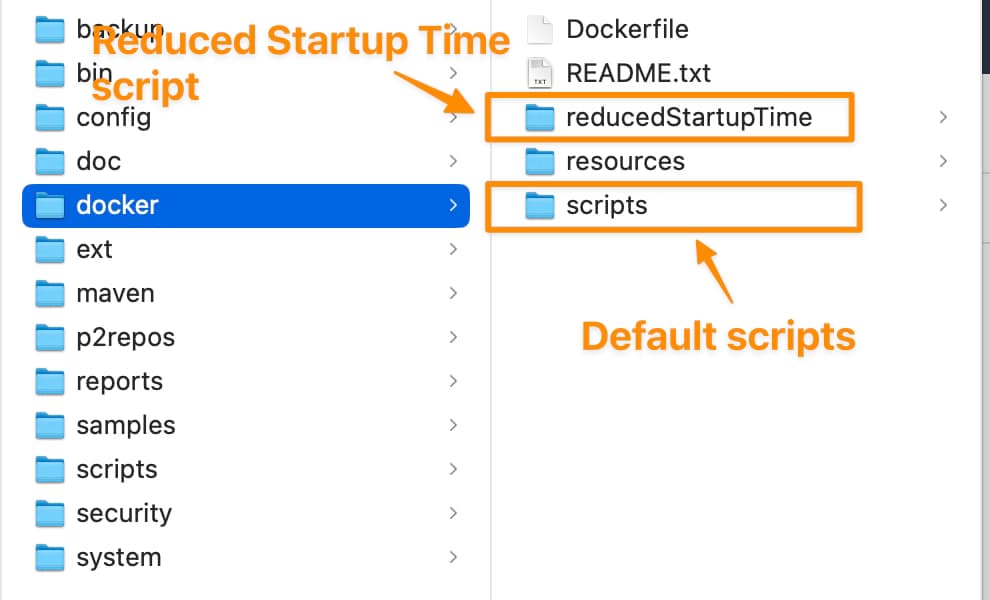
As you probably know, TIBCO BWCE ships two sets of scripts to build the Docker base image: the main ones and the ones included in the folder reducedStartupTime, as you can see in the GitHub page but also inside your docker folder in the TIBCO-HOME after the installation as you can see in the picture below.

The main difference between them is where the unzip of the bwce-runtime is made. In the case of the default script, the unzip is done in the startup process of the image, and in the reducedStartupTime this is done in the building of the image itself. So, you can start thinking that the default ones need some writing access as they need to unzip the file inside the container, and that’s true.

But also, the reduced startupTime requires writing access to run the application; several activities are done regarding unzipping the EAR file, managing the properties file, and additional internal activities. So, no matter what kind of scripts you’re using, you must provide a write-access folder to do this activity.

By default, all these activities are limited to a single folder. If you keep everything by default, this is the /tmp folder, so you must provide a volume for that folder.

How to deploy a TIBCO BWCE application with the

Now, that is clear that you need a volume for the /tmp folder, and now you need to define the kind of volume that you want to use for this one. As you know, there are several kinds of volumes that you can determine depending on the requirements that you have.

In this case, the only requirement is to write access, but there is no need regarding storage and persistency, so, in that case, we can use an emptyDir mode. emptyDir content, which is erased when a pod is removed, is similar to the default behavior but allows writing permission on its content.

To show how the YAML would like, we will use the default one that we have available in the documentation here:

apiVersion: v1
kind: Pod
metadata:
  name: bookstore-demo
  labels:
    app: bookstore-demo
spec:
  containers:
  - name: bookstore-demo
    image: bookstore-demo:2.4.4
    imagePullPolicy: Never
    envFrom:
    - configMapRef:
      name: name 

So, we will change that to include the volume, as you can see here:

apiVersion: v1
kind: Pod
metadata:
  name: bookstore-demo
  labels:
    app: bookstore-demo
spec:
  containers:
  - name: bookstore-demo
    image: bookstore-demo:2.4.4
    imagePullPolicy: Never
	securityContext:
		readOnlyRootFilesystem: true
    envFrom:
    - configMapRef:
      name: name
    volumeMounts:
    - name: tmp
      mountPath: /tmp
  volumes:
  - name: tmp
    emptyDir: {}

The changes are the following:

  • Include the volumes section with a single volume definition with the name of tmp with an emptyDirdefinition.
  • Include a volumeMountssection for the tmpvolume that is mounted in the /tmp path to allow to write on that specific path to enable also the unzip of the bwce-runtime as well as all the additional activities that are required.
  • To trigger this behavior, include the readOnlyRootFilesystem flag in the securityContext section.

Conclusion

Incorporating a ReadOnlyFileSystem approach into your TIBCO BWCE images is a proactive strategy to fortify your application’s security posture. By curbing unnecessary write access and minimizing the potential avenues for unauthorized actions, you’re taking a vital step towards safeguarding your containerized environment.

This guide has unveiled the critical aspects of implementing such a security-enhancing measure, walking you through the process with clear instructions and practical examples. With a focus on reducing attack vectors and bolstering isolation, you can confidently deploy your TIBCO BWCE applications, knowing that you’ve fortified their runtime environment against potential threats.

TIBCO BW Hashicorp Vault Configuration: More Powerful and Better Secured in 3 Steps

Introduction

This article aims to show the TIBCO BW Hashicorp Vault Configuration to integrate your TIBCO BW application with the secrets stored in Hashicorp Vault, mainly for the externalization and management of password and credentials resources.

As you probably know, in the TIBCO BW application, the configuration is stored in Properties at different levels (Module or Application properties). You can read more about them here. And the primary purpose of that properties is to provide flexibility to the application configuration.

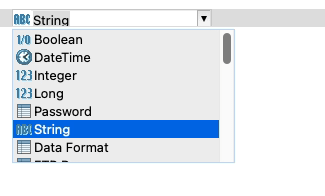
These properties can be of different types, such as String, Integer, Long, Double, Boolean, and DateTime, among other technical resources inside TIBCO BW, as shown in the picture below:

TIBCO BW Hashicorp Vault Configuration: BW Property Types

The TIBCO BW Hashicorp Vault integration will affect only those properties of Password type (at least up to 2.7.2/6.8.1 BW version). The reason behind that is that those properties are the kind of data relevant to the information that is sensitive and needs to be secure. Other concepts can be managed through standard Kubernetes components such as ConfigMaps.

BW Application Definition

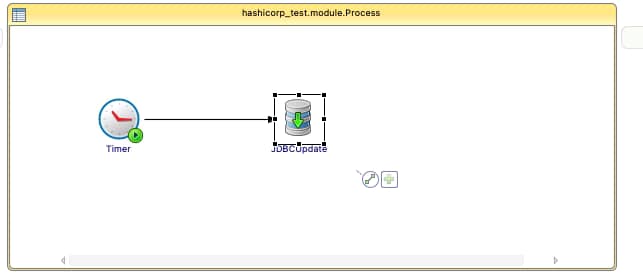
We are going to start with a straightforward application, as you can see in the picture below:

TIBCO BW Hashicorp Vault Configuration: Property sample

Just a simple timer that will be executed once and insert the current time into the PostgreSQL database. We will use Hashicorp Vault to store the password of the database user to be able to connect to it. The username and the connection string will reside on a ConfigMap.

We will skip the part of the configuration regarding the deployment of the TIBCO BW application Containers and link to a ConfigMap you have an article covering that in detail in case you need to follow it, and we will focus just on the topic regarding TIBCO BW Hashicorp Vault integration.

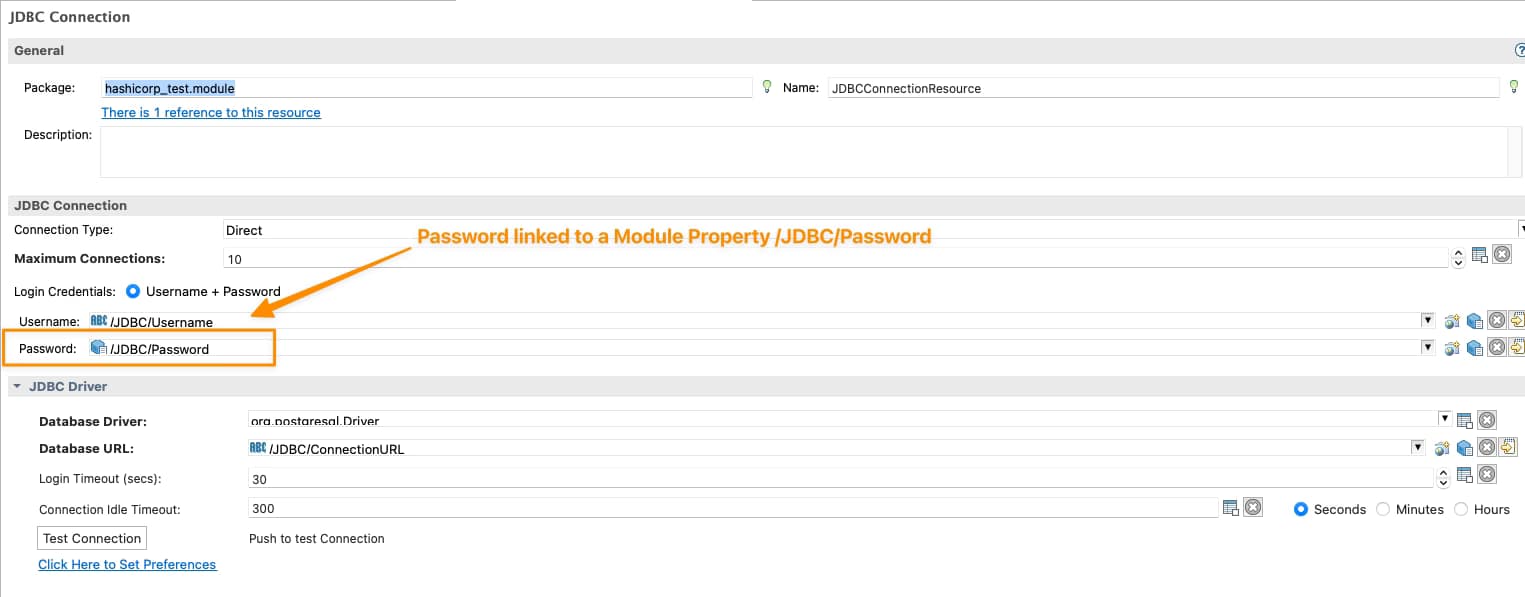
So we will need to tell TIBCO BW that the password of the JDBC Shared Resource will be linked to Hashicorp Vault configuration, and to do that, the first thing is to have tied the Password of the Shared Resources to a Module Property as shown in the picture below:

TIBCO BW Hashicorp Vault Configuration: Password linked to Module Property

Now, we need to tell this Module Property that is Linked to Hashicorp Vault, and we will do that on the Application Property View, selecting that this property is linked to a Credential Management Solution as shown in the picture below:

TIBCO BW Hashicorp Vault Configuration: Credential Management Configuration for Property

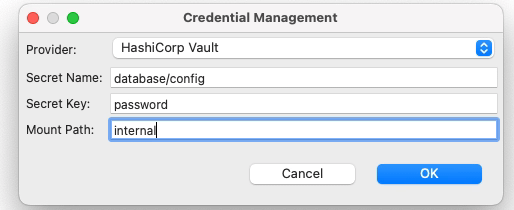
And it is now when we establish the TIBCO BW Hashicorp Vault relationship. We need to click directly on the green plus sign, and we will have a modal window asking for the technology of credentials management that we’re going to use and the data needed for each of them, as you can see in the following picture:

TIBCO BW Hashicorp Vault Configuration: Credential Management Configuration for Property

We will select Hashicorp Vault as the provided. Then we will need to provide three attributes that we already commented on in the previous article when we start creating secrets in Hashicorp Vault:

  • Secret Name: this is the secret name path after the root path of the element.
  • Secret Key: This is the key inside the secret itself
  • Mount Path: This is the root path of the secret

To get more details about these three concepts, please look at our article about how to create secrets in Hashicorp Vault.

So with all this, we have pretty much everything we need to connect to Hashicorp Vault and grab the secret, and from the TIBCO BW BusinessStudio side, everything is done; we can generate the EAR file and deploy it into Kubernetes because here it is the last part of our configuration.

 Kubernetes Deployment

Until this moment, we have the following information already provided:

  • BW Process that has the login to connect to the Database and insert information
  • Link between the password property used to connect and the Hashicorp Secret definition

So, pretty much everything is there, but one concept is missing. How will the Kubernetes Pod connect to Hashicorp once the pod is deployed? Until this point, we didn’t provide the Hashicorp Vault server location of the authentication method to connect to it. This is the missing part of the TIBCO BW Hashicorp Vault integration and will be part of the Kubernetes Deployment YAML file.

We will do that using the following environment properties in this sample:

TIBCO BW Hashicorp Vault Configuration: Hashicorp Environment Variables
  • HASHICORP_VAULT_ADDR: This variable will point to where the Hashicorp Vault server is located
  • HASHICORP_VAULT_AUTH: This variable will indicate which authentication options will be used. In our case, we will use the token one as we used in the previous article
  • HASHICORP_VAULT_KV_VERSION: This variable indicates which version of the KV storage solution we are using and will be two by default.
  • HASHICORP_VAULT_TOKEN: This will be just the token value to be able to authentication against the Hashicorp Vault server

If you are using other authentication methods or just want to know more about those properties please take a look at this documentation from TIBCO.

With all that added to the environment properties of our TIBCO BW application, we can run it, and we will get an output similar to this one, and that shows that the TIBCO BW Hashicorp Vault integration has been done and the application was able to start without any issue

TIBCO BW Hashicorp Vault Configuration: Running sample

TIBCO BW Modules: 3 Things You Need to Know To Succeed

TIBCO BW Modules are one of the most relevant contents on your TIBCO BW developments. Learn all the details about the different TIBCO BW Modules available and when to use each of them.

TIBCO BW Modules

TIBCO BW has evolved in several ways and adapter to the latest changes of architecture. Because of that, since the conception of the latest major version, it has introduced several concepts that is important to master to be able to unleash all the power that this remarkable tool provides to you. Today we are going to talk about the Modules.

Every TIBCO BW application is composed of different modules that are the components that host all the logic that you can create, and that’s the first thing to write down: All your code and everything you do in your application will belong to one TIBCO BW Module.

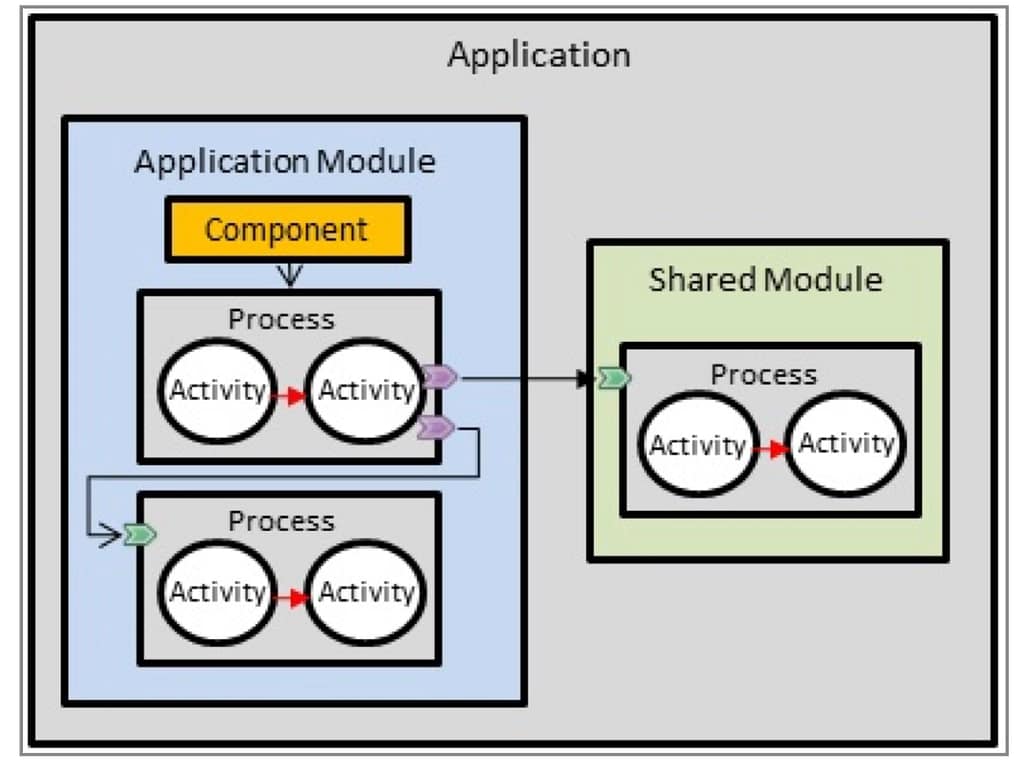
If we think about the normal hierarchy of TIBCO BW components it will be something like that picture below:

At the top level, we will have the Application; at the second level, we will have the modules, and after that, we will have the packages and finally, the technical components such as Process, Resources, Classes, Schemas, Interfaces, and so on. Learn more about this here.

TIBCO BW Module Classification

There are several kind of module and each of them provides a specific use-case and has some characteristics associated with it.

  • Application Module: It is the most important kind of module because without each you cannot have an application. It is the master module and only can be one per application. It is where all your main logic to that application will reside.
  • Shared Module: It is the other only BW native module and it is main purpose as the name shows it is to host all the code and components that can be shared between several applications. If you have experience with previous versions of TIBCO BW you can think on this TIBCO BW Module as a replacement of a Design Time Library (a.k.a DTL) or if you have experience with a programming language a library that is imported to the code. Because of that it doesn’t have a restriction on the number of applications that can use a share module and there is no limitation on the number of share modules that a TIBCO BW Application can have.
  • OSGI Module: This module is the one that is not BW native and it is not going to be include BW objects such as Processes, Resources and so on, and there are mainly concieved to have Java classes. And again it is more like a helper module that also can be shared as needed. Usual scenarios for use this kind of module is to define Custom XPath Functions for example or to have Java Code shared between several applications.

Both Shared Modules and OSGI Modules can be defined as Maven dependencies and use the Maven process to publish them in a Maven repository and also to be retrieved from it based on the declaration.

That provides a very efficient way for distribution and version control of these shared components and, at the same, offers a similar process for other programming languages such as Java so that it will decrease the learning curve for that process.

TIBCO BW Module Limitations

As we already commented, there are some limitations or special characteristics that each module has. We should be very aware of it to help us properly distribute our code using the right kind of modules.

As commented, one application can have only one TIBCO BW Application Module. Even though it is technically possible to have the same BW Application Module in more than one application, that has no sense because both applications will be the same as its main code will be the same.

TIBCO BW Shared Modules at other hand, cannot have Starter components or Activator process as part of its declaration and all of them should reside on the TIBCO BW Application Module

Both TIBCO BW Application Module and TIBCO BW Shared Module can have Java code, but on the other way, the OSGI module can only have Java code and no other TIBCO BW resources.

TIBCO BW Shared Modules can be exported in two different ways, as regular modules (ZIP file with the source code) and in Binary format, to be shared among other developers but not allowing them to change or change their view of the implementation details. This is still supported for legacy reasons, but today’s recommended way to distribute the software is using Maven, as discussed above.

TIBCO BW Module Use-Cases

As commented there are different use cases for each of the module that because of that it will help you decide which component work best for each scenario:

  • TIBCO BW Shared Modules covers all the standard components needed for all the applications. Here, the main use-case is the framework components or main patterns that simplify the development and homogenize. This helps control standard capabilities such as error handling, auditing, logging, or even internal communication, so the developers only need to focus on the business logic for their use case.
  • Another use-case for TIBCO BW Shared Module encapsulates anything shared between applications, such as Resources, to connect to one backend, so all the applications that need to connect to that backend can import and avoid the need to re-work that part.
  • OSGi Module is to have Java code that has a weak relationship with the BW code, such as component to perform an activity such as Sign a PDF Document or Integrate with an element using a Java native API so we can keep it and evolve it separate to the TIBCO BW Code.
  • Another case for OSGI Module is defining the Custom XPath Functions that you will need as part of your Shared Module or your Application Module.
  • TIBCO BW Application Module, on the other hand, only should have code that is specific to the business problem that we are resolving here, moving all code that can be used for more than one application to a Shared Module.

Learn Now 2 Ways To Configure TIBCO BW EMS Reconnection

On this article we are going to cover how TIBCO BW EMS Reconnection works and how you can apply it on your application and the pros and const about the different options available.

TIBCO BW EMS Reconnection

One of the main issues we all have faced when working on a TIBCO BW and EMS integration is the reconnection part. Even though this is something that we need on minimal occasions because of the TIBCO EMS server’s extreme reliability, it can have severe consequences if we don’t have that well configured.

But before we start talking about the options, we need to do a little background explanation to understand the situation entirely.

Usually, there are two ways that we can use to connect our TIBCO BW application to our TIBCO EMS server: Direct and JNDI. And based on that, this will change how and where we need to configure our reconnection properties.

TIBCO BW + EMS: Direct Connection

This is, as it sounds, a direct connection to the TIBCO BW application to the EMS server itself, with the listener used to send and receive messages. There is no component in the middle, and you can detect that because on the JMS Connection Resources, it will show as “Direct,” and the URL is always in the following fashion: tcp://server: port as you can see in the picture below:

TIBCO BW + EMS: Direct Connection

 TIBCO BW + EMS: JNDI Connection

This is a different kind of connection, and it has a central component compared with the Direct link, as you can imagine. In this scenario, at the connection time, the TIBCO BW application performs a first connection to the JNDI server that is inside the TIBCO EMS server and lookups for the connection details based on a “Connection Factory.” This connection factory will have its connection URL and connection properties. TIBCO BW Application will receive that information and start connecting to that EMS Server.

You will know that you are using a JNDI Connection because the Connection Factory Type now will show JNDI. Also, you will require an additional resource name, JNDI resource, and your URL connection will be something like this tibjmsnaming://server:port.

 TIBCO BW + EMS: JNDI Connection

TIBCO EMS Reconnection Properties

Different properties manage the reconnection process. Those properties will affect the behavior of the EMS client library that lives in the client application, in this case, the TIBCO BW Application. The properties will control the following aspects: the number of connection attempts, time intervals between them, and timeout of the gap to consider it an unsuccessful attempt.


And you will have each of these properties for the reconnection process and the connection process. The main difference is that the connection process will only act when you are setting a connection for the first time (at the startup of the TIBCO BW application). The reconnection settings will apply when you lose a previously established connection.

The concrete properties are the following:

  • tibco.tibjms.reconnect.attemptcount/tibco.tibjms.connect.attemptcount: It will define the number of attempts you will perform when a reconnection scenario is detected
  • tibco.tibjms.reconnect.attemptdelay/tibco.tibjms.connect.attemptdelay: It will define the time interval between two reconnection attempts.
  • tibco.tibjms.reconnect.attempts/tibco.tibjms.connect.attempts It will serve as a combination of the attemptcount and attemptdelay in a comma-separated version.
  • tibco.tibjms.reconnect.attempt.timeout/tibco.tibjms.connect.attempt.timeout: It will define the timeout for each of the reconnection attempts, and if that time is reached, the reconnection is not established; it will be detected as an unsuccessful attempt.

 Where To Set the Reconnection Properties?

In the case that we are talking about a Direct connection, these properties need to be specified on the TIBCO BW application, and these properties will be set as JVM properties.

So depending on your deployment model, these properties will need to be added to the AppNode TRA file or the BW_JAVA_OPS environment variables if we are talking about a containerized deployment.

On the other hand, if we talk about a JNDI connection, these properties will be set at the EMS level as part of the Connection Factory reconnection properties. This can be done using the tibemsadmin CLI component, putting it directly in the factories.conf file, or even using a Graphical tool such as gEMS using the Factories section to update that, as shown in the picture below:

Depending on the approach that you will follow, the properties will be applied at runtime (gEMS or tibemsadminapproach) or on the next restart (factories.conf)

Pros and Cons

There are different pros and cons to using one connection mode. Based on the reconnection properties, using a centralized way such as the JNDI model ensures that all the components using that connection will have the same reconnection properties. If you need to change it, you don’t need to change all your TIBCO BW applications. That can be a number up to hundreds.

But, at the same time, the usage of a centralized way provides less flexibility than the direct connection where you can decide the specific values for each application or even which ones need reconnection configuration and which ones don’t.

Suppose you are looking for simplicity and ease of management. In that case, I will always go for the JNDI-based connection because it provides more benefits in those aspects, and the lack of flexibility is usually not required at all.

TIBCO BW and EMS Integration

TIBCO BW supports many different integration methods and hundreds of connectors that allow you to connect to any possible source. But truth must be told, EMS is one of the standard connectors you need to enable. That’s why TIBCO BW and EMS usually goes together when it comes to a proper Integration Platform.

JMS Support for TIBCO BW is out of the box, but like any other JMS implementation, you need to provide the client libraries to establish a real connection.

To do that, since TIBCO BW 6, a simple way is provided to simplify that process, and this is what we are going to cover in this article.

Problem description

The first thing is to know that you need to do something and the most important thing is to learn to understand what kind of error is related to this problem. You could find two different errors depending on where you are testing this: design-time or runtime.

If we are talking about a runtime issue, you can see a trace similar to this one:

2022-06-02T13:27:15,867 ERROR [pool-13-thread-2] c.t.b.thor.runtime.model.Constituent - The following error has occurred for "name: test-app version: 1.0.0.qualifier bundle name: test-app " which needs to be resolved.
2022-06-02T13:27:15,878 ERROR [pool-13-thread-2] c.t.b.thor.runtime.model.Constituent - TIBCO-BW-FRWK-600053: Failed to initialize BW Component [ComponentStarter].
<CausedBy> com.tibco.bw.core.runtime.api.BWEngineException: TIBCO-BW-CORE-500232: Failed to initialize BW Component [ComponentStarter], Application [test-app:1.0] due to activity initialization error.
<CausedBy> com.tibco.bw.core.runtime.ActivityInitException: TIBCO-BW-CORE-500408: Failed to initialize the ProcessStarter activity [JMSReceiveMessage] in process [com.test.Starter], module [test-app] **due to unexpected activity lifecycle error.**
**<CausedBy> java.lang.NullPointerException**

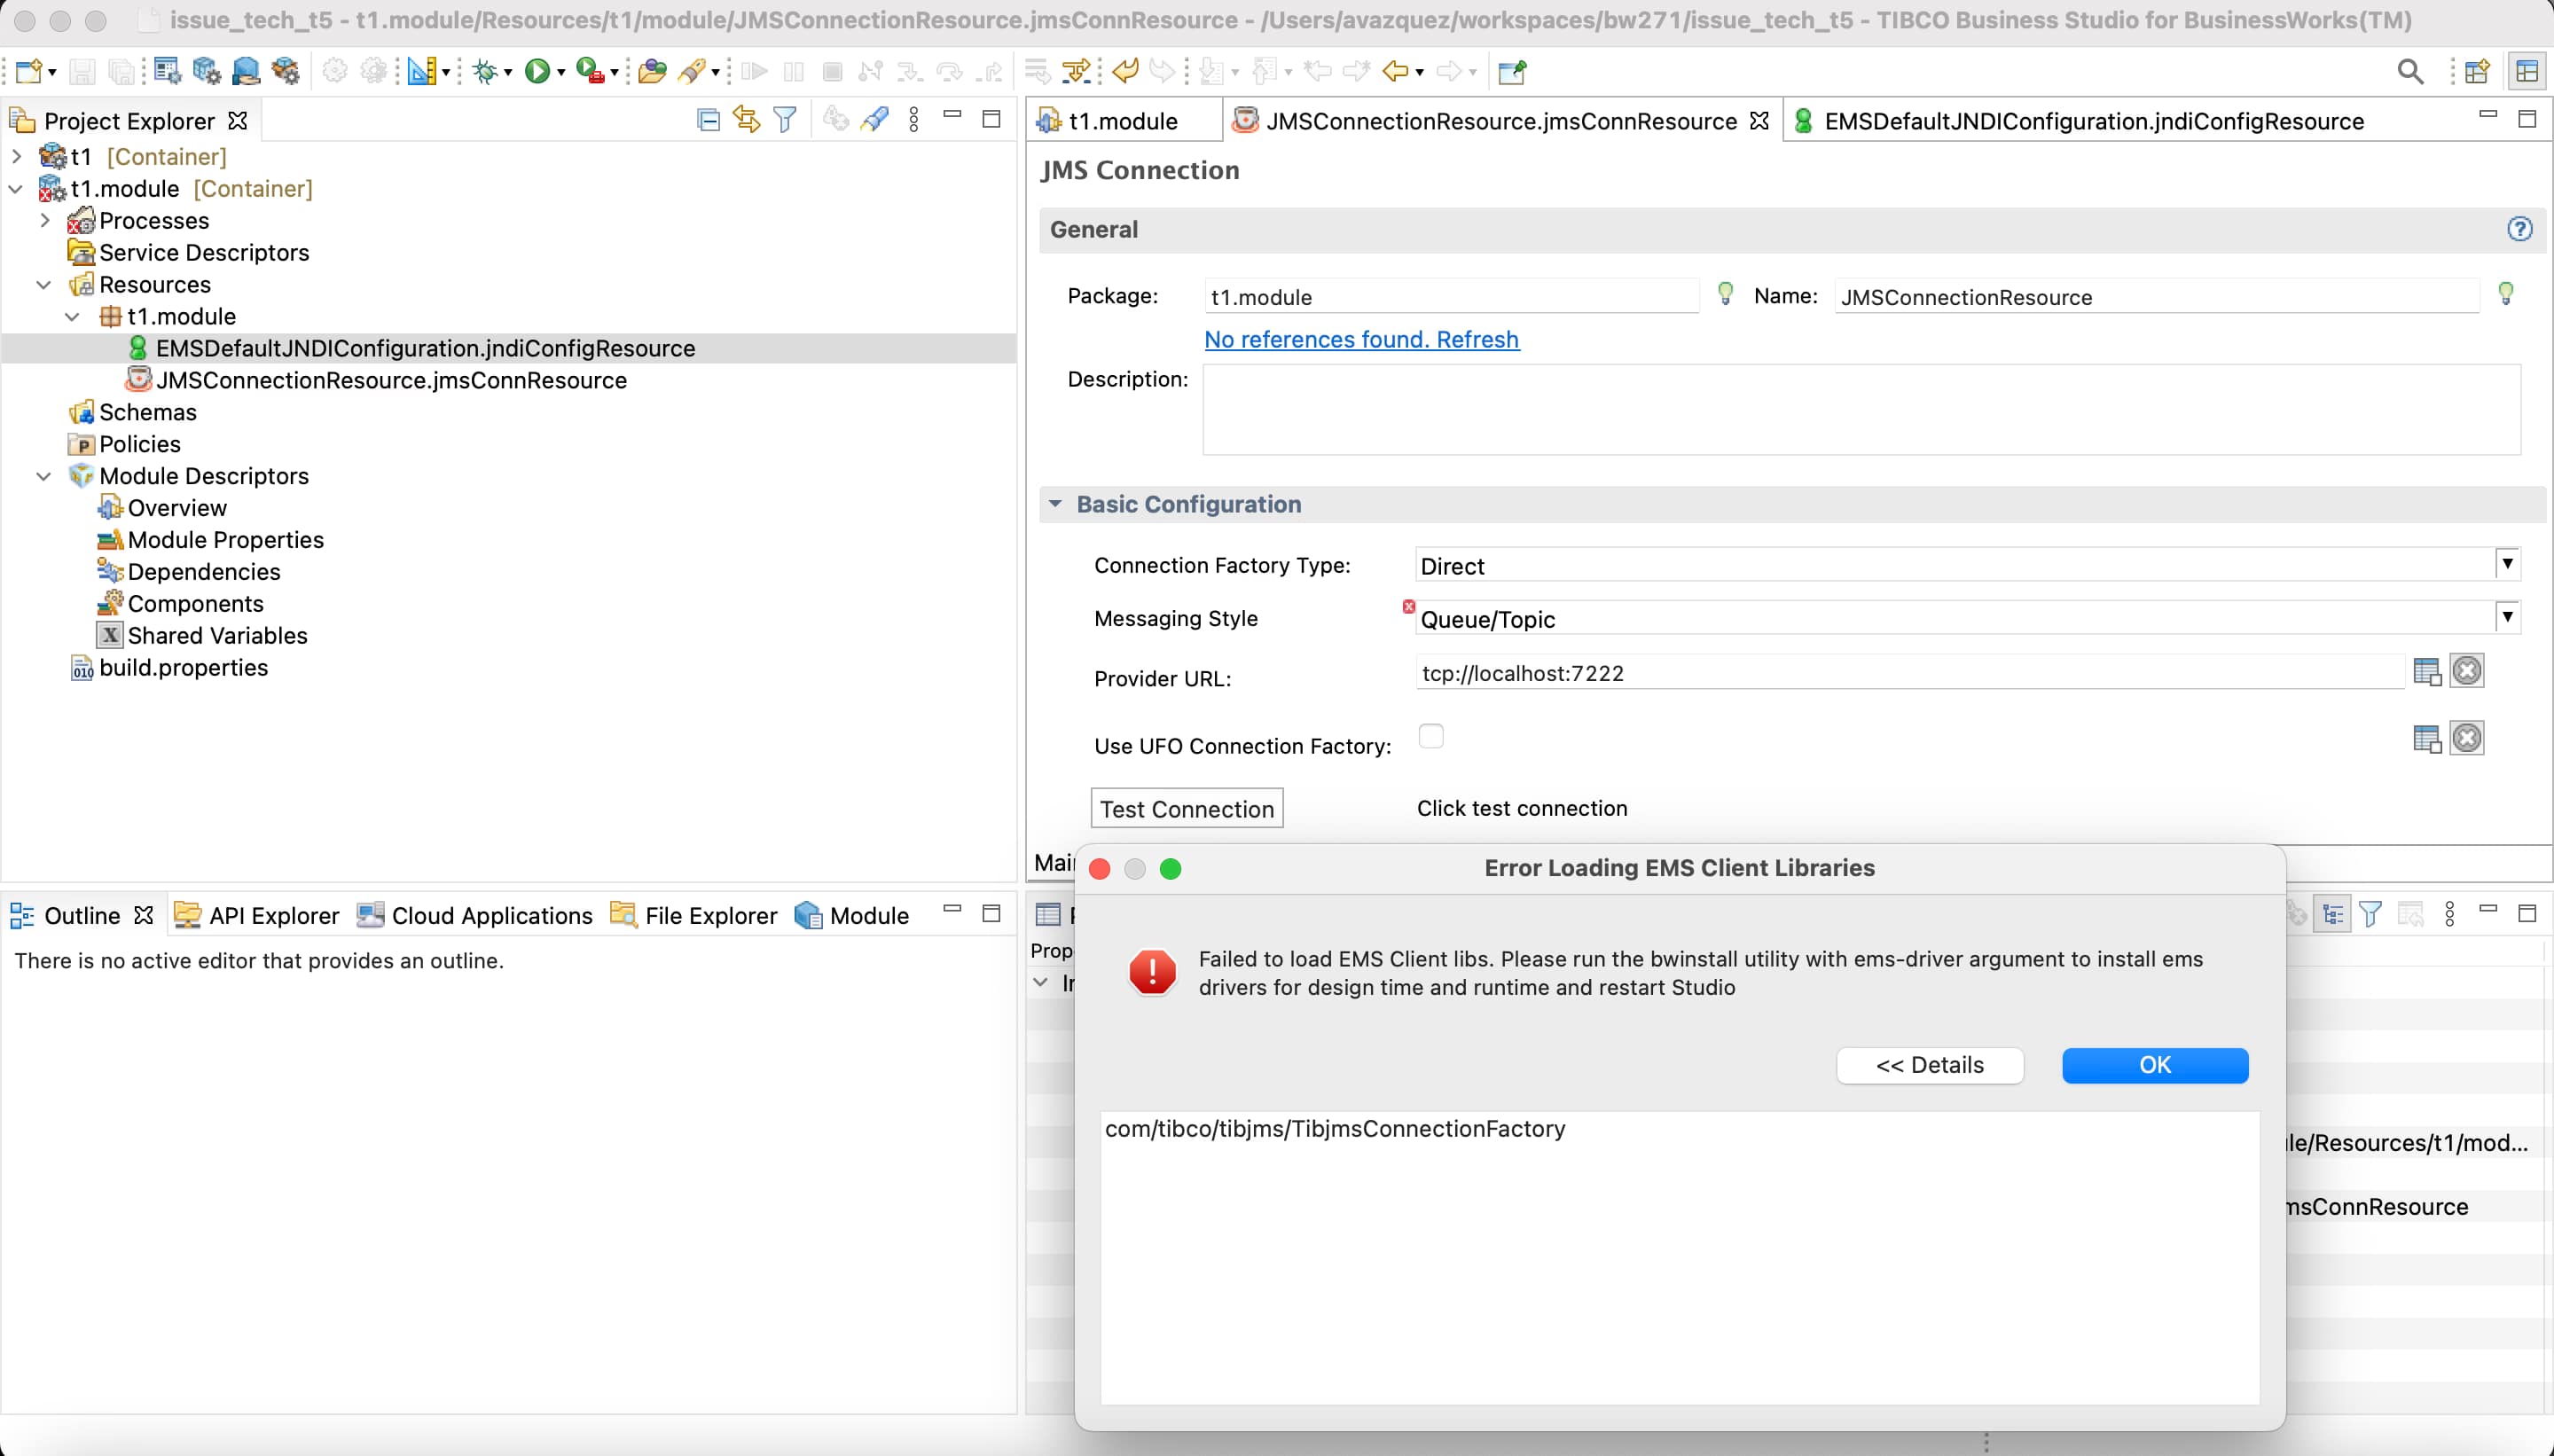
Each time you see a java.lang.NullPointerExceptionrelated to a JMS Receive activity, you can be sure the issue is related to the installation of the drivers.

If we are talking about Design-time, you will see the same error when you are trying to start a Run or Debug session, but additional you will see the following error when you are testing a JMS Connection Resource, as you can see in the picture below:

Installation Process

The installation process is quite simple, but you need access to an EMS installation or at least a disk location with the clients stored. If you already have that, you just need to go to the following location:

 TIBCO_HOME/bw/<version>/bin

Where TIBCO_HOME is the installation folder for the BusinessWorks application, and version is the minor version format (such as 6.7, 2.7, 6.8, and so on).

At this location, you will run the following command:

 ./bwinstall ems-driver

This will start and ask for the location of the client libraries, as you can see in the picture below:

And after that, it will do the process of installing it will end with the BUILD SUCCESSFULL output. And after that point, you will need to restart the Business Studio or the runtime components (such as AppNodes or bwagent) to have the configuration applied.

Solution for Transformation failed for XSLT input in BusinessWorks

Solving one of the most common developer issues using BusinessWorks

The Transformation failed for XSLT input is one of the most common error messages you could see when developing using the TIBCO BusinessWorks tools. Understanding what the message is saying is essential to provide a quick solution.

I have seen developers needing hours and hours trying to troubleshoot this kind of error when most of the time, all the information you are receiving is just in front of you, but you need to understand why the engine is aching for it.

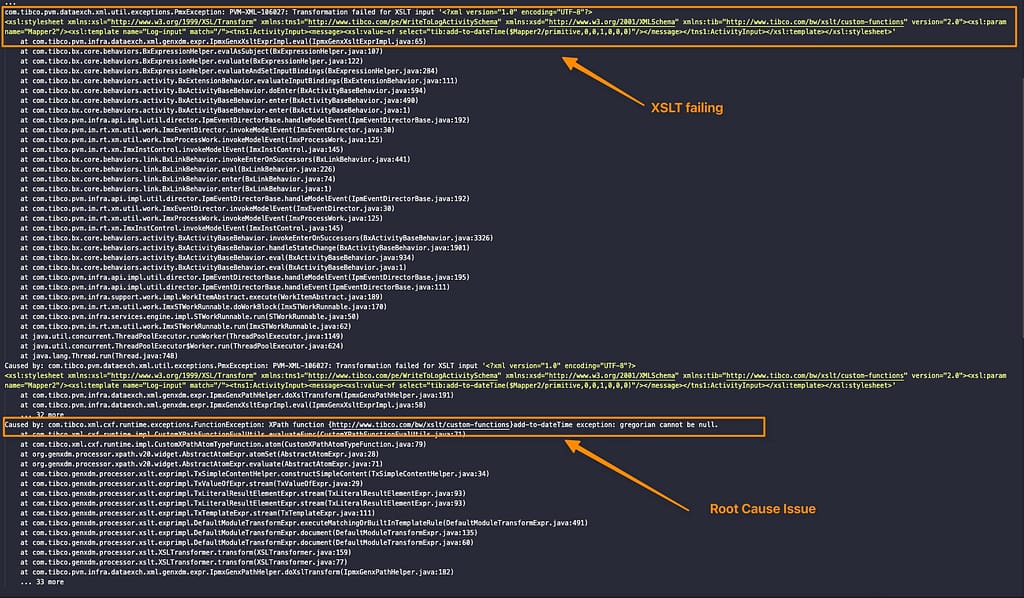
But let’s provide a little bit of context first. What is this error that we’re talking about? I’m talking about something like what you can see in the log trace below:

...
com.tibco.pvm.dataexch.xml.util.exceptions.PmxException: PVM-XML-106027: Transformation failed for XSLT input '<?xml version="1.0" encoding="UTF-8"?>
<xsl:stylesheet xmlns:xsl="http://www.w3.org/1999/XSL/Transform" xmlns:tns1="http://www.tibco.com/pe/WriteToLogActivitySchema" xmlns:xsd="http://www.w3.org/2001/XMLSchema" xmlns:tib="http://www.tibco.com/bw/xslt/custom-functions" version="2.0"><xsl:param name="Mapper2"/><xsl:template name="Log-input" match="/"><tns1:ActivityInput><message><xsl:value-of select="tib:add-to-dateTime($Mapper2/primitive,0,0,1,0,0,0)"/></message></tns1:ActivityInput></xsl:template></xsl:stylesheet>'
	at com.tibco.pvm.infra.dataexch.xml.genxdm.expr.IpmxGenxXsltExprImpl.eval(IpmxGenxXsltExprImpl.java:65)
	at com.tibco.bx.core.behaviors.BxExpressionHelper.evalAsSubject(BxExpressionHelper.java:107)
...

Sounds more familiar now? As I already said, all TIBCO BusinessWorks developers have faced that. As I said, I have seen some of them struggling or even re-doing the job repeatedly without finding a proper solution. But the idea here is to try to solve it efficiently and quickly.

I will start with the initial warnings: Let’s avoid re-coding, re-doing something that should work but is not working, because you are not winning in any scenario:

  • If you re-do it again and it didn’t work, you lose x2 time creating something you already have, and you are still stuck.
  • If you re-do it again and it works, you don’t know what was wrong, so that you will face it again shortly.

So, how do this works? Let’s use this process:

Collect —> Analyze —> Understand —> Fix.

Scenario

So first, we need to collect data, and most of the time, as I said, it is enough with the log trace that we have, but at some moment, you could need to require the code of your process to detect the error the solution.

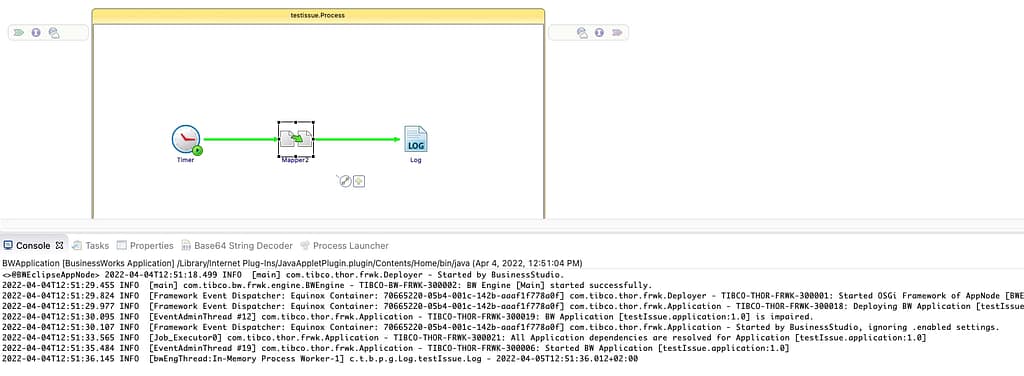
So we will start with this source code that you can see in the screenshot below and the following explanation:

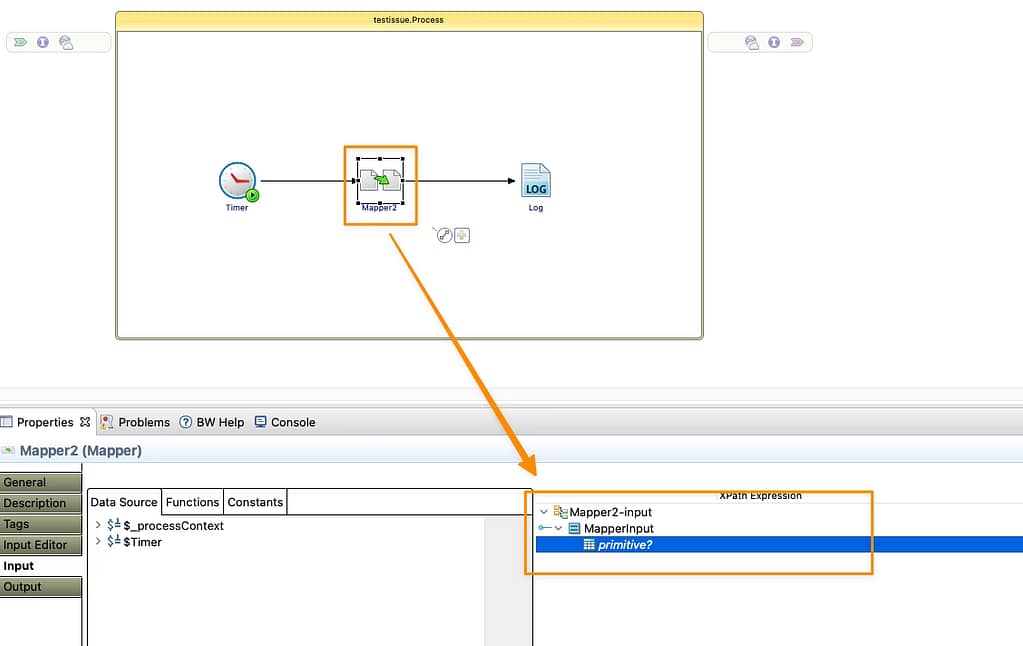
We have a Mapper that is defining a schema with an int element that is an option, and we’re not providing any value:

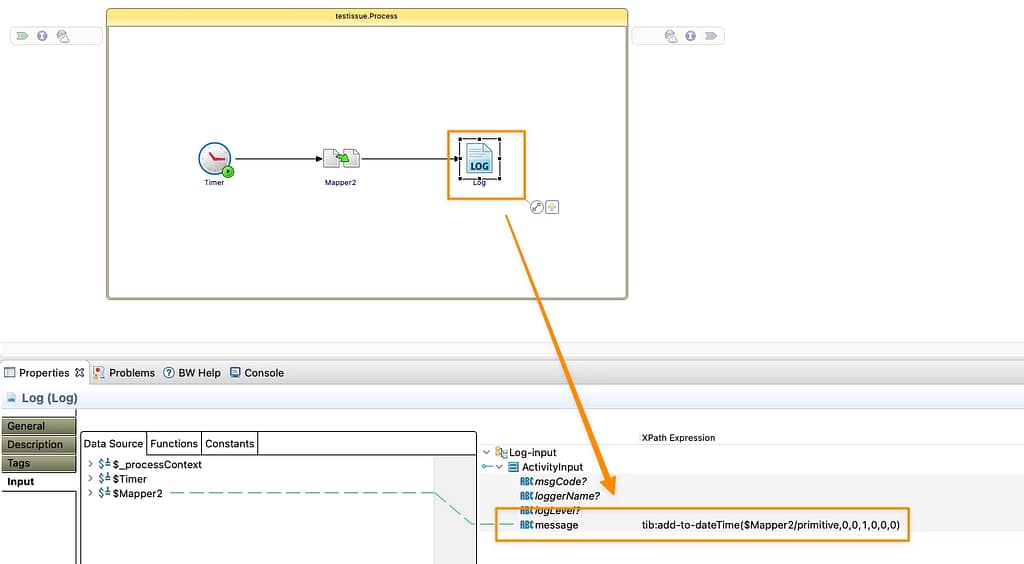
And then we’re using the date to print a log, adding one more day to that date:

Solution

First, we need to understand the error message. When we’re getting an error message titled `Transformation failed for XSLT input that says precisely this:

I tried to execute the XSLT that is related to one activity, and I failed because of a technical error

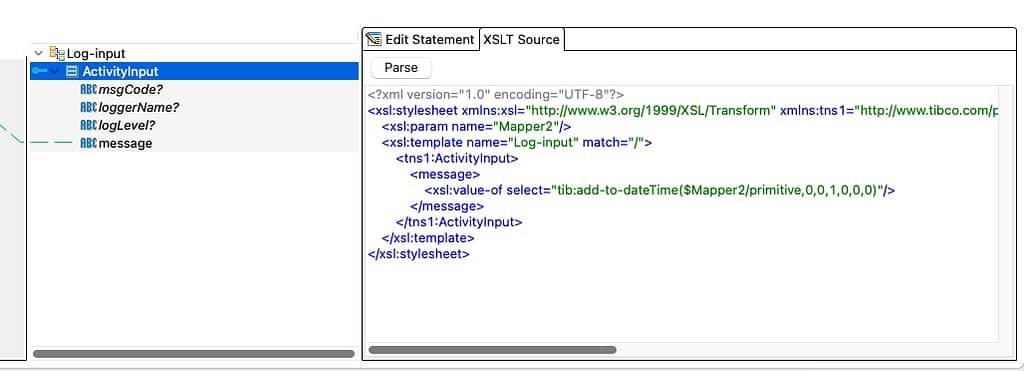
As probably you already know, each of the BusinessWorks activities executed an XSL Transformation internally to do the Input mapping; you can see it in the Business Studio directly. So, this error is telling you that this internal XSL is failing.

And the reason is a run-time issue that cannot be detected at design time. So, to make it clear, the values of some of your variables and transforming fail. So first, you should focus on this. Usually, all the information is in the log trace itself, so let’s start analyzing that:

So, let’s see all the information that we have here:

  • First of all, we can detect what activity is failing. You can easily do that if you are debugging locally, but if this is happening on the server can be more tricky; but with this information, you have: All the XSLT itself that is printed on the log trace, so you can easily
  • You also have a Caused by that is telling you why this is failing:
    • You can have several Caused by sentences that should be reading in cascading mode, so the lower one is the root issue generating the error for all the others above, so we should locate that first.

In this case, the message is quite evident, as you can see in the trace below.

 com.tibco.xml.cxf.runtime.exceptions.FunctionException: XPath function {http://www.tibco.com/bw/xslt/custom-functions}add-to-dateTime exception: gregorian cannot be null.

So the add-to-dateTime function fails because one Gregorian argument (so, a date) is null. And that’s precisely what is happening in my case. If I provide a value to the parameter… Voilà, it is working!

 Summary

Similar situations can happen with different root causes, but the most commons are:

  • Issue with optional and not optional elements so a null reaches a point where it should.
  • Validation errors because the input parameter doesn’t match the field definition.
  • Extended XML Types that are not supported by the function used.

All these issues can be easily and quickly solved following the reasoning we explained in this post!

So, let’s put it into practice next time you see a colleague with that issue and help them have a more efficient programming experience!

How To Troubleshoot Network Connections On Your Kubernetes Workloads

blue UTP cord

Discover Mizu: Traffic Viewer for Kubernetes to ease this challenge and improve your daily work.


Photo by Jordan Harrison on Unsplash

One of the most common things we have to do when testing and debugging our cloud-native workloads on Kubernetes is to check the network communication.

It could be to check the incoming traffic you are getting so we can inspect the requests we are receiving and see what we are replying to and similar kinds of use-cases. I am sure this sounds familiar to most of you.

I usually solve that using tcpdump on the container, similar to what I would do in a traditional environment, but this is not always easy. Depending on the environment and configuration, you cannot do so because you need to include a new package in your container image, do a new deployment, so it is available, etc.

So, to solve that and other similar problems, I discovered a tool named Mizu, which I would like to have found a few months ago because it would help me a lot. Mizu is precisely that. In its own words:

Mizu is a simple-yet-powerful API traffic viewer for Kubernetes, enabling you to view all API communication between microservices across multiple protocols to help you debug and troubleshoot regressions.

To install, it is pretty straightforward. You need to grab the binary and provide the correct permission on your computer. You have a different binary for each architecture, and in my case (Mac Intel-based), these are the commands that I executed:

curl -Lo mizu github.com/up9inc/mizu/releases/latest/download/mizu_darwin_amd64 && chmod 755 mizu && mv mizu /usr/local/bin

And that’s it, then you have a binary in your laptop that connects to your Kubernetes cluster using Kubernetes API, so you need to have configured the proper context.

In my case, I have deployed a simple nginx server using the command:

 kubectl run simple-app --image=nginx --port 80

And once that the component has been deployed, as it is shown in the Lens screenshot below:

I ran the command to launch mizu from my laptop:

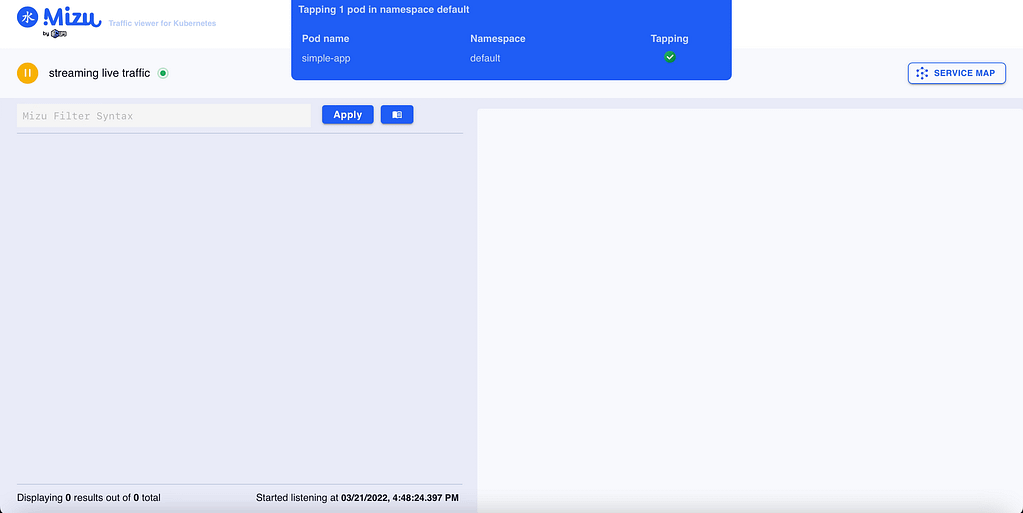
mizu tap

And after a few seconds, I have in front of me a webpage opened monitoring all traffic happening in this pod:

I have made the nginx port expose using the kubectl expose command:

 kubectl expose pod/simple-app

And after that, I deployed a temporary pod using the curl image to start sending some requests with the command shown below:

 kubectl run -it --rm --image=curlimages/curl curly -- sh

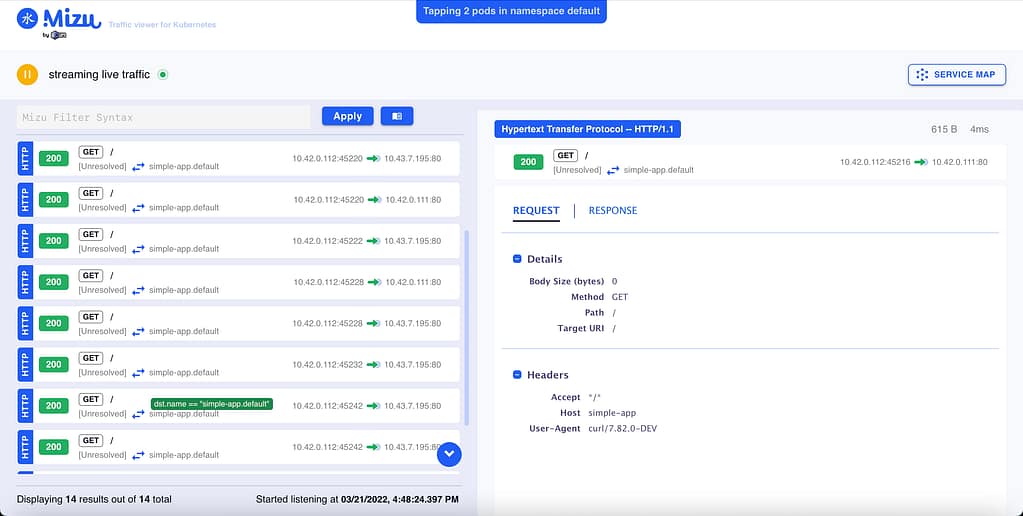
now I’ve started to send some requests to my nginx pod using curl:

 curl -vvv http://simple-app:80 

And after a few calls, I could see a lot of information in front of me. First of all, I can see the requests I was sending with all the details of it:

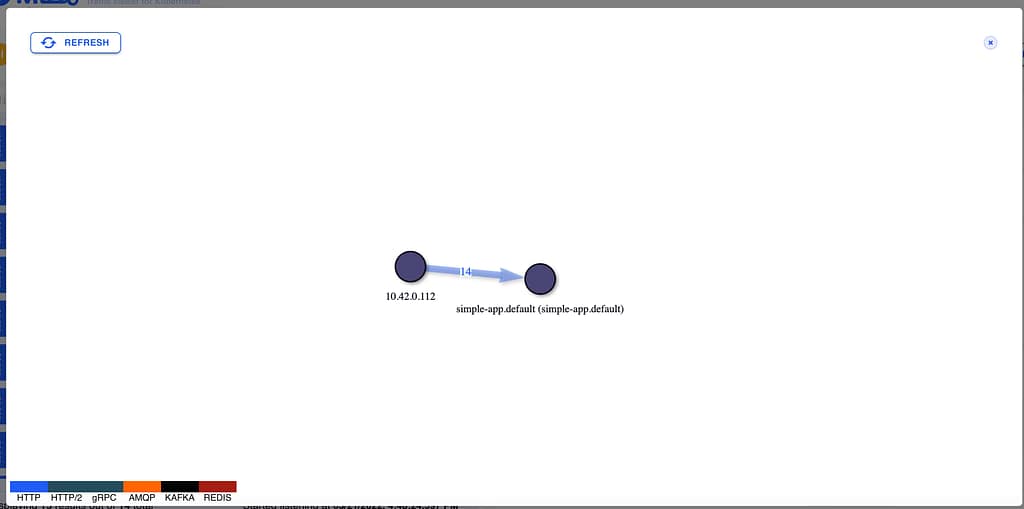
But even more important, I can see a service map diagram showing the dependencies and the calls graphically happening to the pod with the response time and also the protocol usage:

This will not certainly replace a complete observability solution on top of a service mesh. Still, it will be a beneficial tool to add to your toolchain when you need to debug a specific communication between components or similar kinds of scenarios. As commented, it is like a high-level tcpdump for pod communication.

TIBFAQS: Improving Your TIBCO BW SOAP API Response Time on Big Payloads when Using Apache Commons

Discover how to fine-tune your SOAP services to be able to be efficient for massive payload requests

Photo by Markus Spiske on Unsplash

We all know that when we are implementing API, we need to carefully design the size that we can manage as the maximum of request size. So, for example, you should know that for an online request, the usual upper limit is 1 MB, everything beyond that we should be able to manage it differently (options to drive can be slicing the requests or using other protocols rather than HTTP to handle this kind of loads). But then real-life comes to tackle us there.

Not always this is possible to stick to the plan. Not always we are the ones making that decision. And we can argue as long as we like that this is not a good idea and that is great, but at the same time, we need to do something that is working.

By default, when we are exposing a SOAP Service on TIBCO BusinessWorks, it relies on third-party libraries to manage the request, parse it, and help us access the requests’ content. Some of them come from the Apache Foundation, and the one that we are going to talk about is Apache Commons.

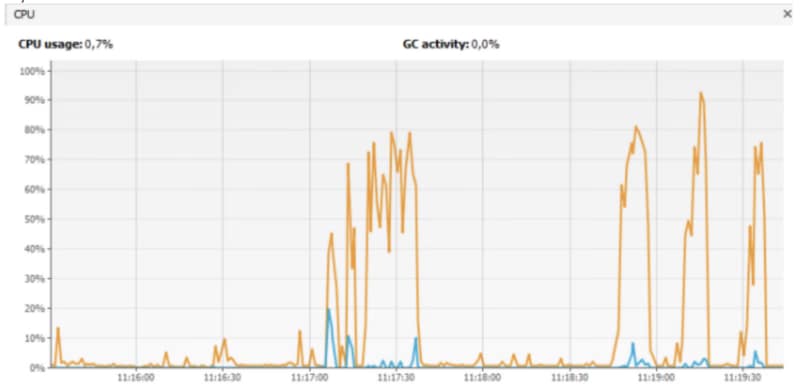
When we are sending a big request to our SOAP service, in my case, this is an 11 MB SOAP request to my system, and I start to see the following behavior:

  • Service is not responding to my consumer.
  • I can see significant usage of the HTTP Connector thread handling the request before sending it to the actual service.
  • CPU and memory are increasing a lot.

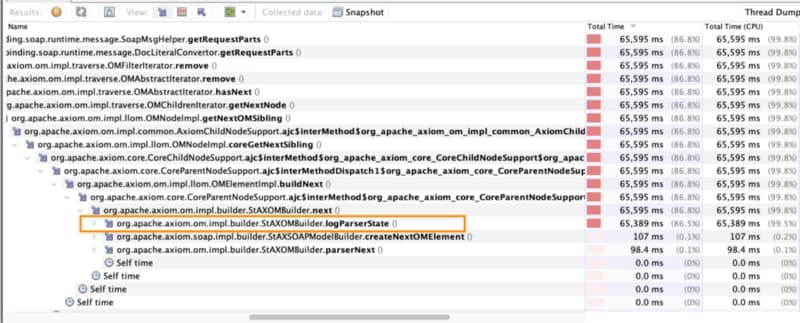
So, how can we improve that? The first thing is to go more into the details about that extensive CPU usage. For example, if we go into the stack trace that the HTTP Connector threads are running, you can see the following stack trace:

You can get that information from several sources:

  • One is using the JVisual VM and going to the snapshot details in the samples as I did.
  • You can also get a thread dump and use tools such as https://fastthread.io/index.jsp to visualize it graphically.

Here we can see that we’re stuck at the log method. And that is strange why I am logging these requests if I’m not doing that in the BusinessWorks configuration. The answer is quite simple: Apache libraries have their logging system that is not affected by the logback configuration BusinessWorks uses.

So, we can disable that using the following JVM property:

-Dorg.apache.commons.logging.Log=org.apache.commons.logging.impl.NoOpLog

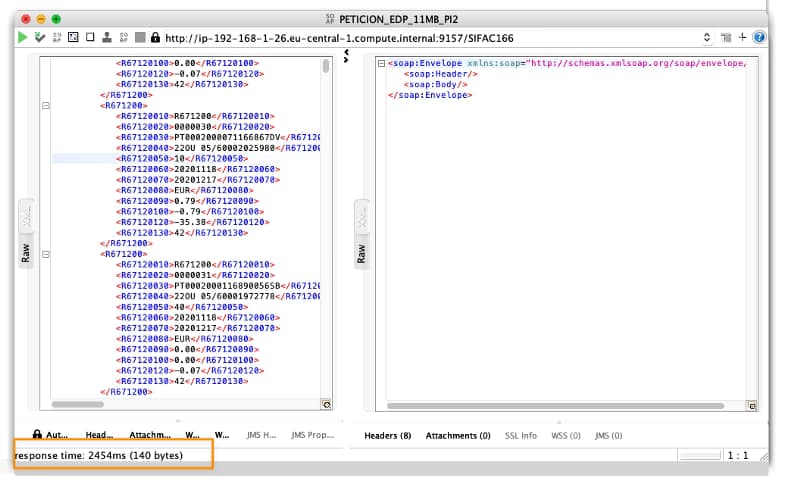
Response time has improved from 120 seconds for 11 MB to less than 3 seconds, including all the logic the service was doing. Pretty impressive, right?

Summary

I hope you find this interesting, and if you are one of those facing this issue now, you have information not to be stopped by this one. If you would like to submit your questions feel free to use one of the following options:

  • Twitter: You can send me a mention at @alexandrev on Twitter or a DM or even just using the hashtag #TIBFAQS that I will monitor.
  • Email: You can email me to alexandre.vazquez at gmail.com with your question.
  • Instagram: You can send me a DM on Instagram at @alexandrev