Usually, when you’re developing or running your container application you will get to a moment when something goes wrong. But not in a way you can solve with your logging system and with testing.
A moment when there is some bottleneck, something that is not performing as well as you want, and you’d like to take a look inside. And that’s what we’re going to do. We’re going to watch inside.
Because our BusinessWorks Container Edition provides so great features to do it that you need to use it into your favor because you’re going to thank me for the rest of your life. So, I don’t want to spend one more minute about this. I’d like to start telling you right now.
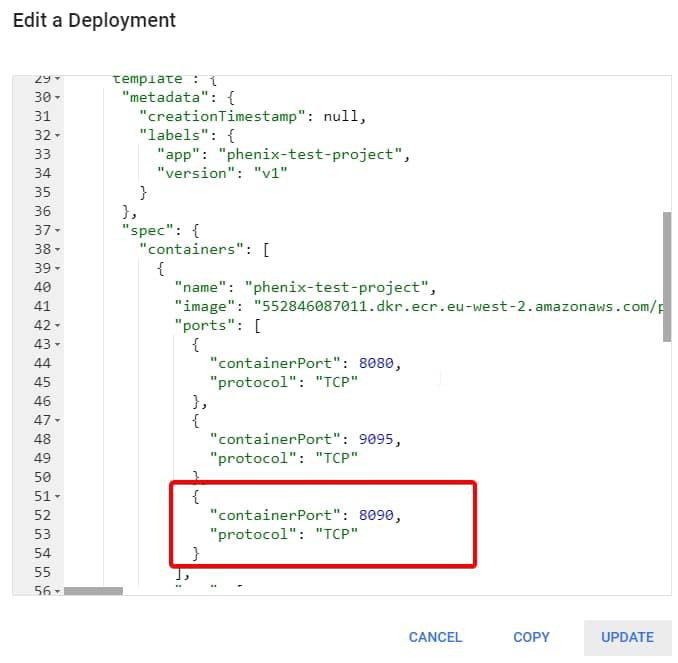
The first thing we need to do, we need to go inside the OSGi console from the container. So, the first thing we do is to expose the 8090 port as you can see in the picture below

Now, we can expose that port to your host, using the port-forward command
kubectl port-forward deploy/phenix-test-project-v1 8090:8090
And then we can execute an HTTP Request to execute any info using commands like this:
curl -v http://localhost:8090/bw/framework.json/osgi?command=<command>
And we’re are going to execute first the activation of the process statistics like this:
curl -v http://localhost:8090/bw/framework.json/osgi?command=startpsc

And as you can see it says that statistics has been enabled for echo application, so using that application name we’re going to gather the statistics at the level
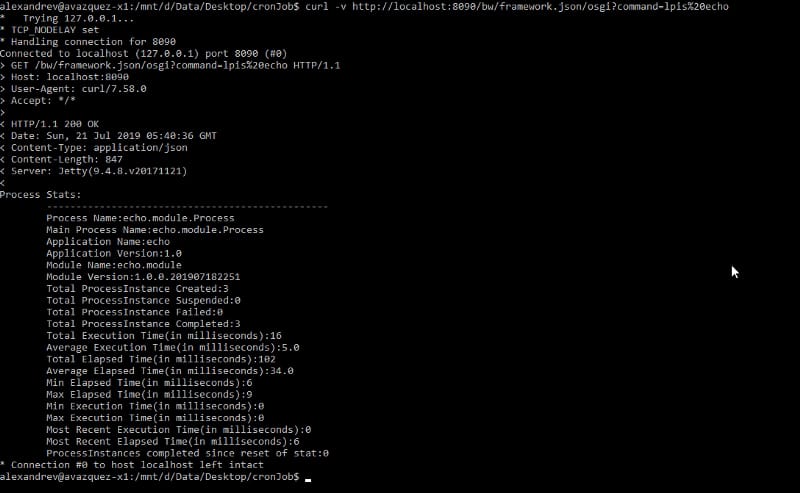
curl -v http://localhost:8090/bw/framework.json/osgi?command=lpis%20echo

And you can see the statistics at the process level where you can see the following metrics:
- Process metadata (name, parent process and version)
- Total instance by status (create, suspended, failed and executed)
- Execution time (total, average, min, max, most recent)
- Elapsed time (total, average, min, max, most recent)
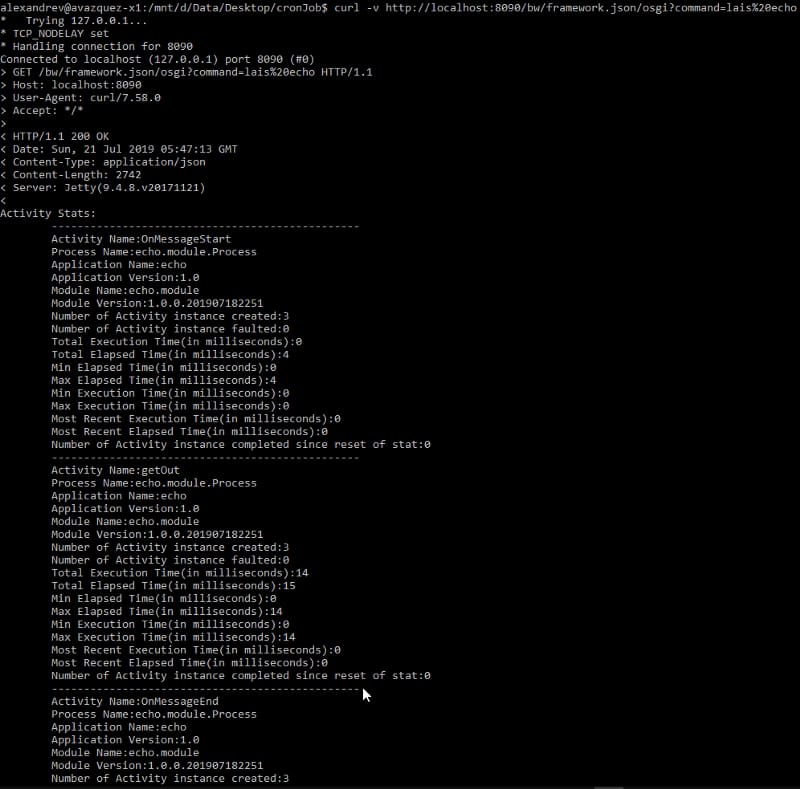
And we can get the statistics at the activity level:

And with that, you can detect any bottleneck you’re facing into your application and also be sure which activity or which process is responsible for it. So you can solve it in a quick way.
Have fun and use the tools at your disposal!

