Introduction
Probes are how we’re able to say to Kubernetes that everything inside the pod is working as expected. Kubernetes has no way to know what’s happening inside at the fine-grained and has no way to know for each container if it is healthy or not, that’s why they need help from the container itself.
Imagine that you’re Kubernetes controller and you have like eight different pods , one with Java batch application, another with some Redis instance, other with nodejs application, other with a Flogo microservice (Note: Haven’t you heard about Flogo yet? Take some minutes to know about one of the next new things you can use now to build your cloud-native applications) , another with a Oracle database, other with some jetty web server and finally another with a BusinessWorks Container Edition application. How can you tell that every single component is working fine?
First, you can think that you can do it with the entrypoint component of your Dockerfile as you only specify one command to run inside each container, so check if that process is running, and that means that everything is healthy? Ok… fair enough…
But, is this true always? A running process at the OS/container level means that everything is working fine? Let’s think about the Oracle database for a minute, imagine that you have an issue with the shared memory and it keeps in an initializing status forever, K8S is going to check the command, it is going to find that is running and says to the whole cluster: Ok! Don’t worry! Database is working perfectly, go ahead and send your queries to it!!

This could happen with similar components like a web server or even with an application itself, but it is too common when you have servers that can handle deployments on it, like BusinessWorks Container Edition itself. And that’ why this is very important for us as developers and even more important for us as administrators. So, let’s start!
The first thing we’re going to do is to build a BusinessWorks Container Edition Application, as this is not the main purpose of this article, we’re going to use the same ones I’ve created for the BusinessWorks Container Edition — Istio Integration that you could find here.
So, this is a quite simple application that exposes a SOAP Web Service. All applications in BusinessWorks Container Edition (as well as in BusinessWorks Enterprise Edition) has its own status, so you can ask them if they’re Running or not, that something the BusinessWorks Container internal “engine” (NOTE: We’re going to use the word engine to simplify when we’re talking about the internals of BWCE. In detail, the component that knows the status of the application is the internal AppNode the container starts, but let’s keep it simple for now)
Kubernetes Probes
In Kubernetes, exists the “probe” concept to perform health check to your container. This is performed by configuring liveness probes or readiness probes.
- Liveness probe: Kubernetes uses liveness probes to know when to restart a Container. For example, liveness probes could catch a deadlock, where an application is running, but unable to make progress.
- Readiness probe: Kubernetes uses readiness probes to know when a Container is ready to start accepting traffic. A Pod is considered ready when all of its Containers are ready. One use of this signal is to control which Pods are used as backends for Services. When a Pod is not ready, it is removed from Service load balance
Even when there are two types of probes for BusinessWorks Container Edition both are handling the same way, the idea is the following one: As long as the application is Running, you can start sending traffic and when it is not running we need to restart the container, so that makes it simpler for us.
Implementing Probes
Each BusinessWorks Container Edition application that is started has an out of the box way to know if it is healthy or not. This is done by a special endpoint published by the engine itself:
http://localhost:7777/_ping/
So, if we have a normal BusinessWorks Container Edition application deployed on our Kubernetes cluster as we had for the Istio integration we have logs similar to these ones:

As you can see logs says that the application is started. So, as we can’t launch a curl request from the inside the container (as we haven’t exposed the port 7777 to the outside yet and curl is not installed in the base image), the first thing we’re going to do is to expose it to the rest of the cluster.
To do that we change our Deployment.yml file that we have used to this one:
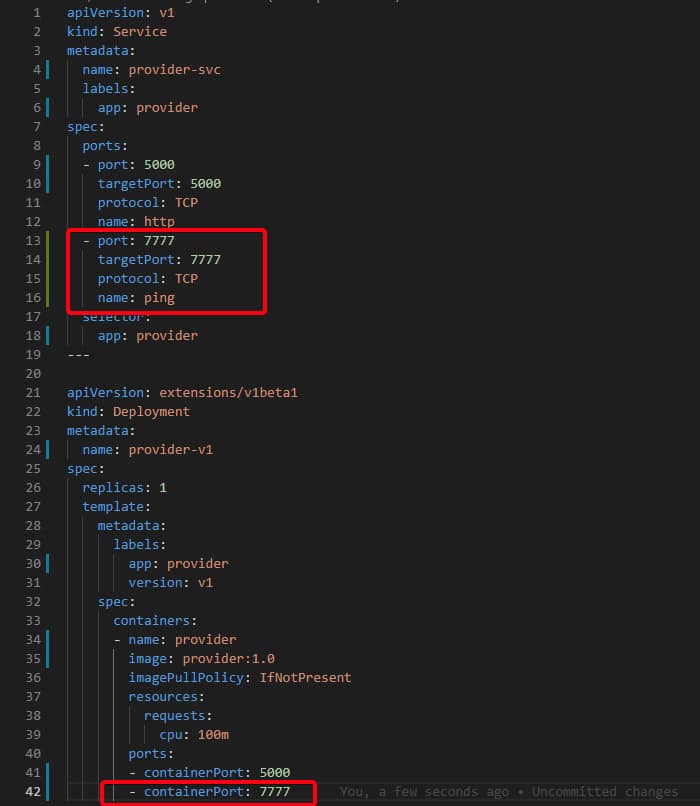
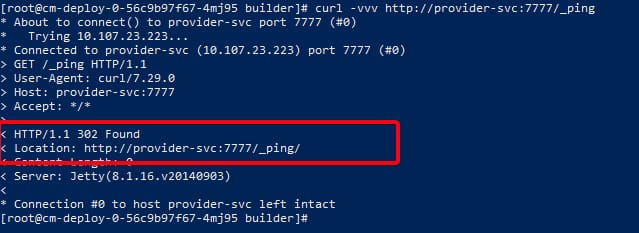
Now, we can go to any container in the cluster that has “curl” installed or any other way to launch a request like this one with the HTTP 200 code and the message “Application is running”.

NOTE: If you forget the last / and try to invoke _ping instead of _ping/ you’re going to get an HTTP 302 Found code with the final location as you can see here:
Ok, let’s see what happens if now we stop the application. To do that we’re going to go inside the container and use the OSGi console.
To do that once you’re inside the container you execute the following command:
ssh -p 1122 equinox@localhost
It is going to ask for credentials and use the default password ‘equinox’. After that is going to give you the chance to create a new user and you can use whatever credentials work for you. In my example, I’m going to use admin / adminadmin (NOTE: Minimum length for a password is eight (8) characters.

And now, we’re in. And this allows us the option to execute several commands, as this is not the main topic for today I’m going to skip all the explanation but you can take a look at this link with all the info about this console.
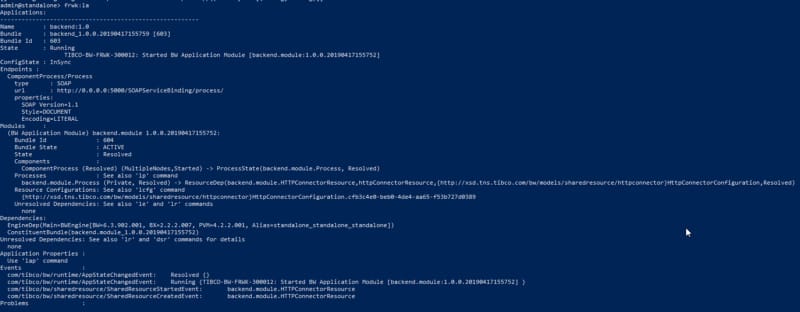
If we execute frwk:la is going to show the applications deployed, in our case the only one, as it should be in BusinessWorks Container Edition application:
To stop it, we are going to execute the following command to list all the OSGi bundle we have at the moment running in the system:
frwk:lb
Now, we find the bundles that belong to our application (at least two bundles (1 per BW Module and another for the Application)
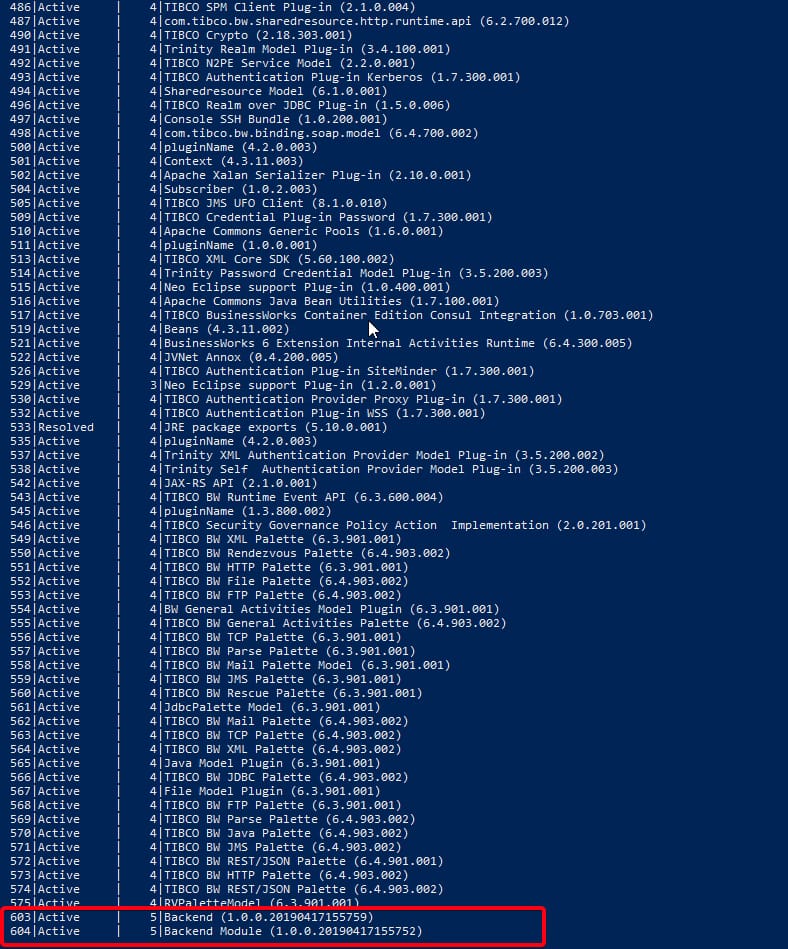
And now we can stop it using felix:stop <ID>, so in my case, I need to execute the following commands:
stop “603”
stop “604”

And now the application is stopped
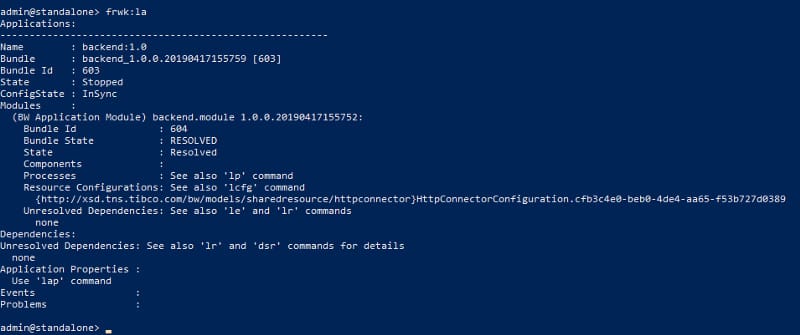
So, if now we try to launch the same curl command as we executed before, we’re getting the following output:

As you can see an HTTP 500 Error which means something is not fine. If now we try to start again the application using the start bundle command (equivalent to the stop bundle command that we used before) for both bundles of the application, you are going to see that the application says is running again:
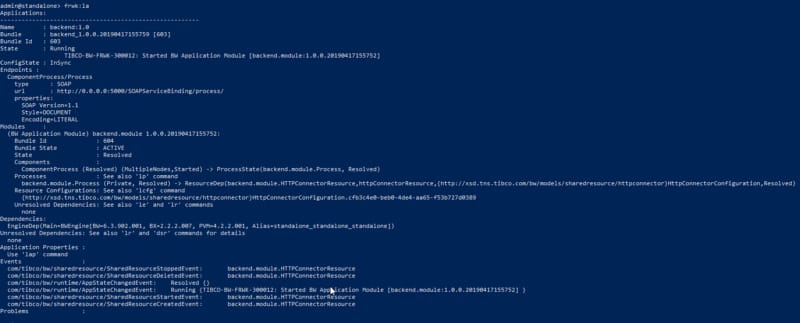
And the command has the HTTP 200 output as it should have and the message “Application us running”

So, now, after knowing how the _ping/ endpoint works we only need to add it to our deployment.yml file from Kubernetes. So we modified again our deployment file to be something like this:
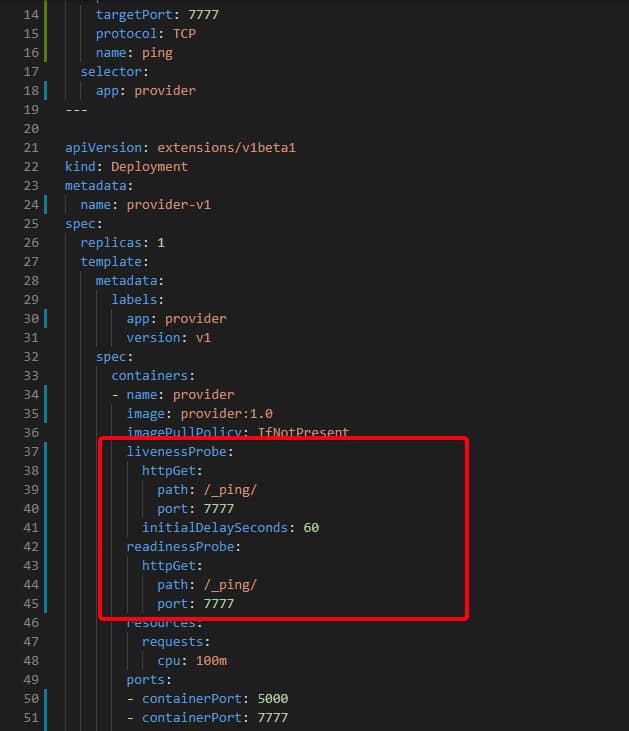
NOTE: It’s quite important the presence of initialDelaySeconds parameter to make sure the application has the option to start before start executing the probe. In case you don’t put this value you can get a Reboot Loop in your container.
NOTE: Example shows port 7777 as an exported port but this is only needed for the steps we’ve done before and you will not be needed in a real production environment.
So now we deploy again the YML file and once we get the application running we’re going to try the same approach, but now as we have the probes defined as soon as I stop the application containers has going to be restarted. Let’s see!
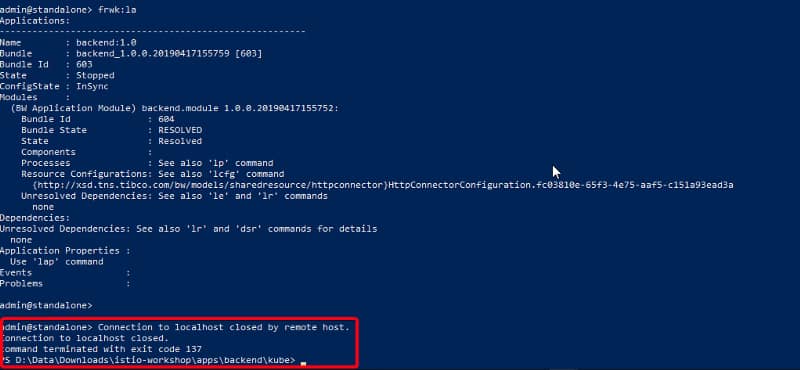
As you can see in the picture above after the application is Stopped the container has been restarted and because of that, we’ve got expelled from inside the container.
So, that’s all, I hope that helps you to set up your probes and in case you need more details, please take a look at the Kubernetes documentation about httpGet probes to see all the configuration and option that you can apply to them.

