Your Weekly Summary of What I Found More Relevant in the Cloud-Native Ecosystem.
Summary
On this issue, I decided to bring some articles that cover different aspects of cloud-native “politics”.
We will start with a deep look at the decision on Grafana Labs to release Mimir and how that affects other open-source project such as Cortex which is being used in several big enterprises and other solutions.
We will continue talking about the reasons behind the shocking decision for Istio project to finally be recognized as a CNCF project
And we will end with one article that tries to wipe out some of the initial thoughts that cloud-native and Kubernetes it is only useful for public-cloud environments and how they can also help you modernize while you keep and manage your own hardware. Come with me on this journey!
Stories
Quote
Do not go where the path may lead, go instead where there is no path and leave a trail.
Ralph Waldo Emerson
Send me you feedback
Contact me using this link to give me your view and feedback for this new issue and also to recommend any other story that you think it should reach this spot.
ServiceMonitor and PodMonitor are terms that you will start to see more often when talking about using Prometheus. We have covered a lot about Prometheus in the past articles. It is one of the primary references when we talk about monitoring in a cloud-native environment and is specially focused on the Kubernetes ecosystem.
Prometheus has a new deployment model under the Kubernetes Operator Framework in recent times. That has generated several changes in terms of resources and how we configure several aspects of the monitoring of our workloads. Some of these concepts are now managed as Customer Resource Definition (CRD) that are included to simplify the system’s configuration and be more aligned with the capabilities of the Kubernetes platform itself. This is great but, at the same time, changes how we need to use this excellent monitoring tool for cloud-native workloads.
Today, we will cover two of these new CRDs, one of the most relevant ones: ServiceMonitor and PodMonitor. These are the new objects that specify the resources that will be under monitoring scope to the platform, and each of them covers a different type of object, as you can imagine: Services and Pods.
Each of them has its definition file with its particular fields and metadata, and to highlight them, I will present a sample for each of them below:
As you can see, the definitions of the components are very similar and very intuitive, focusing on the selector to detect which pods or services we should monitor and some data regarding the specific target of the monitoring, so Prometheus knows how to scrape them.
If you want to take a look more in detail at any option you can configure on this CRD, I would recommend you to take a look at this URL which includes a detailed field to field documentation of the most common CRDs:
PodMonitor.monitoring.coreos.com/v1
Automatic documentation for your CustomResourceDefinitions.
These components will belong to the definition of your workloads, which means that the creation and maintenance of these objects will be from the application’s developers.
That is great because several reasons:
It will include the Monitoring aspect of the component itself, so you will never forget the add the configuration from a specific component. That means it can be included in the duplicate YAML files or Helm Chart or a Kustomize resources as another needed resource.
It will de-centralize the monitoring configuration making it more agile, and it will progress as the software components do it.
It will reduce the impact on other monitored components as there is no need to act in any standard file or resource, so any different workloads will continue to work as expected.
Both objects are very similar in their purposes as both of them scrape all the endpoints that match the selector that we added. So, in which cases should I use one or the other?
The answer will be straightforward. By default, you will go with a ServiceMonitor because it will provide the metrics from the service itself and each of the endpoints that the service has, so each of the pods that are implementing the service will be discovered and scraped as part of this action.
So, in which cases should I use PodMonitor? Where the workload you are trying to monitor doesn’t act behind a service, so as there is no service defined, you cannot use ServiceMonitor. Do you want some examples of those? Let’s bring some!
Services that interact using other protocols that are not HTTP-based, such as Kafka, SQS/SNS, JMS, or similar ones.
Components such as CronJobs, DaemonSets, or non exposing any incoming connection model.
So I hope this article will help you understand the main difference between those objects and go a little deeper into how the new Prometheus Operator Framework resources work. We will continue covering other aspects in upcoming posts.
Your Weekly Summary of What I Found More Relevant in the Cloud-Native Ecosystem.
Summary
On this issue, I decided to bring some articles that covers different perspective of several relevant topics we usually cover here such as: Automation, Security or Messaging.
We will start by a deep look to the internals of one of the most popular messaging system such as Kafka, with several videos we will see the principles about this great system to be able to use it at its maximum.
We will continue talking about security again, this time about the new features included into the Docker Desktop focusing on creating a bill of materials of the images
And we will end with one article about one of the most famous open-source tools for automation such as Terraform and what are the next steps to scale your platform using Terraform! I hope you like this selection as much as I did.
Stories
Quote
If you set your goals ridiculously high and it’s a failure, you will fail above everyone else’s success. –
James Cameron
Send me you feedback
Contact me using this link to give me your view and feedback for this new issue and also to recommend any other story that you think it should reach this spot.
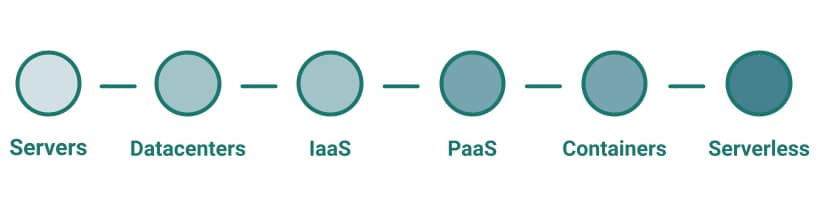
Serverless always has been considered the next step in the cloud journey. You know what I mean: you start from your VM on-premises, then you move to have containers on a PaaS platform, and then you try to find your next stop in this journey that is serverless.
Technological evolution defined based on infrastructure abstraction perspective
Serverless is the idea of forgetting about infrastructure and focusing only on your apps. There is no need to worry about where it will run or the management of the underlying infrastructure. Serverless has started as a synonym of the Function as a Service (FaaS) paradigm. It has been populated first by the Amazon Lambda functions and later by all the major cloud providers.
It started as an alternative to the containerized approach that probably requires a lot of technical skills to manage and run at a production scale, but this is not the case anymore.
We have seen how the serverless approach has reached any platform despite this starting point. Following the same principles, we have different platforms that its focus is to abstract all technical aspects for the operational part and provide a platform where you can put your logic running. Pretty much every SaaS platform covers this approach but I would like to highlight some samples to clarify:
netlify is a platform that allows you to deploy your web application without needing to manage anything else that the code needed to run it.
TIBCO Cloud Integration is an iPaaS solution that provides all the technical resources you could need so you can focus on deploying your integration services.
But going beyond that, pretty much each service provided by the major cloud platform such as Azure, AWS, or GCP follows the same principle. Most of them (messaging, machine learning, storage, and so on) abstract all the infrastructure underlying it so you can focus on the real service.
Going back to the Kubernetes ecosystem we have two different layers of that approach. The main one is the managed Kubernetes services that all big platforms provide where all the management of the Kubernetes (master nodes, internal Kubernetes components) are transparent to you and you center everything on the workers. And the second level is what you can get in the AWS world with the EKS + Fargate kind of architecture where not even the worker nodes exist, you have your pods that will be deployed on a machine that belongs to your cluster but you don’t need to worry about it, or manage anything related to that.
So as we have seen serverless approach is coming to all areas but this is not the scope of this article. The idea here is to try to focus on the serverless as a synonym of Function as a Service and (FaaS) and How we can bring the FaaS experience to our productive K8S ecosystem. But let’s start with the initial questions:
Why would we like to do that?
This is the most exciting thing to ask: what are the benefits this approach provides? Function as a Service follows the zero-scale approach. That means that the function is not loaded if they are not being executed, and this is important, especially when you are responsible for your infrastructure or at least paying for it.
Imagine a normal microservices written in any technology, the amount of resources it can use depends on its load, but even without any load, you need some resources to keep it running; mainly, we are talking about memory that you need to stay in use. The actual amount will depend on the technology and the development itself, but it can be moved from some MB to some hundreds. If we consider all the microservices a significant enterprise can get, you will get a difference of several GB that you are paying for that are not providing any value.
But beyond the infrastructure management, this approach also plays very well with another of the latest architectural approaches, the Event-Driven Application (EDA), because we can have services that are asleep just waiting for the right event to wake them up and start processing.
So, in a nutshell, the serverless approach helps you get your optimized infrastructure dream and enable different patterns also in an efficient way. But what happens is I already own the infrastructure? It will be the same because you will run more services in the same infrastructure, so you will still get the optimized use of your current infrastructure.
What do we need to enable that?
The first thing that we need to know is that not all technologies or frameworks are suitable to run on this approach. That is because you need to meet some requirements to be able to do that as a successful approach, as shown below:
Quick Startup: If your logic is not loaded before a request hits the service, you will need to make sure the logic can load quickly to avoid impacting the consumer of the service. So that means that you will need a technology that can load in a small amount of time, usually talking in the microsecond range.
Stateless: As your logic is not going to be loaded in a continuous mode it is not suitable for stateful services.
Disposability: Similar to the previous point it should be ready for graceful shutdown in a robust way
How do we do that?
Several frameworks allow us to get all those benefits that we can incorporate into our Kubernetes ecosystem, such as the following ones:
KNative: This is the framework that the CNCF Foundation supports and is being included by default in many Kubernetes distributions such as Red Hat Openshift Platform.
Home – Knative
Knative Documentation
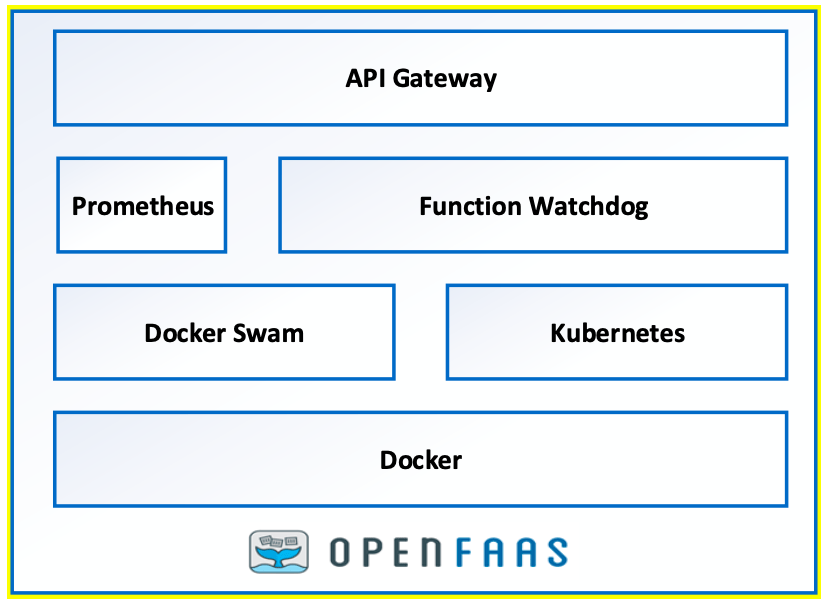
OpenFaaS: This is a well-used framework created by Alex Ellis that supports the same idea.
Home
Serverless Functions Made Simple with Kubernetes.
It is true that there are other alternatives such as Apache OpenWhisk, Kubeless, or Fission but there less used in today’s world and mainly most alternative has been chosen between OpenFaaS and KNative but if you want to read more about other alternatives I will let you an article about the CNCF covering them so you can take a look for yourself:
Serverless Open-Source Frameworks: OpenFaaS, Knative, & more | Cloud Native Computing Foundation
Originally published on the Epsagon blog by Ran Ribenzaft, co-founder and CTO at Epsagon This article will discuss a few of the frameworks mentioned above and will go deep into OpenFaaS and Knative to…
Your Weekly Summary of What I Found More Relevant in the Cloud-Native Ecosystem.
Summary
On this issue, I decided to bring some introductory articles to provide the foundation of important concepts in the industry now but also that it will continue to be relevant in the upcoming future.
We will start by talking about managing and operationg big workloads in Kubernetes with the use of the well-known package manager for cloud-native workloads Helm, where you will have a great view on what is and how start using it in your cluster.
We will continue with one of the game changer in the operation and infrastructure managmenet such as the GitOps movement and see how this will impact all different kind of roles even developers on its journey.
And we will end with one articles covering the most used protocols today to expose synchronous services (REST, GraphQL and gRPC) so you can know the characteristics of each of them and where to use one or the other.
Stories
Quote
The way to get started is to quit talking and begin doing.
Walt Disney
Send me you feedback
Contact me using this link to give me your view and feedback for this new issue and also to recommend any other story that you think it should reach this spot.
Solving one of the most common developer issues using BusinessWorks
The Transformation failed for XSLT input is one of the most common error messages you could see when developing using the TIBCO BusinessWorks tools. Understanding what the message is saying is essential to provide a quick solution.
I have seen developers needing hours and hours trying to troubleshoot this kind of error when most of the time, all the information you are receiving is just in front of you, but you need to understand why the engine is aching for it.
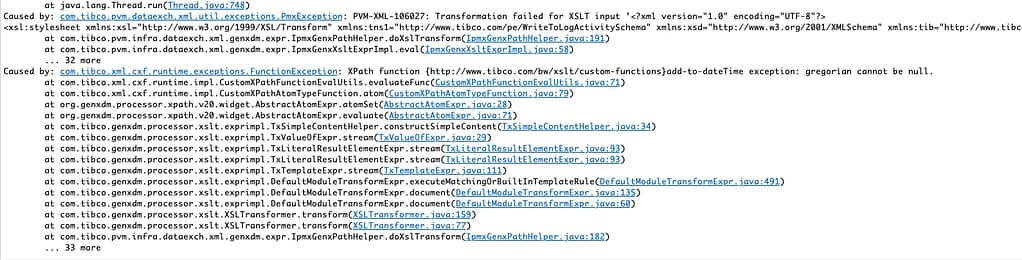
But let’s provide a little bit of context first. What is this error that we’re talking about? I’m talking about something like what you can see in the log trace below:
...
com.tibco.pvm.dataexch.xml.util.exceptions.PmxException: PVM-XML-106027: Transformation failed for XSLT input '<?xml version="1.0" encoding="UTF-8"?>
<xsl:stylesheet xmlns:xsl="http://www.w3.org/1999/XSL/Transform" xmlns:tns1="http://www.tibco.com/pe/WriteToLogActivitySchema" xmlns:xsd="http://www.w3.org/2001/XMLSchema" xmlns:tib="http://www.tibco.com/bw/xslt/custom-functions" version="2.0"><xsl:param name="Mapper2"/><xsl:template name="Log-input" match="/"><tns1:ActivityInput><message><xsl:value-of select="tib:add-to-dateTime($Mapper2/primitive,0,0,1,0,0,0)"/></message></tns1:ActivityInput></xsl:template></xsl:stylesheet>'
	at com.tibco.pvm.infra.dataexch.xml.genxdm.expr.IpmxGenxXsltExprImpl.eval(IpmxGenxXsltExprImpl.java:65)
	at com.tibco.bx.core.behaviors.BxExpressionHelper.evalAsSubject(BxExpressionHelper.java:107)
...
Sounds more familiar now? As I already said, all TIBCO BusinessWorks developers have faced that. As I said, I have seen some of them struggling or even re-doing the job repeatedly without finding a proper solution. But the idea here is to try to solve it efficiently and quickly.
I will start with the initial warnings: Let’s avoid re-coding, re-doing something that should work but is not working, because you are not winning in any scenario:
If you re-do it again and it didn’t work, you lose x2 time creating something you already have, and you are still stuck.
If you re-do it again and it works, you don’t know what was wrong, so that you will face it again shortly.
So, how do this works? Let’s use this process:
Collect —> Analyze —> Understand —> Fix.
Scenario
So first, we need to collect data, and most of the time, as I said, it is enough with the log trace that we have, but at some moment, you could need to require the code of your process to detect the error the solution.
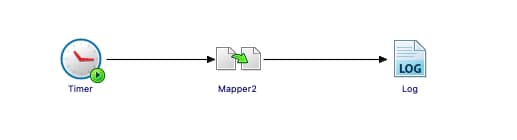
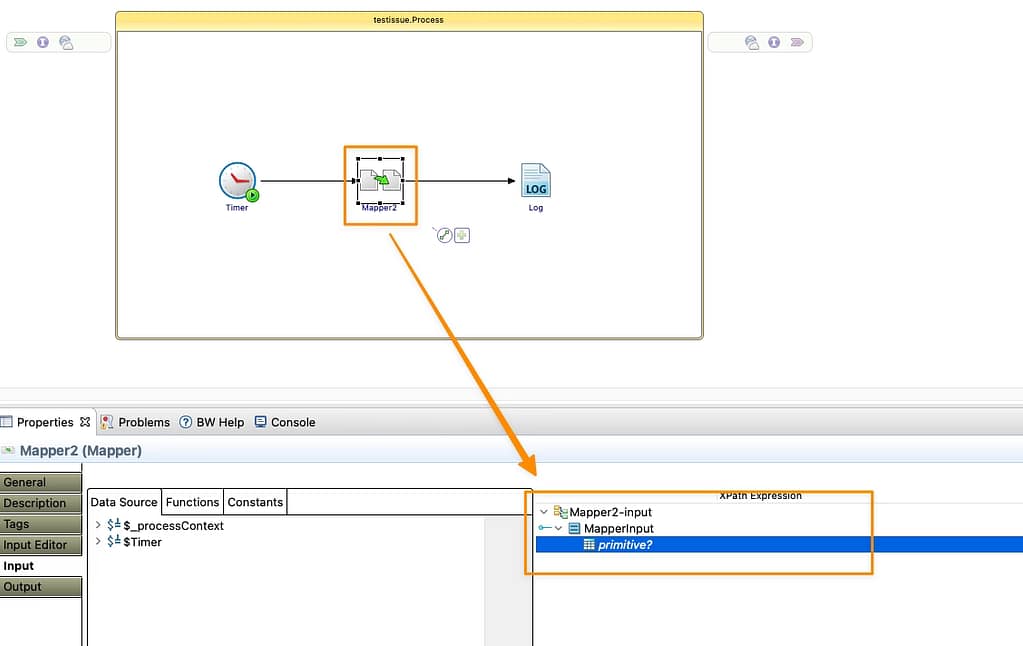
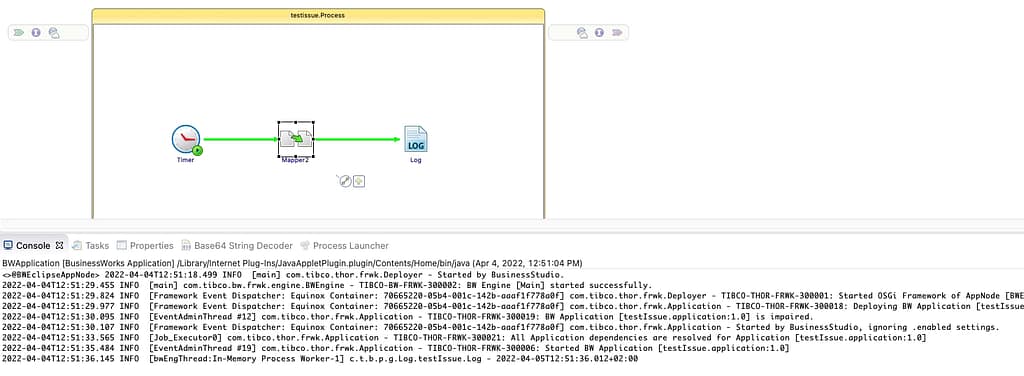
So we will start with this source code that you can see in the screenshot below and the following explanation:
We have a Mapper that is defining a schema with an int element that is an option, and we’re not providing any value:
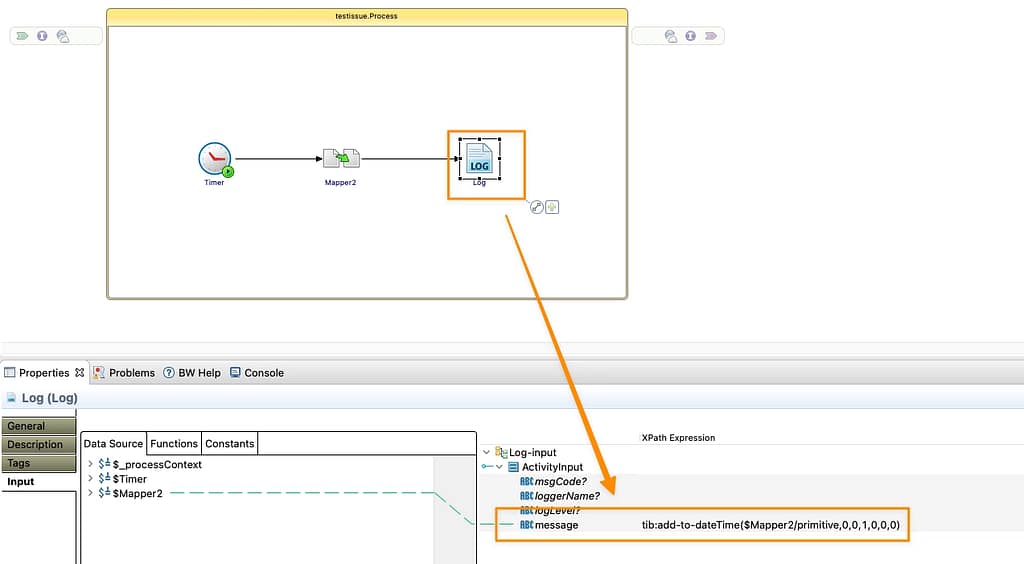
And then we’re using the date to print a log, adding one more day to that date:
Solution
First, we need to understand the error message. When we’re getting an error message titled `Transformation failed for XSLT input that says precisely this:
I tried to execute the XSLT that is related to one activity, and I failed because of a technical error
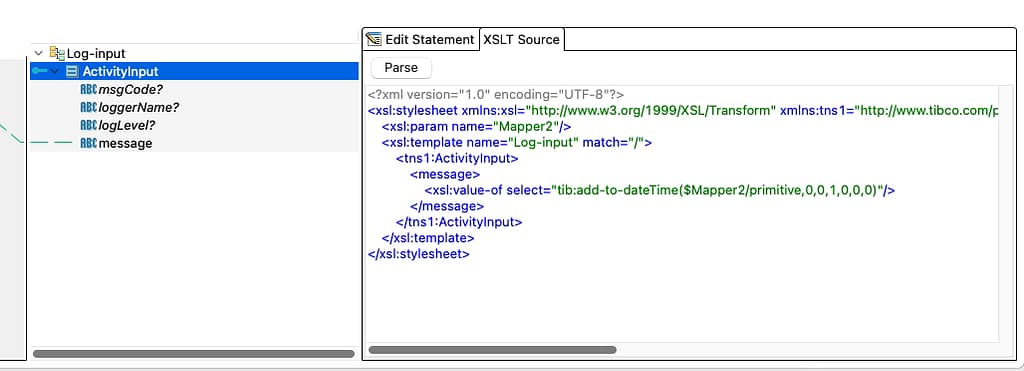
As probably you already know, each of the BusinessWorks activities executed an XSL Transformation internally to do the Input mapping; you can see it in the Business Studio directly. So, this error is telling you that this internal XSL is failing.
And the reason is a run-time issue that cannot be detected at design time. So, to make it clear, the values of some of your variables and transforming fail. So first, you should focus on this. Usually, all the information is in the log trace itself, so let’s start analyzing that:
So, let’s see all the information that we have here:
First of all, we can detect what activity is failing. You can easily do that if you are debugging locally, but if this is happening on the server can be more tricky; but with this information, you have: All the XSLT itself that is printed on the log trace, so you can easily
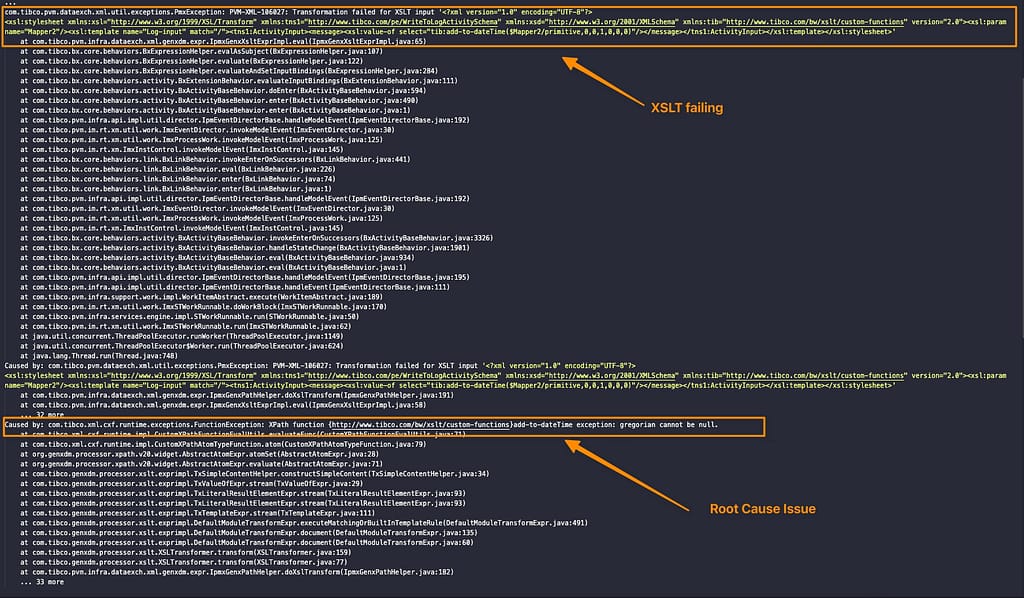
You also have a Caused by that is telling you why this is failing:
You can have several Caused by sentences that should be reading in cascading mode, so the lower one is the root issue generating the error for all the others above, so we should locate that first.
In this case, the message is quite evident, as you can see in the trace below.
com.tibco.xml.cxf.runtime.exceptions.FunctionException: XPath function {http://www.tibco.com/bw/xslt/custom-functions}add-to-dateTime exception: gregorian cannot be null.
So the add-to-dateTime function fails because one Gregorian argument (so, a date) is null. And that’s precisely what is happening in my case. If I provide a value to the parameter… Voilà, it is working!
Summary
Similar situations can happen with different root causes, but the most commons are:
Issue with optional and not optional elements so a null reaches a point where it should.
Validation errors because the input parameter doesn’t match the field definition.
Extended XML Types that are not supported by the function used.
All these issues can be easily and quickly solved following the reasoning we explained in this post!
So, let’s put it into practice next time you see a colleague with that issue and help them have a more efficient programming experience!
One of the usual conversations is about the composition and definition of components inside a Pod. This is normal for people moving from traditional deployment to a cloud-native environment, and the main question is: How many containers can I have inside a pod?
I’m sure that most of you have heard or have asked that question at some point on your cloud-native journey, or even you have this doubt internally at this moment, and there is no doubt on the answer: One single container.
Wait, wait!! Don’t leave the post yet! We know that is not technically true, but it is easier to understand initially; you can only have a pod doing one thing.
So, if that’s the case, why do the multi container pods exist? And most importantly, if this is the first time you have heard that concept, what is a multi container pod?
Let’s start with the definition: A multi container pod has more than one container in its composition. And when we are talking about multi container, we are not talking about having some initContainers to manage the dependencies. Still, we are talking about having more than one container run simultaneously and at the same level, as you can see in the picture below:
Multi Container Pod Definition
Does Kubernetes support this model? Yes, for sure. You can define inside your containers section as many containers as you need. So, from a technical view, there is no limit to having as many containers as you need in the same pod. But the main question you should ask yourself is:
Is this what you want to do?
A pod is the smallest unit in Kubernetes as a reminder. You deploy and undeploy pods, stop and start pods, restart pods, scale pods. So anything that is inside the same pod is highly coupled. It’s like a bundle, and they also share resources. So it is even more critical.
Imagine this situation, I’d like to buy a notebook, so I go to the shop and ask for the notebook, but they don’t have a single notebook. Still, they have an incredible bundle: a notebook, a pen, and a stapler just for $2 more than a single notebook price.
So you think that this is an excellent price because you are getting a pen and a stapler for a small part of their price if you would like to buy it in isolation. So you think that’s a good idea. But then, you remind that you also need other notebooks for other purposes. In the end, you need ten more notebooks, but when you need to buy them, you also need to acknowledge the ten pens and ten staplers that you don’t need anymore. OK, there are cheaper, but in the end, you are paying a reasonable price for something that you don’t need. So, it is not efficient. And the same applies to the Pod structure definition.
In the end, you move from traditional monolith deployments to different containers inside a pod to have the same challenges and issues? What is the point of doing that?
None.
If there is no reason to have two containers tightly together, why is this allowed in the K8S specification? Because this is useful for some specific use-cases and scenarios. Let’s talk about some of them.
Helper Containers: This is the most common one and is that you have different containers inside the pod. Still, one is the main one, the one that provides a business capability or a feature, and the other is just helping in some way.
Sidecar Pattern Implementation: Another common approach to have this composition is implementing the sidecar pattern. This is how it works by deploying another container to perform a specific capability. You have seen it, for example, for Service Meshes, Log Aggregation Architecture, or other components that follow that pattern.
Monitoring Exporters: Another usual see to thing do is to use one of these containers to act as an exporter for the monitoring metrics of the main component. This is usually seen on architectures such as Prometheus, where each piece has its exporter to be scraped from the Prometheus Server
There are also exciting facts of sharing containers inside a pod because, as commented, they also share resources such as:
Volumes: You can, for example, define a shared folder for all the different containers inside a pod, so one container can read information for the other to perform its task quickly and efficiently.
Inter-process Communication: You can communicate between containers using IPC to communicate more efficiently.
Network: The different containers inside a pod can also access ports from other containers just reaching localhost.
I hope this article has helped you understand why this capability of having many containers inside the same pod exists, but at the same time to know which kind of scenarios are using this approach and having some reasoning about if a new use-case should be used this approach or not.
Your Weekly Summary of What I Found More Relevant in the Cloud-Native Ecosystem.
Summary
On this issue, I decided to include the articles that impacted me the most, and at the same time, I think it can provide great content to you if you come with me on this journey.
We will start by talking about the critical concepts at the core of the container world and how to stop letting the word Docker confuse us all to refer to different components and projects.
We will continue with one of the essential standards for the near future, such as OpenTelemetry, the way to go since today to enable an interoperable distributed tracing strategy.
And we will end with one of the ways to shift left security in our processes by including security and other kinds of checks even before the code reach the repository.
Stories
Quote
The greatest glory in living lies not in never falling, but in rising every time we fall.
Nelson Mandela
Send me you feedback
Contact me using this link to give me your view and feedback for this new issue and also to recommend any other story that you think it should reach this spot.
One of the most common things we have to do when testing and debugging our cloud-native workloads on Kubernetes is to check the network communication.
It could be to check the incoming traffic you are getting so we can inspect the requests we are receiving and see what we are replying to and similar kinds of use-cases. I am sure this sounds familiar to most of you.
I usually solve that using tcpdump on the container, similar to what I would do in a traditional environment, but this is not always easy. Depending on the environment and configuration, you cannot do so because you need to include a new package in your container image, do a new deployment, so it is available, etc.
So, to solve that and other similar problems, I discovered a tool named Mizu, which I would like to have found a few months ago because it would help me a lot. Mizu is precisely that. In its own words:
Mizu is a simple-yet-powerful API traffic viewer for Kubernetes, enabling you to view all API communication between microservices across multiple protocols to help you debug and troubleshoot regressions.
Mizu – API Traffic viewer for Kubernetes
A simple-yet-powerful API traffic viewer for Kubernetes to help you troubleshoot and debug your microservices. Think TCPDump and Chrome Dev Tools combined.
To install, it is pretty straightforward. You need to grab the binary and provide the correct permission on your computer. You have a different binary for each architecture, and in my case (Mac Intel-based), these are the commands that I executed:
And that’s it, then you have a binary in your laptop that connects to your Kubernetes cluster using Kubernetes API, so you need to have configured the proper context.
In my case, I have deployed a simple nginx server using the command:
kubectl run simple-app --image=nginx --port 80
And once that the component has been deployed, as it is shown in the Lens screenshot below:
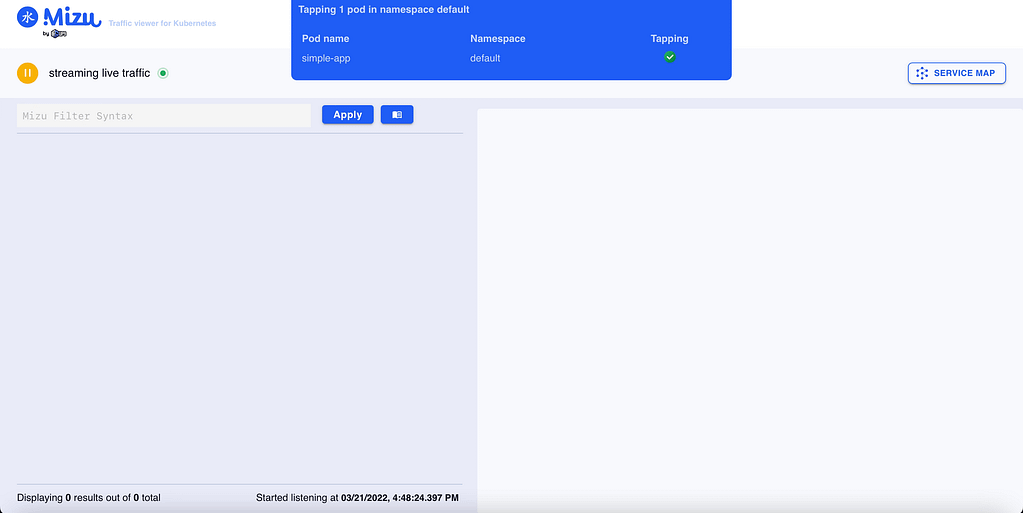
I ran the command to launch mizu from my laptop:
mizu tap
And after a few seconds, I have in front of me a webpage opened monitoring all traffic happening in this pod:
I have made the nginx port expose using the kubectl expose command:
kubectl expose pod/simple-app
And after that, I deployed a temporary pod using the curl image to start sending some requests with the command shown below:
kubectl run -it --rm --image=curlimages/curl curly -- sh
now I’ve started to send some requests to my nginx pod using curl:
curl -vvv http://simple-app:80
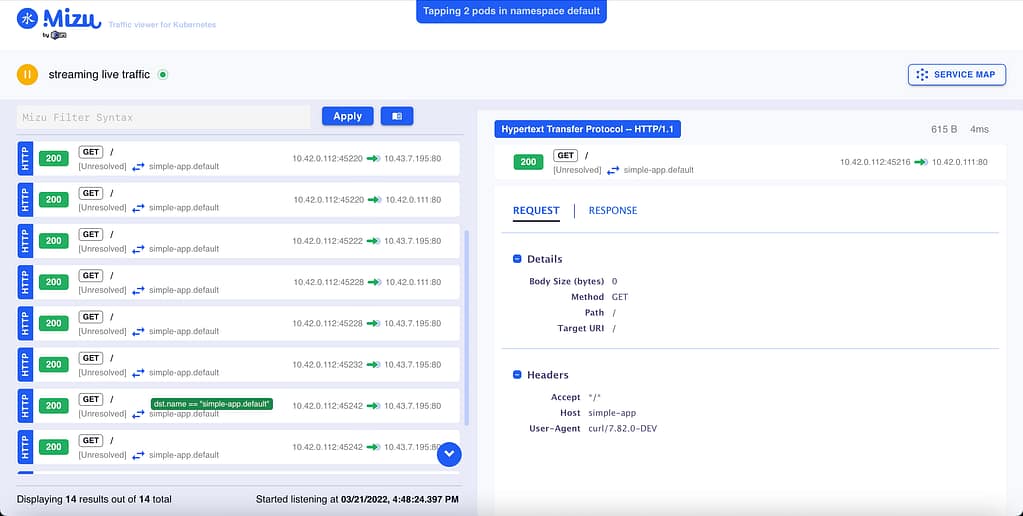
And after a few calls, I could see a lot of information in front of me. First of all, I can see the requests I was sending with all the details of it:
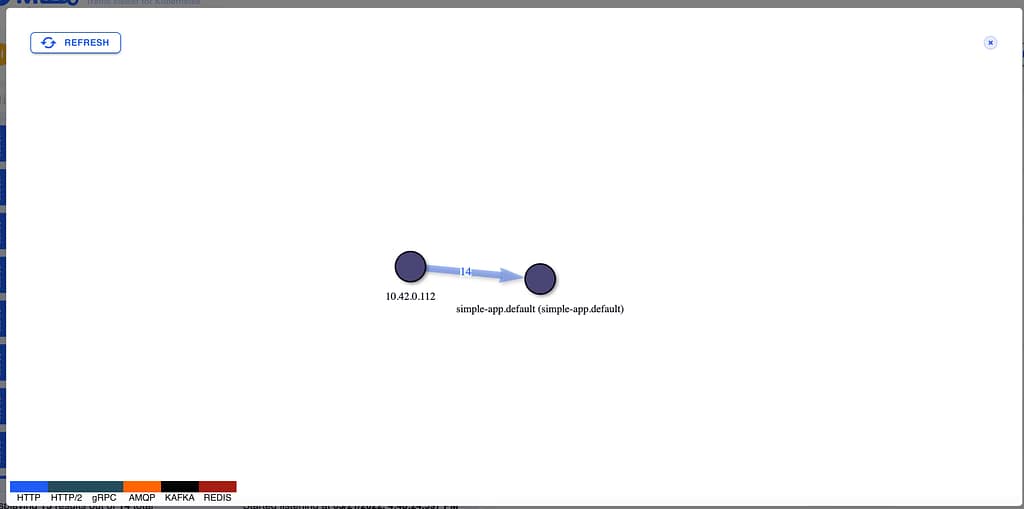
But even more important, I can see a service map diagram showing the dependencies and the calls graphically happening to the pod with the response time and also the protocol usage:
This will not certainly replace a complete observability solution on top of a service mesh. Still, it will be a beneficial tool to add to your toolchain when you need to debug a specific communication between components or similar kinds of scenarios. As commented, it is like a high-level tcpdump for pod communication.
One of the great things about container-based developments idefiningne isolation spaces where you have guaranteed resources such as CPU and memory. This is also extended on Kubernetes-based environments at the namespace level, so you can have different virtual environments that cannot exceed the usage of resources at a specified level.
A resource quota, defined by a ResourceQuota object, provides constraints that limit aggregate resource consumption per namespace. It can limit the quantity of objects that can be created in a namespace by type, as well as the total amount of compute resources that may be consumed by resources in that namespace.
You have several options to define the usage of these Resource Quotas but we will focus on this article on the main ones as follows:
limits.cpu: Across all pods in a non-terminal state, the sum of CPU limits cannot exceed this value.
limits.memory: Across all pods in a non-terminal state, the sum of memory limits cannot exceed this value.
requests.cpu: Across all pods in a non-terminal state, the sum of CPU requests cannot exceed this value.
requests.memory: Across all pods in a non-terminal state, the sum of memory requests cannot exceed this value.
So you can think that this is a great option to define a limit.cpu and limit.memory quota, so you make sure that you will not extend that amount of usage by any means. But you need to be careful about what this means, and to illustrate that I will use a sample.
I have a single workload with a single pod with the following resource limitation:
requests.cpu: 500m
limits.cpu: 1
requests.memory: 500Mi
limits.memory: 1 GB
Your application is a Java-based application that exposes a REST Service ant has configured a Horizontal Pod Autoscaler rule to scale when the amount of CPU exceeds its 50%.
So, we start in the primary situation: with a single instance that requires to run 150 m of vCPU and 200 RAM, so a little bit less than 50% to avoid the autoscaler. But we have a Resource Quota about the limits of the pod (1 vCPU and 1 GB) so we have blocked that. We have more requests and we need to scale to two instances. To simplify the calculations, we will assume that we will use the same amount of resources for each of the instances, and we will continue that way until we reach 8 instances. So lets’ see how it changes the limits defined (the one that will limit the number of objects I can create in my namespace) and the actual amount of resources that I am using:
So, for resources used amount of 1.6 vCPU I have blocked 8 vCPU, and in case that was my Resource Limit, I cannot create more instances, even though I have 6.4 vCPU not used that I have allowed deploying because of this kind of limitation I cannot do it.
Yes, I am able to ensure the principle that I never will use more than 8 vCPU, but I’ve been blocked very early on that trend affecting the behavior and scalability of my workloads.
Because of that, you need to be very careful when you are defining these kinds of limits and making sure what you are trying to achieve because to solve one problem you can be generating another one.
I hope this can help you to prevent this issue for happening in your daily work or at least to keep it in mind when you are facing similar scenarios.