All Companies are moving towards a transformation, changing the current workloads on application servers running on virtual machines on a Data Center towards a cloud-native architecture where applications have been decomposed on different services that run as isolated components using containers and managing by a Kubernetes-based platform.
We started with the easiest use-cases and workloads moving our online services, mainly REST API that works on a load-balancing mode, but the issues began when we moved other workloads to follow the same transformation journey.
Kubernetes platform was not ready at the time. Most of their improvements have been made to support more use-cases. Does that mean that REST API is much more cloud-native than an application that requires a file-storage solution? Absolutely Not!
We were confusing different things. Cloud-native patterns are valid independent of those decisions. However, it is true that in the journey to the cloud and even before, there were some patterns that we tried to replace, especially File-based. But this is not because of the usage of the file itself. It is was more about the batch approach that was closely related to the use of files that we try to replace for several reasons, such as the ones below:
The online approach reduces time to action: Updates and notifications come faster to the target, so components are current.
File-based solutions reduce the solution’s scalability: You generate a dependency with a central component that has a more complex scalability solution.
But this path is being eased, and the last update on that journey was the Access Modes introduced by Kubernetes. Access Mode defines how the different pods will interact with one specific persistent volume. The access modes are the ones shown below.
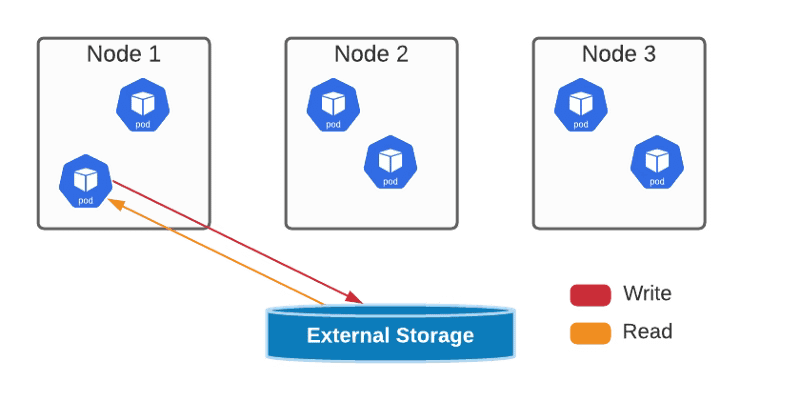
ReadWriteOnce — the volume can be mounted as read-write by a single node
ReadWriteOnce AccessMode Graphical Representation
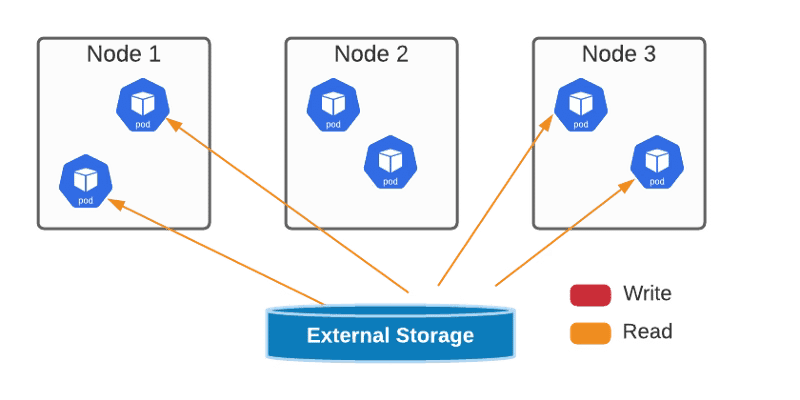
ReadOnlyMany — the volume can be mounted read-only by many nodes.
ReadOnlyMany AccessMode Graphical Representation
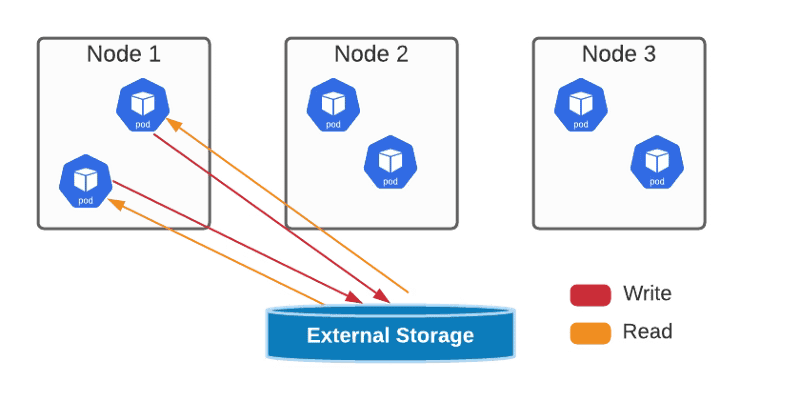
ReadWriteMany — the volume can be mounted as read-write by many nodes
ReadWriteMany AccessMode Graphical Representation
ReadWriteOncePod — the volume can be mounted as read-write by a single Pod. This is only supported for CSI volumes and Kubernetes version 1.22+.
You can define the access mode as one of the properties of your PVs and PVCs, as shown in the sample below:
kind: PersistentVolumeClaim
apiVersion: v1
metadata:
 name: single-writer-only
spec:
 accessModes:
 - ReadWriteOncePod # Allow only a single pod to access single-writer-only.
 resources:
 requests:
 storage: 1Gi
All of this will help us on our journey to have all our different kinds of workloads achieving all the benefits from the digital transformation and allowing us as architects or developers to choose the right pattern for our use-case without being restricted at all.
I want to start this article with a story that I am not sure all of you, incredible readers, know. It was a time that there were no graphical interfaces to monitor your containers. It was a long time ago, understanding a long time as we can do in the container world. Maybe this was 2014-2015 when Kubernetes was in its initial stage, and also, Docker Swarm was just released and seemed the most reliable solution.
So most of us didn’t have a container platform as such. We just run our containers from our own laptops or small servers for cutting-edge companies using docker commands directly and without more help than the CLI tool. As you can see, things have changed a lot since then, and if you would like to refresh that view, you can check the article shared below:
Discover Your Perfect Tool for Managing Kubernetes
Maximizing the productivity of working with Kubernetes Environment with a tool for each persona Photo by Christina @ wocintechchat.com on Unsplash We all know that Kubernetes is the default environment for all our new applications we developed we will build. The flavor of that Kubernetes platform can be of different ways and forms, but one thing is […]
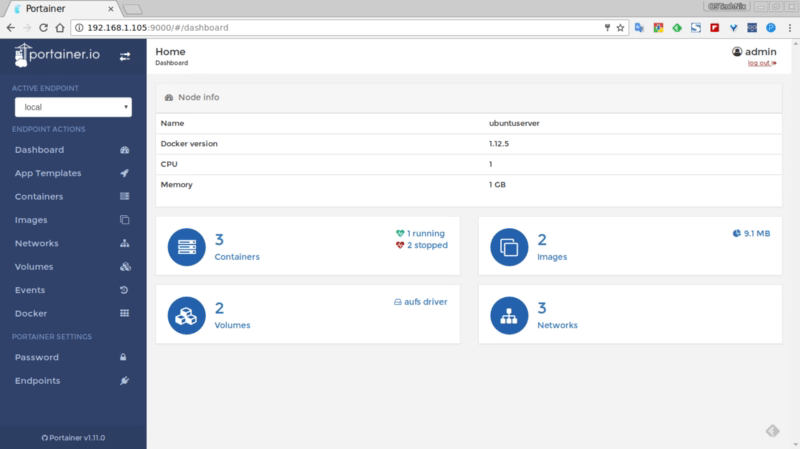
And at that time, an open-source project provides the most incredible solution because we didn’t know that we needed that until we use it, and that option was portainer. Portainer provides a very awesome web interface where you can see all the docker containers deployed on your docker host and deploy as another platform.
It was the first one and generated a tremendous impact, even generated a series of other projects that were named: the portainer of… like dodo the portainer of Kubernetes infrastructure at that time.
But maybe you can ask.. and how is portainer doing? is still portainer a thing? It is still alive and kicking, as you can see on their GitHub project page: https://github.com/portainer/portainer, with the last release in the last of May 2021.
Now they have a Business version but still as Comunity Edition one that is the one that I am going to be analyzing here in more detail in another article. Still, I would like to provide some initial highlights:
Installing process still follows the same approach as the initial releases to be another component of your cluster. The options to be used in Docker, Docker Swarm, or Kubernetes cover all the main solutions all enterprise uses.
Introduction – Portainer Documentation
These instructions are for Portainer Community Edition (CE). For Portainer Business Edition (BE), see the BE documentation.
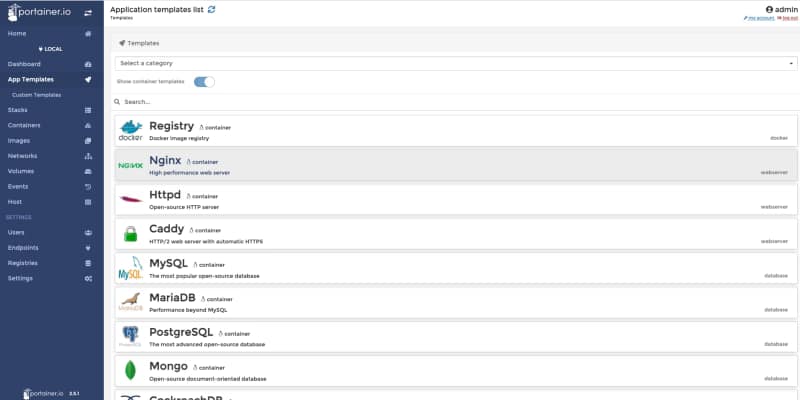
Provides now a list of application templates similar to the Openshift Catalog list, and also, you can create your own ones. This is very useful for companies that usually rely on these templates to allow developers to use a common deployment approach without needing to do all the work.
Portainer 2.5.1 Application Template view
Team Management capabilities can define users with access to the platform and group those users as part of the team to a more granular permission management.
Multi-registry support: By default, it will be integrated with Docker Hub, but you can add your own registries as well and be able to pull images directly from those directly from the GUI.
In summary, this is a great evolution of the portainer tool while keeping the same spirit that all the old users loved at that time: Simplicity and Focus on what an Administrator or Developer needs to know, but also adding more features and capabilities to keep the pace of the evolution in the container platform industry.
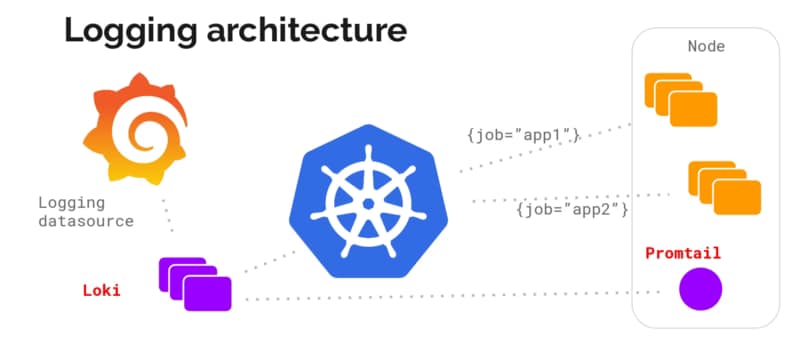
Promtail is the solution when you need to provide metrics that are only present on the log traces of the software you need to monitor to provide a consistent monitoring platform
It is a common understanding that three pillars in the observability world help us to get a complete view of the status of our own platforms and systems: Logs, Traces, and Metrics.
To provide a summary of the differences between each of them:
Metrics are the counters about the state of the different components from both a technical and a business view. So we can see here things like the CPU consumption, the number of requests, memory, or disk usage…
Logs are the different messages that each of the pieces of software in our platform provides to understand its current behavior and detect some non-expected situations.
Trace is the different data regarding the end-to-end request flow across the platform with the services and systems that have been part of that flow and data related to that concrete request.
We have solutions that claim to address all of them, mainly in the enterprise software with Dynatrace, AppDynamics, and similar. And on the other hand, we try to go with a specific solution for each of them that we can easily integrate together and we have discussed a lot about that options in previous articles.
But, some situations in that software don’t work following this path because we live in the most heterogeneous era. We all embrace, at some level, the polyglot approach on the new platforms. In some cases, we can see that software is using log traces to provide data related to metrics or other matters, and here is when we need to rely on pieces of software that help us “fix” that situation, and Promtail does specifically that.
Promtail is mainly a log forwarder similar to others like fluentd or fluent-bit from CNCF or logstash from the ELK stack. In this case, this is the solution from Grafana Labs, and as you can imagine, this is part of the Grafana stack with Loki to be the “master-mind” that we cover in this article that I recommend you to take a look at if you haven’t read it yet:
Discover Loki: A Lightweight Alternative to the ELK stack
Learn about the new horizontally-scalable, highly-available, multi-tenant log aggregation system inspired by Prometheus that can be the best fit for your logging architecture Photo by Anthony Martino on Unsplash When we talk about Cloud-Native Architecture, log aggregation is something key that you need to consider. The old practices that we followed in the on-premises virtual machine […]
Promtail has two main ways of behaving as part of this architecture, and the first one is very similar to others in this space, as we commented before. It helps us ship our log traces from our containers to the central location that will mainly be Loki and can be a different one and provide the usual options to play and transform those traces as we can do in other solutions. You can look at all the options in the link below, but as you can imagine, this includes transformation, filtering, parsing, and so on.
Stages
Stages This section is a collection of all stages Promtail supports in a Pipeline.
Parsing stages: docker: Extract data by parsing the log line using the …
But what makes promtail so different is just one of the actions that you can do, and that action is metrics. Metrics provides a specific way to, based on the data that we are reading from the logs, create Prometheus metrics that a Prometheus server can scrape. That means that you can use the log traces that you are processing that can something like this:
[2021–06–06 22:02.12] New request received for customer_id: 123
[2021–06–06 22:02.12] New request received for customer_id: 191
[2021–06–06 22:02.12] New request received for customer_id: 522
With this information apart to send those metrics to the central location to create a metric call, for example: `total_request_count` that will be generated by the promtail agent and also exposed by it and being able also to use a metrics approach even for systems or components that don’t provide a standard way to do that like a formal metrics API.
And the way to do this is very well integrated with the configuration. This is done with an additional stage (this is how we call the actions we can do in Promtail) that is namedmetrics.
The schema of that metric stage is straightforward, and if you are familiar with Prometheus, you will see how direct it is from a definition of Prometheus metrics to this snippet:
# A map where the key is the name of the metric and the value is a specific
# metric type.
metrics:
  [<string>: [ <metric_counter> | <metric_gauge> | <metric_histogram> ] ...]
So we start defining the kind of metrics that we would like to define, and we have the usual ones: counter, gauge, or histogram, and for each of them, we have a set of options to be able to declare our metrics as you can see here for a Counter Metrics
# The metric type. Must be Counter.
type: Counter

# Describes the metric.
[description: <string>]
# Defines custom prefix name for the metric. If undefined, default name “promtail_custom_” will be prefixed.
[prefix: <string>]
# Key from the extracted data map to use for the metric,
# defaulting to the metric’s name if not present.
[source: <string>]
# Label values on metrics are dynamic which can cause exported metrics
# to go stale (for example when a stream stops receiving logs).
# To prevent unbounded growth of the /metrics endpoint any metrics which
# have not been updated within this time will be removed.
# Must be greater than or equal to ‘1s’, if undefined default is ‘5m’
[max_idle_duration: <string>]
config:
# If present and true all log lines will be counted without
# attempting to match the source to the extract map.
# It is an error to specify `match_all: true` and also specify a `value`
[match_all: <bool>]
# If present and true all log line bytes will be counted.
# It is an error to specify `count_entry_bytes: true` without specifying `match_all: true`
# It is an error to specify `count_entry_bytes: true` without specifying `action: add`
[count_entry_bytes: <bool>]
# Filters down source data and only changes the metric
# if the targeted value exactly matches the provided string.
# If not present, all data will match.
[value: <string>]
# Must be either “inc” or “add” (case insensitive). If
# inc is chosen, the metric value will increase by 1 for each
# log line received that passed the filter. If add is chosen,
# the extracted value most be convertible to a positive float
# and its value will be added to the metric.
action: <string>
And with that, you will have your metric created and exposed, just waiting for a Prometheus server to scrape it. If you would like to see all the options available, all this documentation is available in the Grafana Labs documentation that you can check in the link:
metrics
metrics stage The metrics stage is an action stage that allows for defining and updating metrics based on data from the extracted map. Note that created …
I hope you will find this interesting and a useful way to keep all your observability information managed correctly using the right solution and provide a solution for these pieces of software that don’t follow your paradigm.
We have come from a time where we deploy an application using an apparent and straight-line process. The traditional way is pretty much like this:
Wait until a weekend or some time where the load is low, and business can tolerate some service unavailability.
We schedule the change and warn all the teams involved for that time to be ready to manage the impact.
We deploy the new version and we have all the teams during the functional test they need to do to ensure that is working fine, and we wait for the real load to happen.
We monitor during the first hours to see if something wrong happens, and in case it does, we establish a rollback process.
As soon as everything goes fine, we wait until the next release in 3–4 months.
But this is not valid anymore. Business demands IT to be agile, change quickly, and not afford to do that kind of resource effort each week or, even worse, each day. Do you think that it’s possible to gather all teams each night to deploy the latest changes? It is not feasible at all.
So, technology advance to help us solve that issue better, and here is where Canarying came here to help us.
Introducing Canary Deployments
Canary deployments (or just Canarying as you prefer) are not something new, and a lot of people has been talking a lot about it:
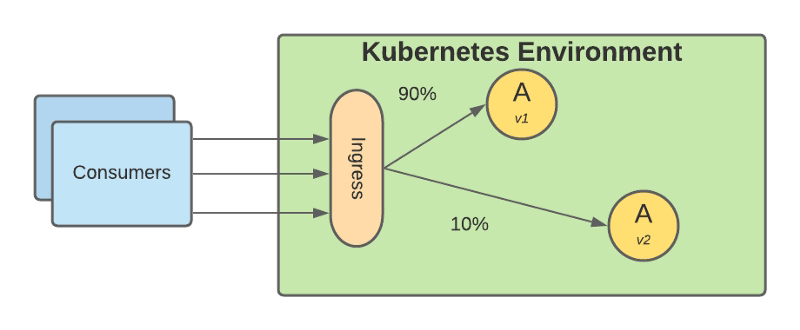
It has been here for some time, but before, it was neither easy nor practical to implement it. Basically is based on deploying the new version into production, but you still keeping the traffic pointing to the old version of the application and you just start shifting some of the traffic to the new version.
Canary release in Kubernetes environment graphical representation
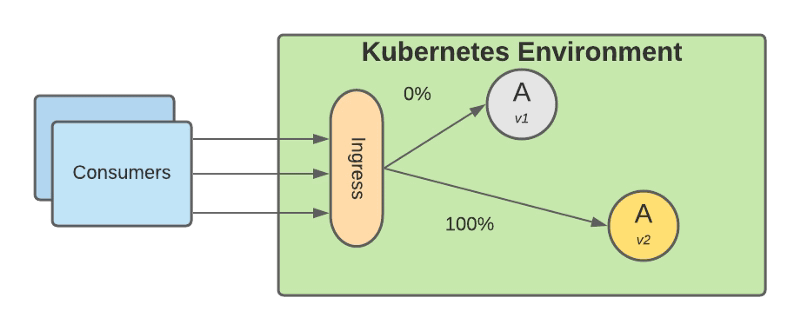
Based on that small subset of requests you monitor how the new version performs at different levels, functional level, performance level, and so on. Once you feel comfortable with the performance that is providing you just shift all the traffic to the new version, and you deprecate the old version
Removal of old version after all traffic has been shifted to the newly deployed version.
The benefits that come with this approach are huge:
You don’t need a big staging environment as before because you can do some of the tests with real data into the production while not affecting your business and the availability of your services.
You can reduce time to market and increase the frequency of deployments because you can do it with less effort and people involved.
Your deployment window has been extended a lot as you do not need to wait for a specific time window, and because of that, you can deploy new functionality more frequently.
Implementing Canary Deployment in Kubernetes
To implement Canary Deployment in Kubernetes, we need to provide more flexibility to how the traffic is routed among our internal components, which is one of the capabilities that get extended from using a Service Mesh.
We already discussed the benefits of using a Service Mesh as part of your environment, but if you would like to retake a look, please refer to this article:
We have several technology components that can provide those capabilities, but this is how you will be able to create the traffic routes to implement this. To see how you can take a look at the following article about one of the default options that is Istio:
But be able to route the traffic is not enough to implement a complete canary deployment approach. We also need to be able to monitor and act based on those metrics to avoid manual intervention. To do this, we need to include different tools to provide those capabilities:
Prometheus is the de-facto option to monitor workloads deployed on the Kubernetes environment, and here you can get more info about how both projects play together.
And to manage the overall process, you can have a Continuous Deployment tool to put some governance around that using options like Spinnaker or using our of the extensions for the Continuous integration tools like GitLab or GitHub:
In this article, we covered how we can evolve a traditional deployment model to keep pace with innovation that businesses require today and how canary deployment techniques can help us on that journey, and the technology components needed to set up this strategy in your own environment.
We all know that Kubernetes is the default environment for all our new applications we developed we will build. The flavor of that Kubernetes platform can be of different ways and forms, but one thing is clear, it is complex.
The reasons behind this complexity is being able to provide all the flexibility but it is also true that the k8s project never has put much effort to provide a simple way to manage your clusters and kubectl is the point of access to send commands leaving this door open to the community to provide its own solution and these are the things that we are going to discuss today.
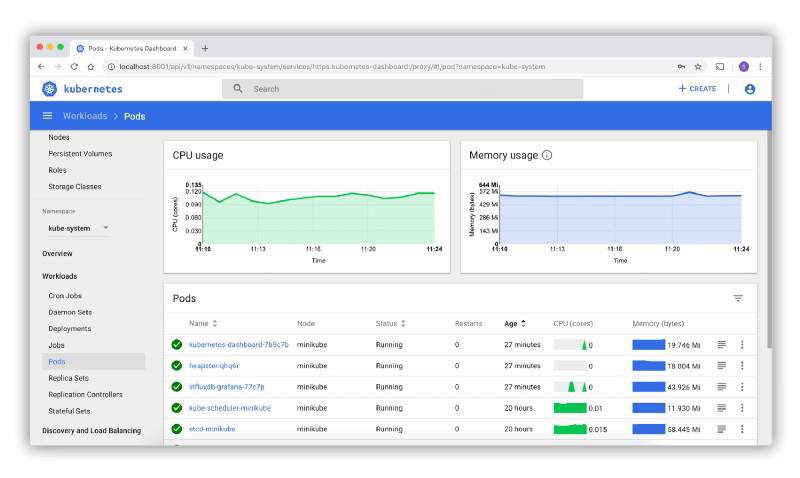
Kubernetes Dashboard is the default option for most of the installations. It is a web-based interface that is part of the K8s project but not deployed by default when you install the cluster
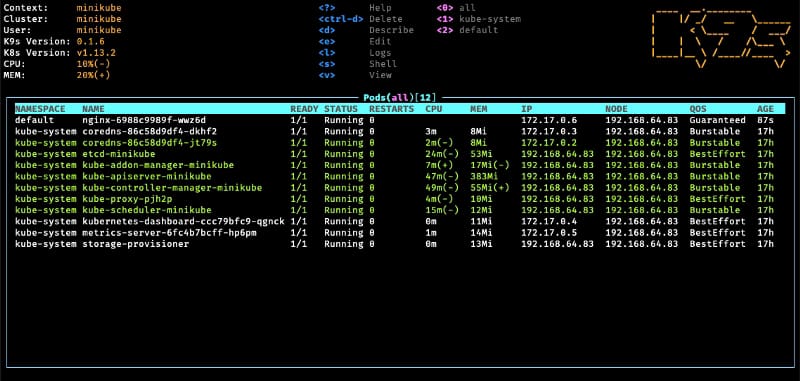
K9S is one of the most common options for the ones that love a very powerful command-line interface with a lot of options at your disposal
It is a mix between all the power of a command-line interface with all the keyboard options at your disposals with a very fancy graphical view to have a quick overview of the status of your cluster at glance.
The lens is a very vitaminized GUI option that goes beyond that just showing the status of the K8S cluster or allowing modifications on the components. With integration with other projects such as Helm or support for the CRD. It provides a very pleasant experience of managing clusters with multi-cluster support as well. To know more about Lens you can take a look at this article that we cover its main features:
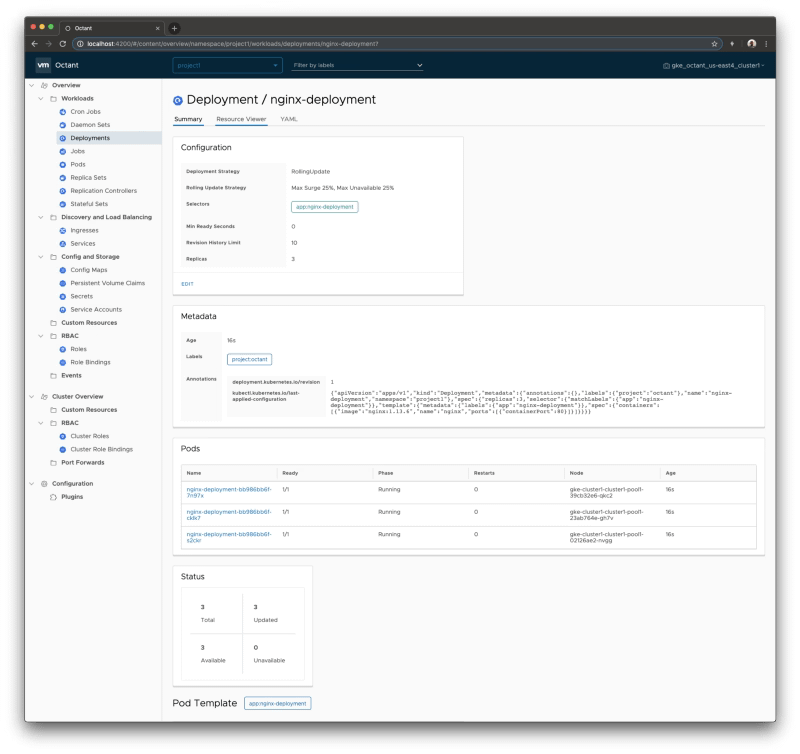
Octant provides an improved experience compared with the default web option discussed in this article using the Kubernetes dashboard. Built for extension with a plug-in system that allows you to extend or customize the behavior of octant to maximize your productivity managing K8S clusters. Including CRD support and graphical visualization of dependencies provides an awesome experience.
Summary
The have provided in this article different tools that will help you during the important task to manage or inspect your Kubernetes cluster. Each of them with its own characteristics and each of them focuses on different ways to provide the information (CLI, GUI and Web) so you can always find one that works best for your situation and preferences.
Autoscaling is one of the great things of cloud-native environments and helps us to provide an optimized use of the operations. Kubernetes provides many options to do that being one of those the Horizontal Pod Autoscaler (HPA) approach.
HPA is the way Kubernetes has to detect if it is needed to scale any of the pods, and it is based on the metrics such as CPU usage or memory.
Sometimes those metrics are not enough to decide if the number of replicas we have available is enough. Other metrics can provide a better perspective, such as the number of requests or the number of pending events.
Kubernetes Event-Driven Autoscaling (KEDA)
Here is where KEDA comes to help. KEDA stands for Kubernetes Event-Driven Autoscaling and provides a more flexible approach to scale our pods inside a Kubernetes cluster.
It is based on scalers that can implement different sources to measure the number of requests or events that we receive from different messaging systems such as Apache Kafka, AWS Kinesis, Azure EventHub, and other systems as InfluxDB or Prometheus.
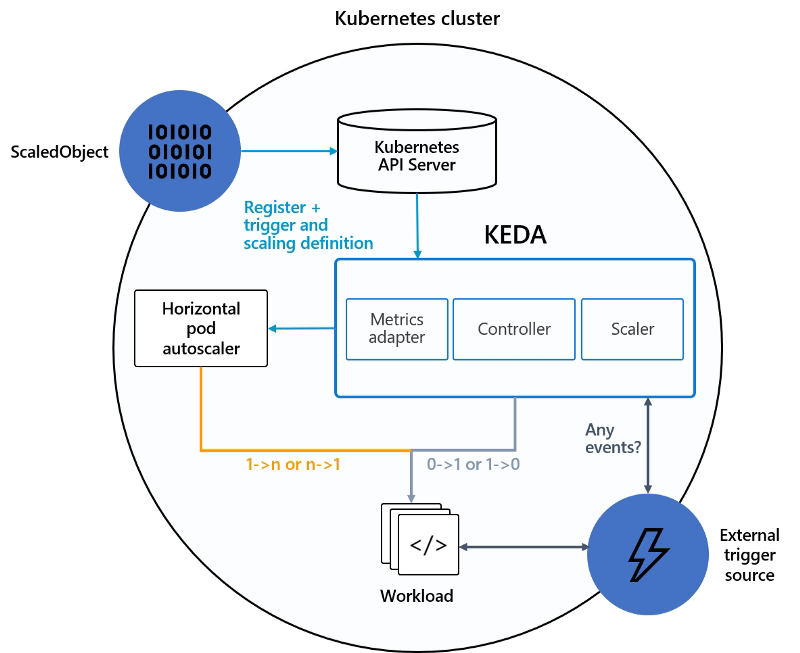
KEDA works as it is shown in the picture below:
We have our ScaledObject that links our external event source (i.e., Apache Kafka, Prometheus ..) with the Kubernetes Deployment we would like to scale and register that in the Kubernetes cluster.
KEDA will monitor the external source, and based on the metrics gathered, will communicate the Horizontal Pod Autoscaler to scale the workload as defined.
Testing the Approach with a Use-Case
So, now that we know how that works, we will do some tests to see it live. We are going to show how we can quickly scale one of our applications using this technology. And to do that, the first thing we need to do is to define our scenario.
In our case, the scenario will be a simple cloud-native application developed using a Flogo application exposing a REST service.
The first step we need to do is to deploy KEDA in our Kubernetes cluster, and there are several options to do that: Helm charts, Operation, or YAML files. In this case, we are going to use the Helm charts approach.
So, we are going to type the following commands to add the helm repository and update the charts available, and then deploy KEDA as part of our cluster configuration:
After running this command, KEDA is deployed in our K8S cluster, and it types the following command kubectl get all will provide a situation similar to this one:
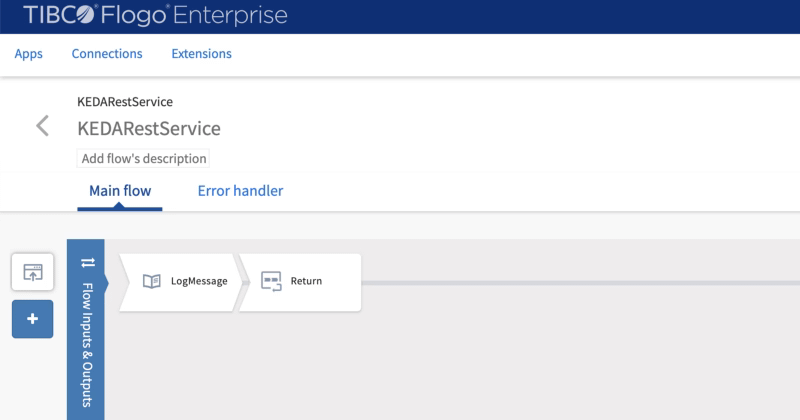
Now, we are going to deploy our application. As already commented to do that we are going to use our Flogo Application, and the flow will be as simple as this one:
Flogo application listening to the requests
The application exposes a REST service using the /hello as the resource.
Received requests are printed to the standard output and returned a message to the requester
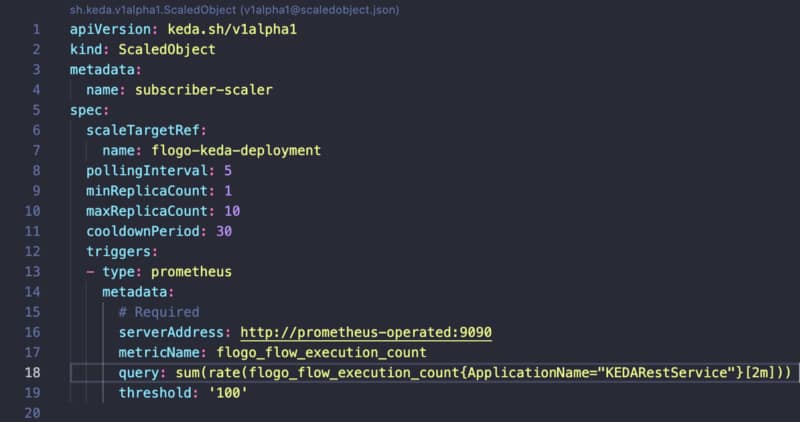
Once we have our application deployed on our Kubernetes application, we need to create a ScaledObject that is responsible for managing the scalability of that component:
ScaleObject configuration for the application
We use Prometheus as a trigger, and because of that, we need to configure where our Prometheus server is hosted and what query we would like to do to manage the scalability of our component.
In our sample, we will use the flogo_flow_execution_count that is the metric that counts the number of requests that are received by this component, and when this has a rate higher than 100, it will launch a new replica.
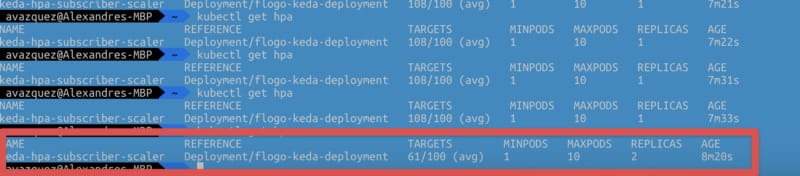
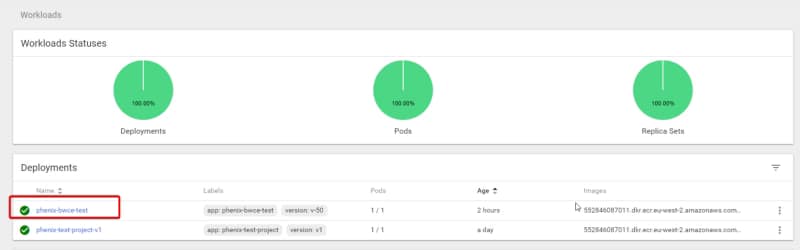
After hitting the service with a Load Test, we can see that as soon as the service reaches the threshold, it launch a new replica to start handling requests as expected.
Autoscaling being done using Prometheus metrics.
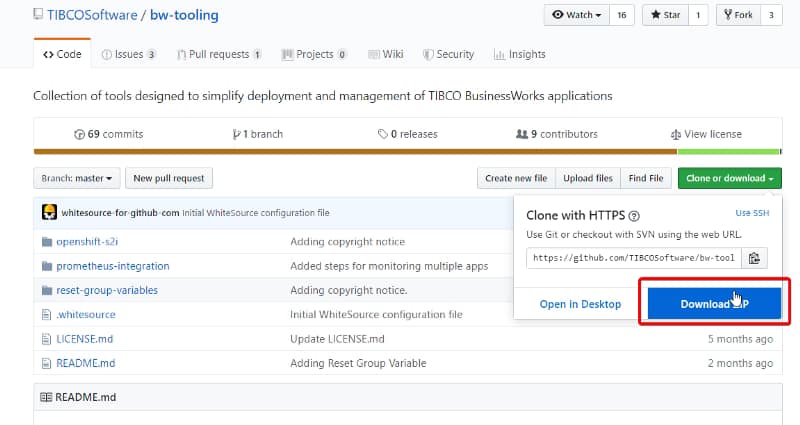
All of the code and resources are hosted in the GitHub repository shown below:
This post has shown that we have unlimited options in deciding the scalability options for our workloads. We can use the standard metrics like CPU and memory, but if we need to go beyond that, we can use different external sources of information to trigger that autoscaling.
Kubernetes has become the new normal to deploy our applications and other serverless options, so the administration of these clusters has become critical for most enterprises, and doing a proper Kubernetes Health Check is becoming critical.
This task is clear that it is not an easy task. As always, the flexibility and power that technology provides to the users (in this case, the developers) also came with a trade-off with the operation and management’s complexity. And this is not an exception to that.
We have evolved, including managed options that simplify all the underlying setup and low-level management of the infrastructure behind it. However, many things need to be done for the cluster administration to have a happy experience in the journey of a Kubernetes Administrator.
A lot of concepts to deal with: namespaces, resource limits, quotas, ingress, services, routes, crd… Any help that we can get is welcome. And with this purpose in mind, KubeEye has been born.
GitHub – kubesphere/kubeeye: KubeEye aims to find various problems on Kubernetes, such as application misconfiguration, unhealthy cluster components and node problems.
KubeEye aims to find various problems on Kubernetes, such as application misconfiguration, unhealthy cluster components and node problems. – GitHub – kubesphere/kubeeye: KubeEye aims to find variou…
KubeEye is an open-source project that helps to identify some issues in our Kubernetes Clusters. Using their creators’ words:
KubeEye aims to find various problems on Kubernetes, such as application misconfiguration(using Polaris), cluster components unhealthy and node problems(using Node-Problem-Detector). Besides predefined rules, it also supports custom defined rules.
So we can think like a buddy that is checking the environment to make sure that everything is well configured and healthy. Also, it allows us to define custom rules to make sure that all the actions that the different dev teams are doing are according to the predefined standards and best practices.
So let’s see how we can include KubeEye to do a health check of our environment. The first thing we need to do is to install it. At this moment, KubeEye only offers a release for Linux-based system, so if you are using other systems like me, you need to follow another approach and type the following commands:
After doing that, we end up with a new binary in our PATH named `ke`, and this is the only component needed to work with the app. The second step we need to do to get more detail on those diagnostics is to install the node problem detector component.
This component is a component installed in each node of the cluster. It helps to make more visible to the upstream layers issues regarding the behavior of the Kubernetes cluster. This is an optional step, but it will provide more meaningful data, and install that, we need to run the following command.
ke install npd
And now we’re ready to start checking our environment, and the order is as easy as this one.
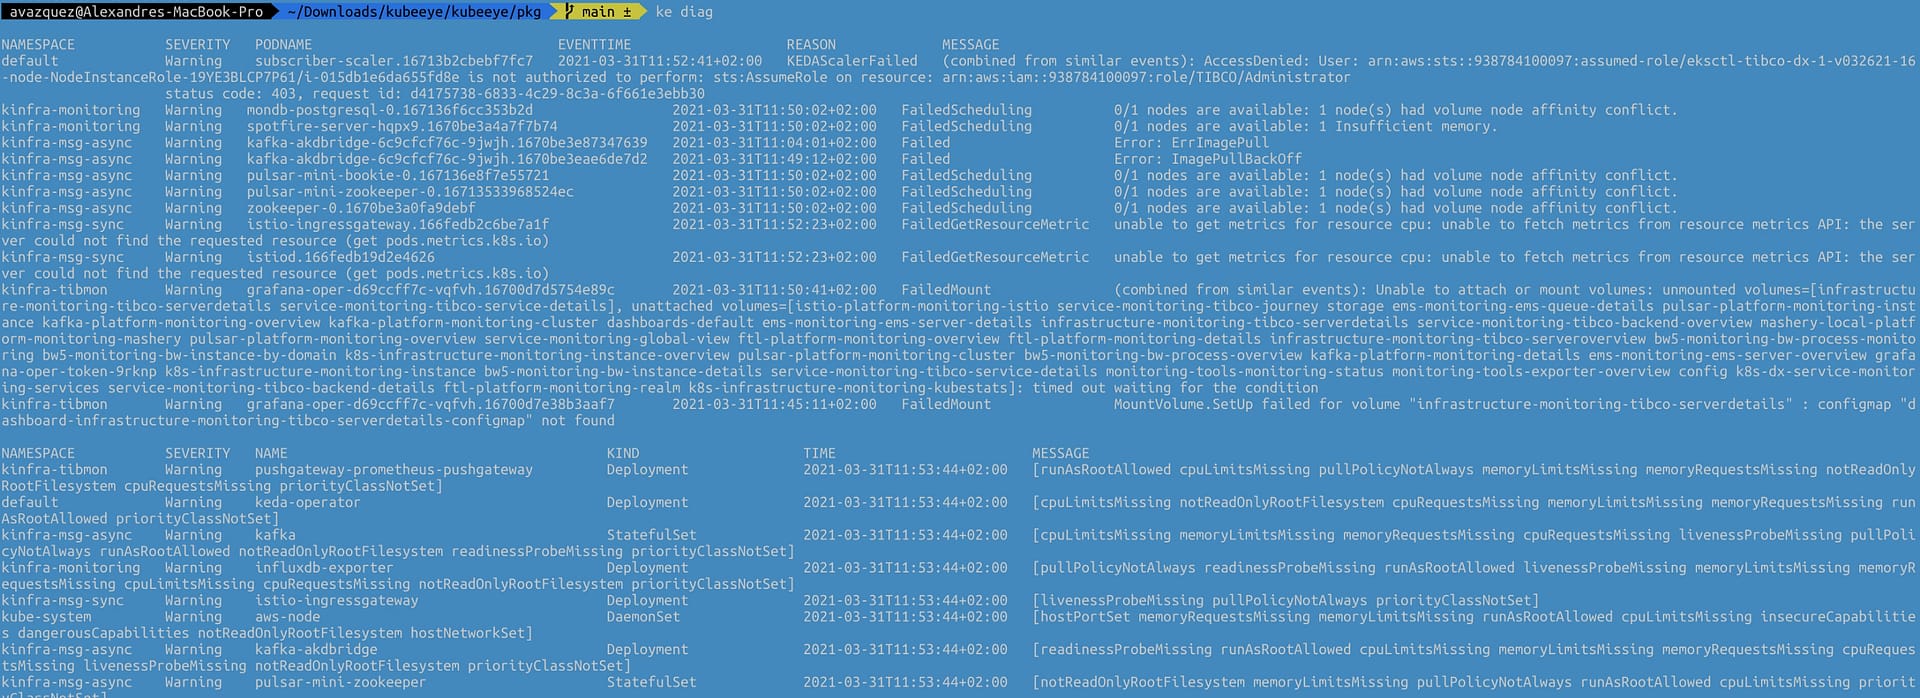
ke diag
This will provide an output similar to this that is compounded by two different tables. The first one will be focused on the Pod and the issues and events raised as part of the platform’s status, and the other will focus on the rest of the elements and kinds of objects for the Kubernetes Clusters.
Output from the ke diag command
The table for the issues at the pod level has the following fields:
Namespace where the pod belongs to.
Severity of the issue.
Pod Name that is responsible for the issue
EventTime of where this event has been raised
Reason for the issue
Message with the detailed description of the issue
The second table for the other objects has the following structure:
Namespace where the object that has an issue that is being detected is deployed.
Severity of the issue.
Name of the component
Kind of the component
Time of where this issue has been raised
Message with the detailed description of the issue
Command’s output can also show other tables if some issues are detected at the node level.
Today we cover a fascinating topic as it is the Kubernetes Administration and introduce a new tool that helps your daily task.
I truly expect that this tool can be added to your toolbox and ease the path for a happy and healthy Kubernetes Cluster administration!
Prometheus has become a standard component in our cloud architectures and Prometheus storage is becoming a critical aspect. So I am going to guess that if you are reading this you already know what Prometheus is. If this is not the case, please take your time to take a look at other articles that I have created:
Prometheus Monitoring for Microservices using TIBCO
We’re living a world with constant changes and this is even more true in the Enterprise Application world. I’ll not spend much time talking about things you already know, but just say that the microservices architecture approach and the PaaS solutions have been a game-changer for all enterprise integration technologies. This time I’d like to […]
Kubernetes Service Discovery for Prometheus
In previous posts, we described how to set up Prometheus to work with your TIBCO BusinessWorks Container Edition apps, and you can read more about it here. In that post, we described that there were several ways to update Prometheus about the services that ready to monitor. And we choose the most simple at that […]
We know that usually when we monitor using Prometheus we have so many exporters available at our disposal and also that each of them exposes a lot of very relevant metrics that we need to track everything we need to and that lead to very intensive usage of the storage available if we do not manage accordingly.
There are two factors that affect this. The first one is to optimize the number of metrics that we are storing and we already provide tips to do that in other articles as the ones shown below:
How it optimize the disk usage in the Prometheus database?
Learn some tricks to analyze and optimize the usage that you are doing of the TSDB and save money on your cloud deployment. Photo by Markus Spiske on Unsplash In previous posts, we discussed how the storage layer worked for Prometheus and how effective it was. But in the current times, we are of cloud computing […]
The other one is how long we store the metrics called the “retention period in Prometheus.” And this property has suffered a lot of changes during the different versions. If you would like to see all the history please take a look at this article from Robust Perception:
How can you control how much history Prometheus keeps?
The main properties that you can configure are the following ones:
storage.tsdb.retention.time: Number of days to store the metrics by default to 15d. This property replaces the deprecated one storage.tsdb.retention.
storage.tsdb.retention.size: You can specify the limit of size to be used. This is not a hard limit but a minimum so please define some margin here. Units supported: B, KB, MB, GB, TB, PB, EB. Ex: “512MB”. This property is experimental so far as you can see in the official documentation:
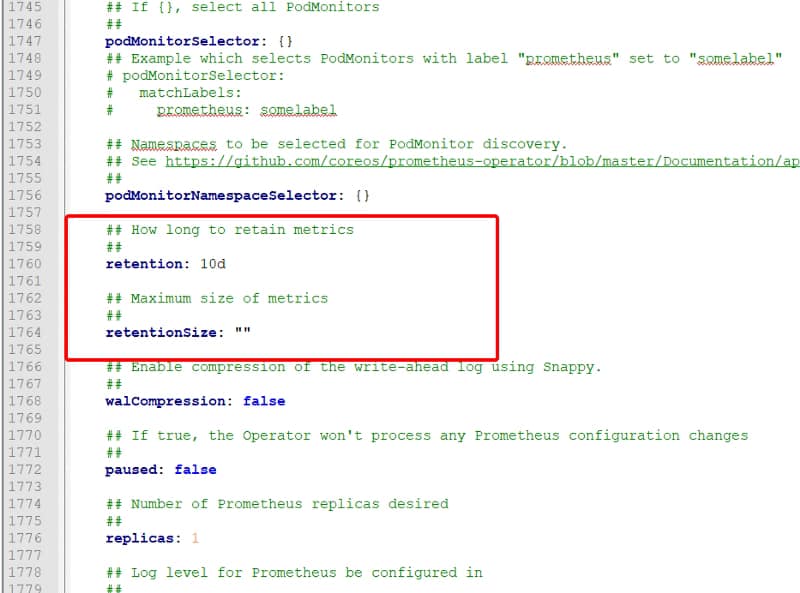
What about setting this configuration in the operator for Kubernetes? In that case, you also have similar options available in the values.yaml configuration file for the chart as you can see in the image below:
values.yml for the Prometheus Operator Helm Chart
This should help you get an optimized deployment of Prometheus that ensures all the features that Prometheus has but at the same time an optimal use of the resources at your disposal.
Additional to that, you should also check the Managed Service options that some providers have regarding Prometheus, such as the Amazon Managed Services for Prometheus, as you can see in the link below:
Amazon Prometheus Service to Provide More Availability to Your Monitoring Solution
Learn what Amazon Managed Service for Prometheus provides and how you can benefit from it. Photo by Casey Horner on Unsplash Monitoring is one of the hot topics when we talk about cloud-native architectures. Prometheus is a graduated Cloud Native Computing Foundation (CNCF) open-source project and one of the industry-standard solutions when it comes to monitoring your […]
Learn about the new horizontally-scalable, highly available, multi-tenant log aggregation system inspired by Prometheus that can be the best fit for your logging architecture
Loki vs ELK is something you are reading and hearing each time more often as from some time it is a raise on the dispute of becoming the de-factor standard for log aggregation architectures.
When we talk about Cloud-Native Architecture, log aggregation is something key that you need to consider. The old practices that we followed in the on-premises virtual machine approach for logging are not valid anymore.
We already cover this topic in my previous post that I recommend you to talk a look in case you haven’t read it yet, but this is not the topic for today.
Three reasons why you need a Log Aggregation Architecture today
Log Aggregation are not more a commodity but a critical component in container-based platforms Photo by Olav Ahrens Røtne on Unsplash Log Management doesn’t seem like a very fantastic topic. It is not the topic that you see and says: “Oh! Amazing! This is what I was dreaming about my whole life”. No, I’m aware that […]
Elasticsearch as the core and the different derívate de stacks like ELK/EFK had gained popularity in the last years, being pretty much the default open-source option when we talked about log aggregation and one of the options. The main public cloud providers have also adopted this solution as part of their own offering as the Amazon Elasticsearch Service provides.
But Elasticsearch is not perfect. If you have already used it, you probably know about it. Still, because their features are so awesome, especially on the searching and indexing capabilities, it has been the kind of leader today. But other topics like the storage use, the amount of power you need to handle it, and the architecture with different kinds of nodes (master, data, ingester) increase its complexity for cases when we need something smaller.
And to fill this gap is where our main character for today’s post arrives: Loki or Grafana Loki.
Loki is a logging management system created as part of the Grafana project, and it has been created with a different approach in mind than Elasticsearch.
Loki is a horizontally-scalable, highly-available, multi-tenant log aggregation system inspired by Prometheus. It is designed to be very cost effective and easy to operate. It does not index the contents of the logs, but rather a set of labels for each log stream.
So as we can read in the definition from their own page above, it covers several interesting topics in comparison with Elasticsearch:
First of all, it addresses some of the usual pain points for ELK customers: It is very cost-effective and easy to operate.
It clearly says that the approach is not the same as ELK, you are not going to have a complete index of the payload for the events, but it is based on different labels that you can define for each log stream.
Prometheus inspires that, which is critical because it enabled the idea to use log traces as metrics to empower our monitoring solutions.
Let’s start with the initial questions when we show an interesting new technology, and we would like to start testing it.
How can I install Loki?
Loki is distributed in different flavors to be installed in your environment in the way you need it.
SaaS: provided as part of the hosting solution of Grafana Cloud.
On-Premises: Provided as a normal binary to be download to run in an on-premises mode.
Cloud: Provided a docker image or even a Helm Chart to be deployed into your Kubernetes-based environment.
GrafanaLabs teams also provide Enterprise Support for Loki if you would like to use it on production mode in your company. Still, at the same time, all the code is licensed using Apache License 2.0, so you can take a look at all the code and contribute to it.
Architecture wise is very similar to the ELK/EFK stack and follow the same approach of “collectors” and “indexers” as ELK has:
Loki itself is the central node of the architecture responsible for storing the log traces and their labels and provided an API to search among them based on their own language LogQL (a similar approach to the PromQL from Prometheus).
promtail is the agent component that runs in the edge getting all those log traces that we need that can be running on a machine on-prem or a DaemonSet fashion in our own Kubernetes cluster. It plays the same role as Logstash/Fluent-bit/Fluentd works in the ELK/EFK stack. Promtail provides the usual plugin mode to filter and transforms our log traces as the other solutions provide. At the same time, it provides an interesting feature to convert those log traces into Prometheus metrics that can be scraped directly by your Prometheus server.
Grafana is the UI for the whole stack and plays a similar role as Kibana in the ELK/EFK stack. Grafana, among other plugins, provides direct integration with Loki as a Datasource to explore those traces and include them in the Dashboards.
Summary
Grafana Loki can be a great solution for your logging architecture to cover address two points: Provide a Lightweight log aggregation solution for your environment and at the same time enable your log traces as a source for your metrics, allowing you to create detailed, more business-oriented metrics that use in your dashboards and your monitoring systems.
If you are reading this, probably, you are already aware of the challenges that come with a microservices architecture. It could be because you are reading about those or even because you are challenging them right now in your own skin.
One of the most common challenges is network and communication. With the eclosion of many components that need communication and the ephemeral approach of the cloud-native developments, many new features are a need when in the past were just a nice-to-have.
Concepts like service registry and service discovery, service authentication, dynamic routing policies, and circuit breaker patterns are no longer things that all the cool companies are doing but something basic to master the new microservice architecture as part of a cloud-native architecture platform, and here is where the Service Mesh project is increasing its popularity as a solution for most of this challenges and providing these features that are needed.
If you remember, a long time ago, I already cover that topic to introduce Istio as one of the options that we have:
Integrating Istio with BWCE Applications
Introduction Services Mesh is one the “greatest new thing” in our PaaS environments. No matter if you’re working with K8S, Docker Swarm, pure-cloud with EKS or AWS, you’ve heard and probably tried to know how can be used this new thing that has so many advantages because it provides a lot of options in handling […]
But this project created by Google and IBM is not the only option that you have to provide those capabilities. As part of the Cloud Native Computing Foundation (CNCF), the Linkerd project provides similar features.
How to install Linkerd
To start using Linkerd, the first thing that we need to do is to install the software and to do that. We need to do two installations, one on the Kubernetes server and another on the host.
To install on the host, you need to go to the releases page and download the edition for your OS and install it.
I am using a Windows-based system in my sample, so I use chocolatey to install the client. After doing so, I can see the version of the CLI typing the following command:
linkerd version
And you will get an output that will say something similar to this:
PS C:\WINDOWS\system32> linkerd.exe version
Client version: stable-2.8.1
Server version: unavailable
Now we need to do the installation on the Kubernetes server, and to do so, we use the following command:
linkerd install | kubectl apply -f -
And you will get an output similar to this one:
PS C:\WINDOWS\system32> linkerd install | kubectl apply -f -
namespace/linkerd created
clusterrole.rbac.authorization.k8s.io/linkerd-linkerd-identity created
clusterrolebinding.rbac.authorization.k8s.io/linkerd-linkerd-identity created
serviceaccount/linkerd-identity created
clusterrole.rbac.authorization.k8s.io/linkerd-linkerd-controller created
clusterrolebinding.rbac.authorization.k8s.io/linkerd-linkerd-controller created
serviceaccount/linkerd-controller created
clusterrole.rbac.authorization.k8s.io/linkerd-linkerd-destination created
clusterrolebinding.rbac.authorization.k8s.io/linkerd-linkerd-destination created
serviceaccount/linkerd-destination created
role.rbac.authorization.k8s.io/linkerd-heartbeat created
rolebinding.rbac.authorization.k8s.io/linkerd-heartbeat created
serviceaccount/linkerd-heartbeat created
role.rbac.authorization.k8s.io/linkerd-web created
rolebinding.rbac.authorization.k8s.io/linkerd-web created
clusterrole.rbac.authorization.k8s.io/linkerd-linkerd-web-check created
clusterrolebinding.rbac.authorization.k8s.io/linkerd-linkerd-web-check created
clusterrolebinding.rbac.authorization.k8s.io/linkerd-linkerd-web-admin created
serviceaccount/linkerd-web created
customresourcedefinition.apiextensions.k8s.io/serviceprofiles.linkerd.io created
customresourcedefinition.apiextensions.k8s.io/trafficsplits.split.smi-spec.io created
clusterrole.rbac.authorization.k8s.io/linkerd-linkerd-prometheus created
clusterrolebinding.rbac.authorization.k8s.io/linkerd-linkerd-prometheus created
serviceaccount/linkerd-prometheus created
clusterrole.rbac.authorization.k8s.io/linkerd-linkerd-proxy-injector created
clusterrolebinding.rbac.authorization.k8s.io/linkerd-linkerd-proxy-injector created
serviceaccount/linkerd-proxy-injector created
secret/linkerd-proxy-injector-tls created
mutatingwebhookconfiguration.admissionregistration.k8s.io/linkerd-proxy-injector-webhook-config created
clusterrole.rbac.authorization.k8s.io/linkerd-linkerd-sp-validator created
clusterrolebinding.rbac.authorization.k8s.io/linkerd-linkerd-sp-validator created
serviceaccount/linkerd-sp-validator created
secret/linkerd-sp-validator-tls created
validatingwebhookconfiguration.admissionregistration.k8s.io/linkerd-sp-validator-webhook-config created
clusterrole.rbac.authorization.k8s.io/linkerd-linkerd-tap created
clusterrole.rbac.authorization.k8s.io/linkerd-linkerd-tap-admin created
clusterrolebinding.rbac.authorization.k8s.io/linkerd-linkerd-tap created
clusterrolebinding.rbac.authorization.k8s.io/linkerd-linkerd-tap-auth-delegator created
serviceaccount/linkerd-tap created
rolebinding.rbac.authorization.k8s.io/linkerd-linkerd-tap-auth-reader created
secret/linkerd-tap-tls created
apiservice.apiregistration.k8s.io/v1alpha1.tap.linkerd.io created
podsecuritypolicy.policy/linkerd-linkerd-control-plane created
role.rbac.authorization.k8s.io/linkerd-psp created
rolebinding.rbac.authorization.k8s.io/linkerd-psp created
configmap/linkerd-config created
secret/linkerd-identity-issuer created
service/linkerd-identity created
deployment.apps/linkerd-identity created
service/linkerd-controller-api created
deployment.apps/linkerd-controller created
service/linkerd-dst created
deployment.apps/linkerd-destination created
cronjob.batch/linkerd-heartbeat created
service/linkerd-web created
deployment.apps/linkerd-web created
configmap/linkerd-prometheus-config created
service/linkerd-prometheus created
deployment.apps/linkerd-prometheus created
deployment.apps/linkerd-proxy-injector created
service/linkerd-proxy-injector created
service/linkerd-sp-validator created
deployment.apps/linkerd-sp-validator created
service/linkerd-tap created
deployment.apps/linkerd-tap created
configmap/linkerd-config-addons created
serviceaccount/linkerd-grafana created
configmap/linkerd-grafana-config created
service/linkerd-grafana created
deployment.apps/linkerd-grafana created
Now we can check that the installation has been done properly using the command:
linkerd check
And if everything has been done properly, you will get an output like this one:
PS C:\WINDOWS\system32> linkerd check
kubernetes-api
--------------
√ can initialize the client
√ can query the Kubernetes API
kubernetes-version
------------------
√ is running the minimum Kubernetes API version
√ is running the minimum kubectl version
linkerd-existence
-----------------
√ 'linkerd-config' config map exists
√ heartbeat ServiceAccount exist
√ control plane replica sets are ready
√ no unschedulable pods
√ controller pod is running
√ can initialize the client
√ can query the control plane API
linkerd-config
--------------
√ control plane Namespace exists
√ control plane ClusterRoles exist
√ control plane ClusterRoleBindings exist
√ control plane ServiceAccounts exist
√ control plane CustomResourceDefinitions exist
√ control plane MutatingWebhookConfigurations exist
√ control plane ValidatingWebhookConfigurations exist
√ control plane PodSecurityPolicies exist
linkerd-identity
----------------
√ certificate config is valid
√ trust anchors are using supported crypto algorithm
√ trust anchors are within their validity period
√ trust anchors are valid for at least 60 days
√ issuer cert is using supported crypto algorithm
√ issuer cert is within its validity period
√ issuer cert is valid for at least 60 days
√ issuer cert is issued by the trust anchor
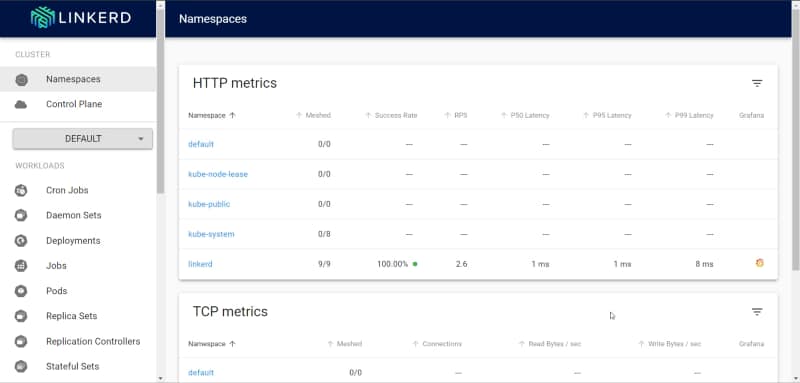
Then we can see the dashboard from Linkerd using the following command:
linkerd dashboard
Dashboard initial web page after a clean Linkerd installation
Deployment of the apps
We will use the same apps that we use some time ago to deploy istio, so if you want to remember what they are doing, you need to look again at that article.
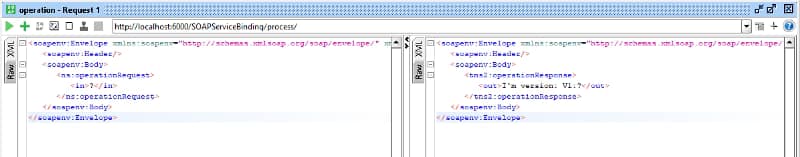
And if we reach the endpoint, we got the expected reply from the provider.
Sample response provided by the provider
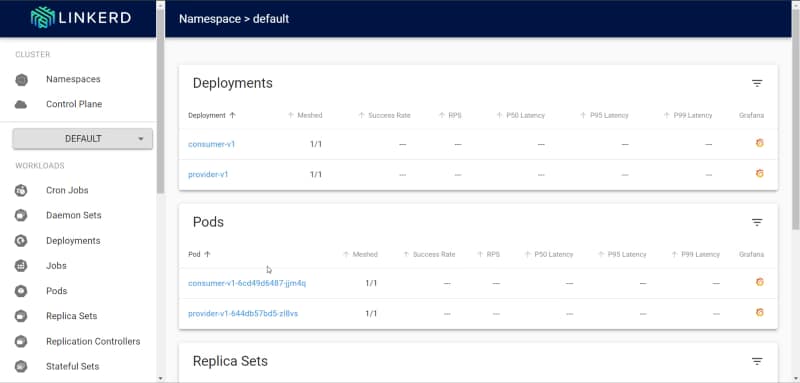
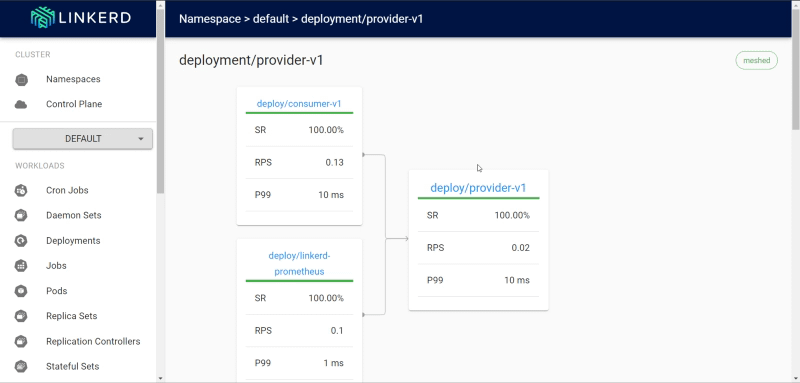
And in the dashboard, we can see the stats of the provider:
Linkerd dashboard showing the stats of the flow
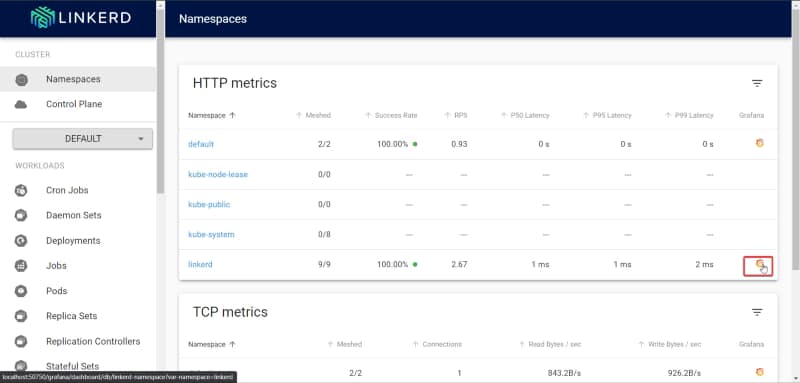
Also, linked by default provided a Grafana dashboard where you can see more metrics you can get there using the grafana link that the dashboard has.
Grafana link on the Linkerd Dashboard
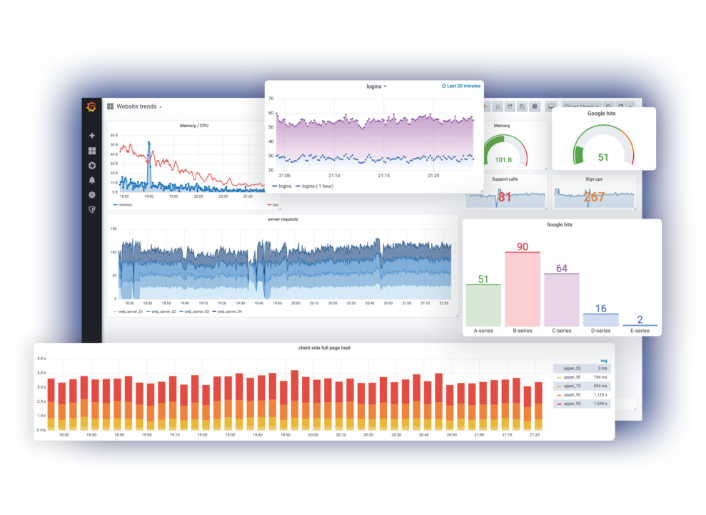
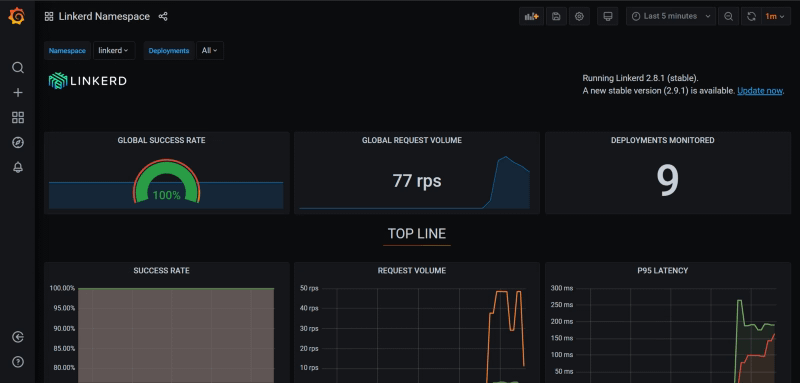
When you enter that, you could see something like the dashboard shown below:
Grafana dashboard showing the linkerd statistics
Summary
With all this process, we have seen how easily we can deploy a linkerd service mesh in our Kubernetes cluster and how applications can integrate and interact with them. In the next posts, we will dive into the most advanced features that will help us in the new challenges that come with the Microservices architecture.