Learn the bases that make Prometheus, so a great solution to monitor your workloads and use it for your own benefit.
Prometheus is one of the key systems in nowadays cloud architectures. The second graduate project from the Cloud Native Computing Foundation (CNCF) after Kubernetes itself, and is the monitoring solution for excellence in most of the workloads running on Kubernetes.
If you already have used Prometheus for some time, you know that it relies on a Time series database so Prometheus storage is one of the key elements. Based on their own words from the Prometheus official page:
Every time series is uniquely identified by its metric name and optional key-value pairs called labels, and that series is similar to the tables in a relational model. And inside each of those series, we have samples that are similar to the tuples. And each of the samples contains a float value and a milliseconds-precision timestamp.
Default on-disk approach
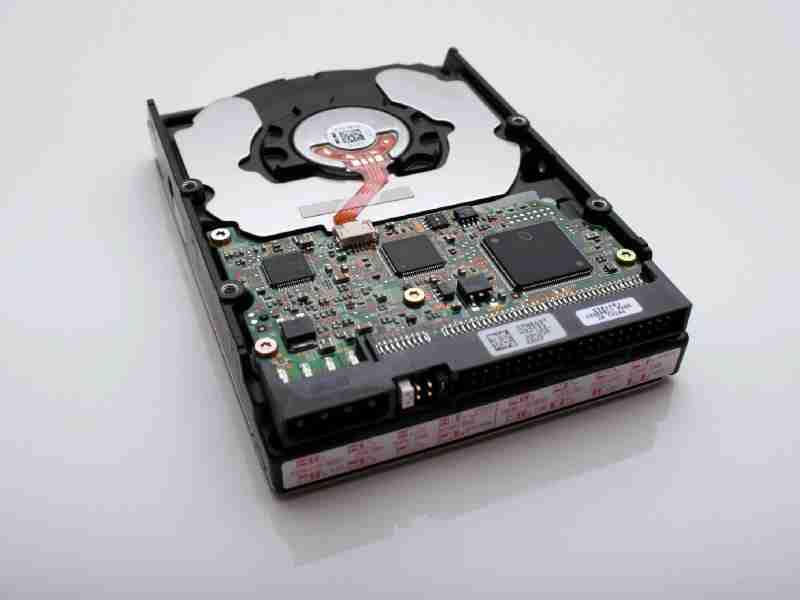
By default, Prometheus uses a local-storage approach storing all those samples on disk. This data is distributed in different files and folders to group different chunks of data.
So, we have folders to create those groups, and by default, they are a two-hour block and can contain one or more files depending on the amount of data ingested in that period of time as each folder contains all the samples for that specific timeline.
Additionally, each folder also has some kind of metadata files that help locate each of the data files’ metrics.
A file is persistent in a complete manner when the block is over, and before that, it keeps in memory and uses a write-ahead log technical to recover the data in case of a crash of the Prometheus server.
So, at a high-level view, the directory structure of a Prometheus server’s data directory will look something like this:
Remote Storage Integration
Default on-disk storage is good and has some limitations in terms of scalability and durability, even considering the performance improvement of the latest version of the TSDB. So, if we’d like to explore other options to store this data, Prometheus provides a way to integrate with remote storage locations.
It provides an API that allows writing samples that are being ingested into a remote URL and, at the same time, be able to read back sample data for that remote URL as shown in the picture below:
As always in anything related to Prometheus, the number of adapters created using this pattern is huge, and it can be seen in the following link in detail:
Summary
Knowing how prometheus storage works is critical to understand how we can optimize their usage to improve the performance of our monitoring solution and provide a cost-efficient deployment.
In the following posts, we’re going to cover how we can optimize the usage of this storage layer, making sure that only the metrics and samples that are important to use are being stored, and also how to analyze which metrics are the ones used most of the time-series database to be able to take good decision about which metrics should be dropped and which ones should be kept.
So, stay tuned for the next post regarding how we can have a better life with Prometheus and not die in the attempt.
📚 Want to dive deeper into Kubernetes? This article is part of our comprehensive Kubernetes Architecture Patterns guide, where you’ll find all fundamental and advanced concepts explained step by step.

