Enable ECS Logging in TIBCO BusinessWorks with Logback

Enable ECS Logging in TIBCO BusinessWorks with Logback

TIBCO BW ECS Logging Support is becoming one demanded feature based on the increased usage of the Elastic Common Schema for the log aggregation solution based on the Elastic stack (previously known as ELK stack)

This article is part of my comprehensive TIBCO Integration Platform Guide where you can find more patterns and best practices for TIBCO integration platforms.

We have already commented a lot about the importance of log aggregation solutions and their benefits, especially when discussing container architecture. Because of that, today, we will focus on how we can adapt our BW applications to support this new logging format.

Because the first thing that we need to know is the following statement: Yes, this can be done. And it can be done non-dependant on your deployment model. So, the solution provided here works for both on-premises solutions as well as container deployments using BWCE.

TIBCO BW Logging Background

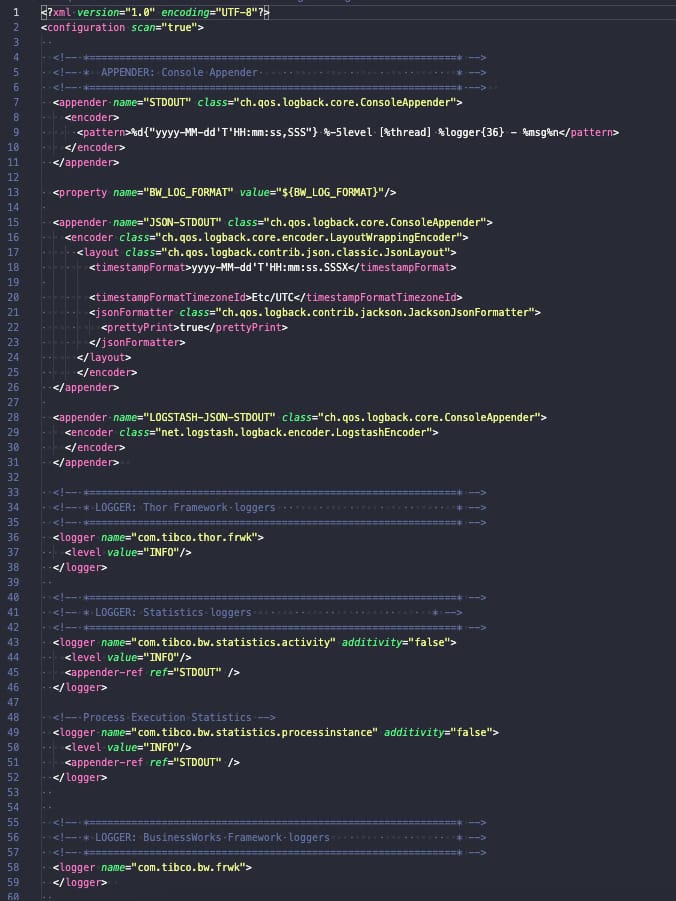
TIBCO BusinessWorks (container or not) relies on its logging capabilities in the logback library, and this library is configured using a file named logback.xml that could have the configuration that you need, as you can see in the picture below:

BW ECS Logging: Sample of Logback.xml default config

Logback is a well-known library for Java-based developments and has an architecture based on a core solution and plug-ins that extend its current capabilities. It’s this plug-in approach that we are going to do to support ECS.

Even in the ECS Official documentation covers the configuration of enabling this logging configuration when using the Logback solution as you can see in the picture below and this official link:
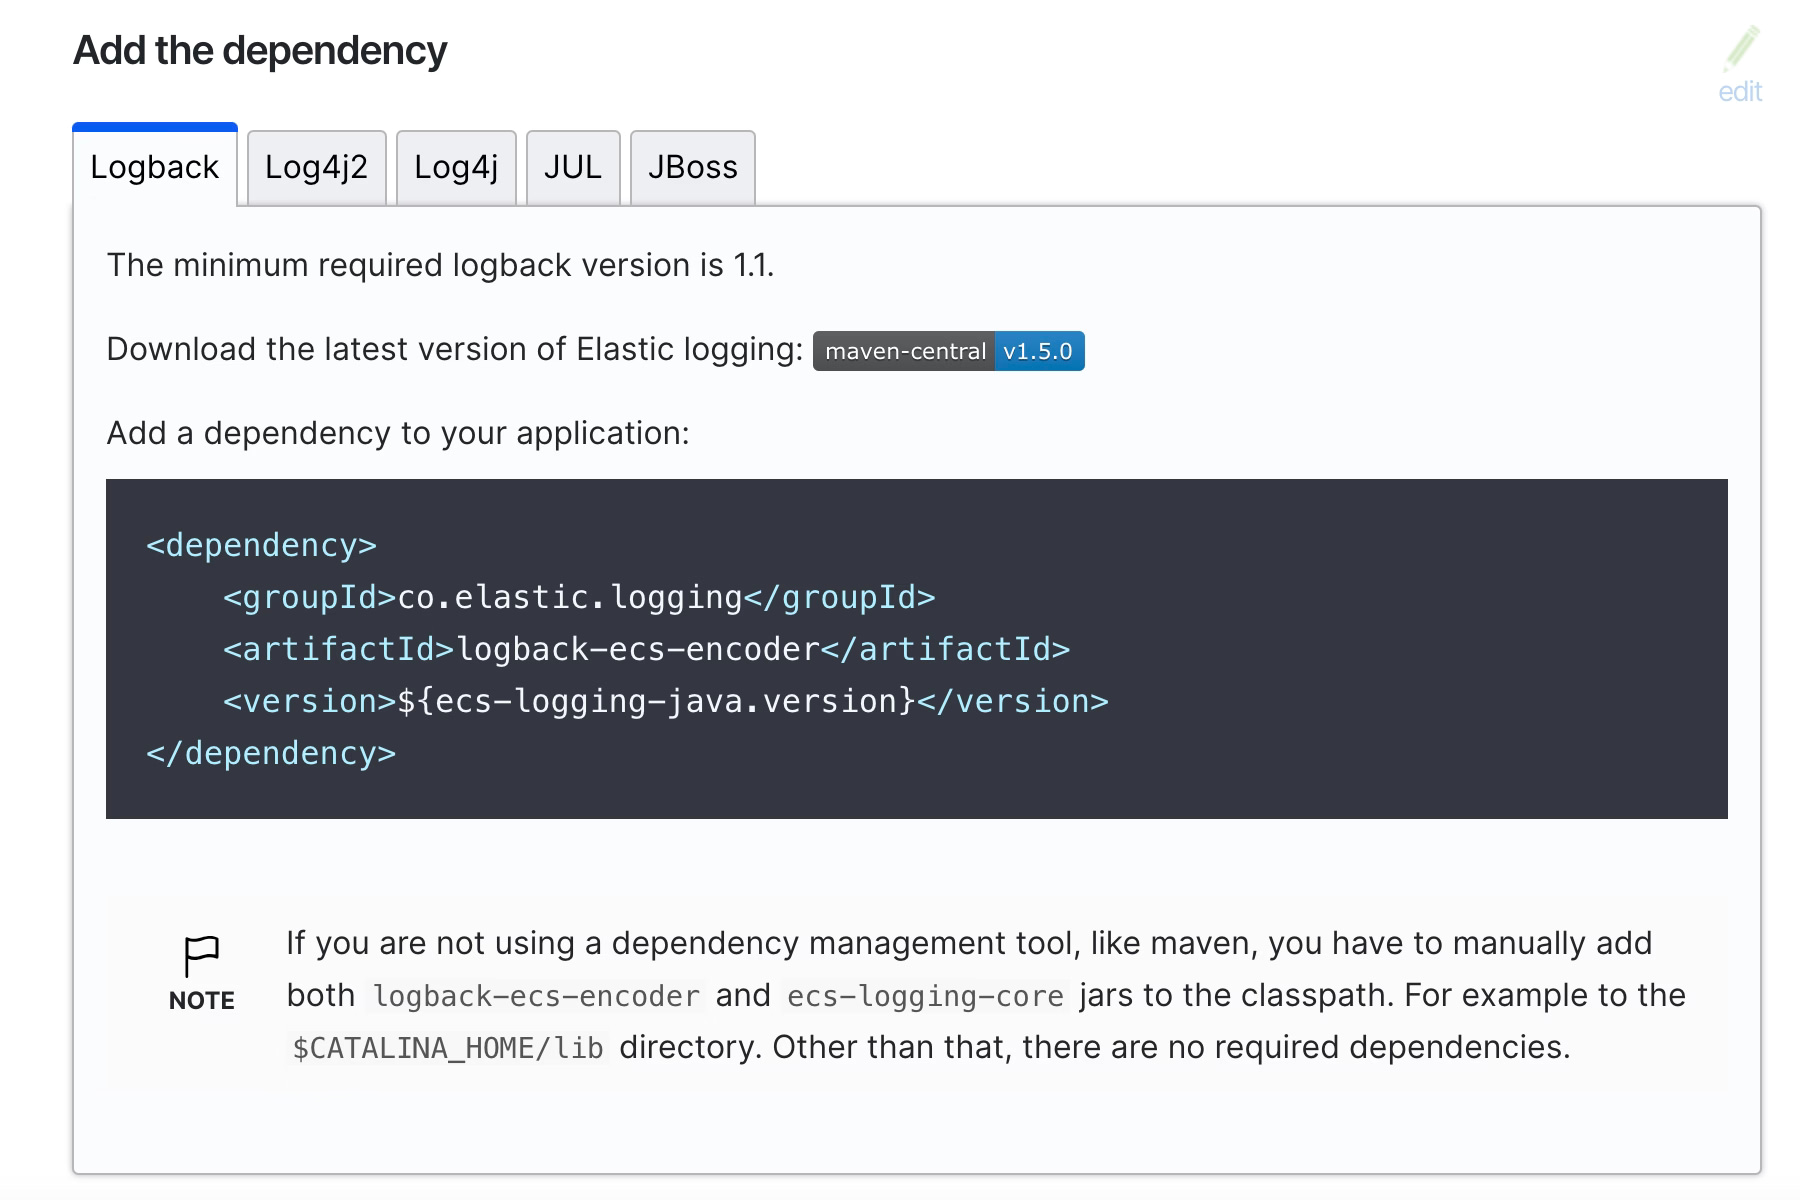
BW ECS Logging: ECS Java Dependency Information

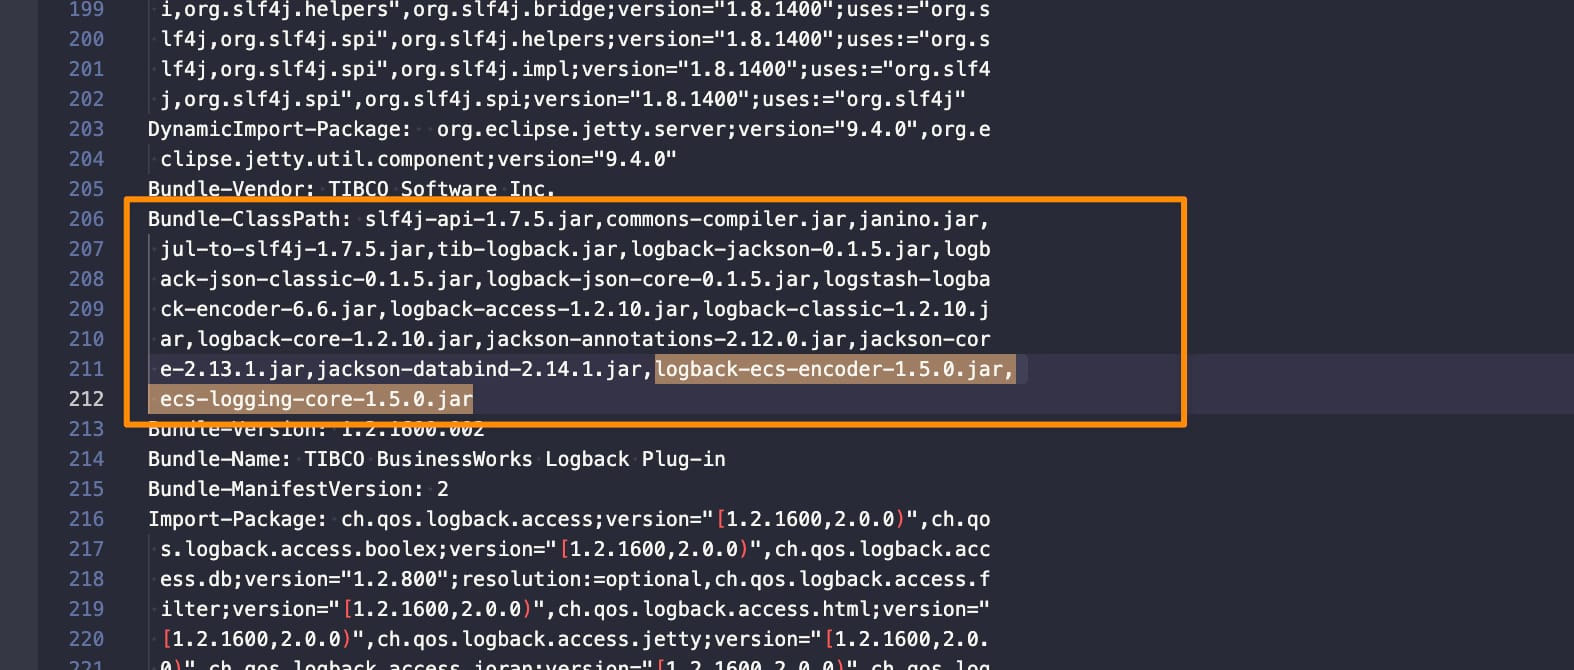
In our case, we don’t need to add the dependency anywhere but just download the dependency, as we will need to include to the existing OSGI bundles for the TIBCO BW installation. We will need just two files that are the following ones:

  • ecs-logging-core-1.5.0.jar
  • logback-ecs-encoder-1.5.0.jar

At the moment of writing this article, current versions are 1.5.0 for each of them, but keep a look to make sure you’re using a recent version of this software to avoid any problems with support and vulnerabilities.

Once we have these libraries, we need to add it to the BW system installation, and we need to do it differently if we are using a TIBCO on-premises installation or a TIBCO BW base installation. To be honest, the things we need to do are the same; the process of doing it is different.

Because, in the end, what we need to do is just a simple task. Include these JAR files as part of the current logback OSGI bundle that TIBCO BW loads. So, let’s see how we can do that and start with an on-premises installation. We will use the TIBCO BWCE 2.8.2 version as an example, but similar steps will be required for other versions.

On-premise installation is the easiest way to do it, but just because it has fewer steps than when we are doing it in a TIBCO BWCE base image. So, in this case, we will go to the following location: <TIBCO_HOME>/bwce/2.8/system/shared/com.tibco.tpcl.logback_1.2.1600.002/

  • We will place the download JARs in that folder
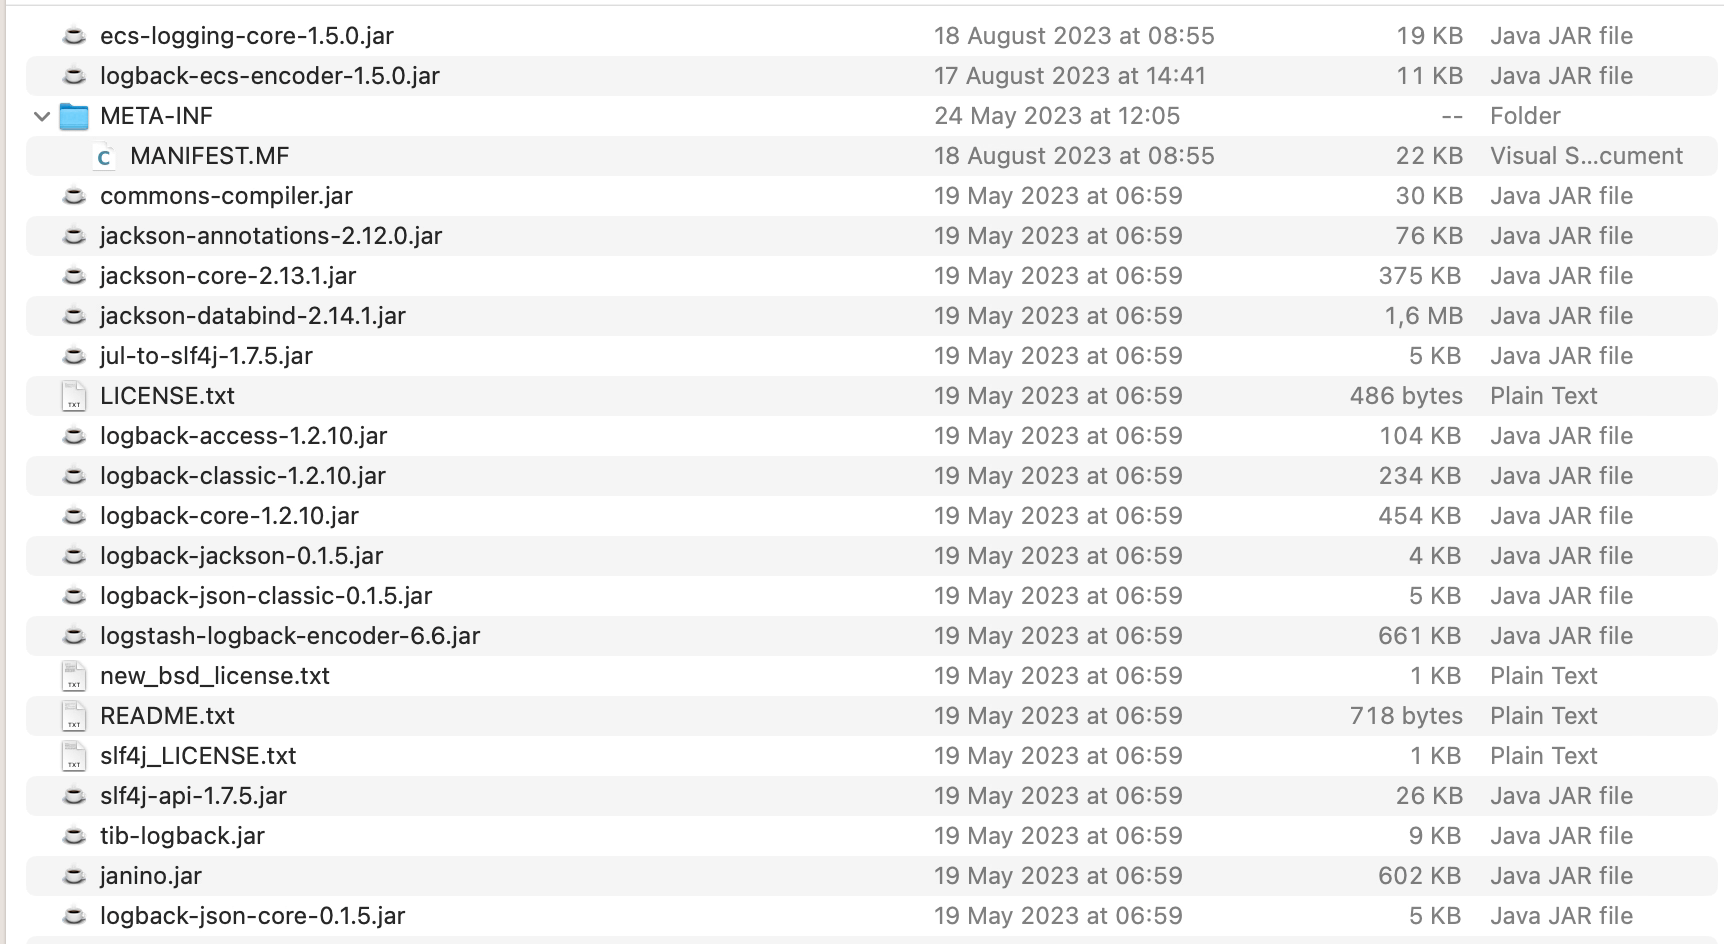
BW ECS Logging: JAR location
  • We will open the META-INF/MANIFEST.MF and do the following modifications:
    • Add those JARs to the Bundle-Classpath section:
BW ECS Logging: Bundle-Classpath changes
  • Include the following package (co.elastic.logging.logback) as part of the exported packages by adding it to the Exported-packagesection:
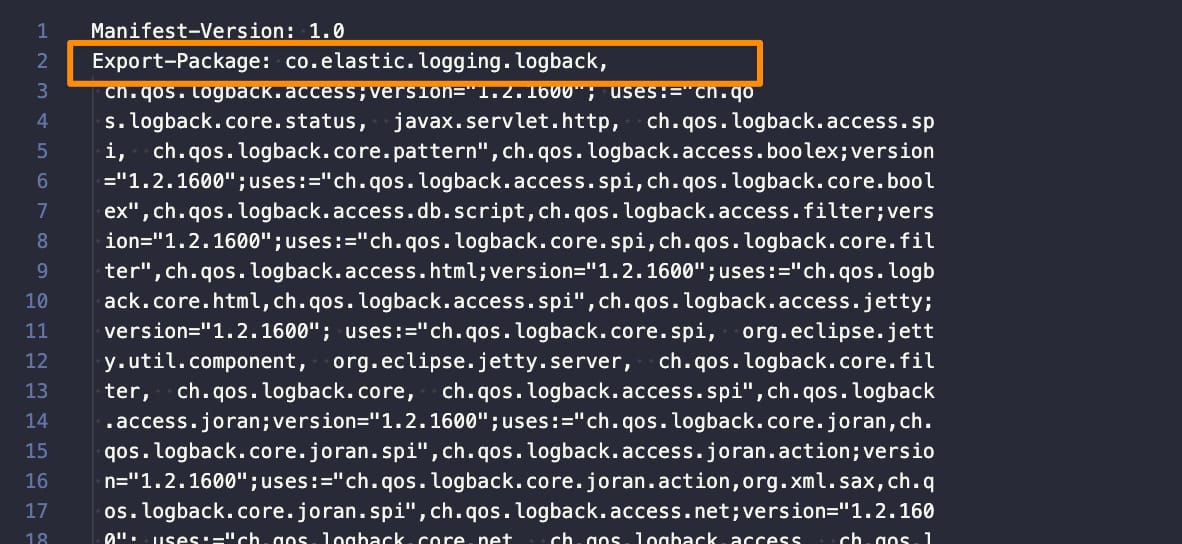
BW ECS Logging: Export-Package changes

Once this is done, our TIBCO BW installation supports ECS format. and we just need to configure the logback.xml to use it, and we can do that relying on the official documentation on the ECS page. We need to include the following encoder, as shown below:

 <encoder class="co.elastic.logging.logback.EcsEncoder">
    <serviceName>my-application</serviceName>
    <serviceVersion>my-application-version</serviceVersion>
    <serviceEnvironment>my-application-environment</serviceEnvironment>
    <serviceNodeName>my-application-cluster-node</serviceNodeName>
</encoder>

For example, if we modify the default logback.xml configuration file with this information, we will have something like this:

<?xml version="1.0" encoding="UTF-8"?>
<configuration scan="true">
  
  <!-- *=============================================================* -->
  <!-- *  APPENDER: Console Appender                                 * -->
  <!-- *=============================================================* -->  
  <appender name="STDOUT" class="ch.qos.logback.core.ConsoleAppender">
    <encoder class="co.elastic.logging.logback.EcsEncoder">
      <serviceName>a</serviceName>
      <serviceVersion>b</serviceVersion>
      <serviceEnvironment>c</serviceEnvironment>
      <serviceNodeName>d</serviceNodeName>
  </encoder>
  </appender>


  <!-- *=============================================================* -->
  <!-- * LOGGER: Thor Framework loggers                              * -->
  <!-- *=============================================================* -->
  <logger name="com.tibco.thor.frwk">
    <level value="INFO"/>
  </logger>


  <!-- *=============================================================* -->
  <!-- * LOGGER: BusinessWorks Framework loggers                     * -->
  <!-- *=============================================================* -->
  <logger name="com.tibco.bw.frwk">
    <level value="WARN"/>
  </logger>  
  
  <logger name="com.tibco.bw.frwk.engine">
    <level value="INFO"/>
  </logger>   
  
  
  <!-- *=============================================================* -->
  <!-- * LOGGER: BusinessWorks Engine loggers                        * -->
  <!-- *=============================================================* --> 
  <logger name="com.tibco.bw.core">
    <level value="WARN"/>
  </logger>
  
  <logger name="com.tibco.bx">
    <level value="ERROR"/>
  </logger>

  <logger name="com.tibco.pvm">
    <level value="ERROR"/>
  </logger>
  
  <logger name="configuration.management.logger">
    <level value="INFO"/>
  </logger>
  
  
  <!-- *=============================================================* -->
  <!-- * LOGGER: BusinessWorks Palette and Activity loggers          * -->
  <!-- *=============================================================* -->
  
  <!-- Default Log activity logger -->
  <logger name="com.tibco.bw.palette.generalactivities.Log">
    <level value="DEBUG"/>
  </logger>
  
  <logger name="com.tibco.bw.palette">
    <level value="ERROR"/>
  </logger>


  <!-- *=============================================================* -->
  <!-- * LOGGER: BusinessWorks Binding loggers                       * -->
  <!-- *=============================================================* -->
  
  <!-- SOAP Binding logger -->
  <logger name="com.tibco.bw.binding.soap">
    <level value="ERROR"/>
  </logger>
  
  <!-- REST Binding logger -->
  <logger name="com.tibco.bw.binding.rest">
    <level value="ERROR"/>
  </logger>


  <!-- *=============================================================* -->
  <!-- * LOGGER: BusinessWorks Shared Resource loggers               * -->
  <!-- *=============================================================* --> 
  <logger name="com.tibco.bw.sharedresource">
    <level value="ERROR"/>
  </logger>


  <!-- *=============================================================* -->
  <!-- * LOGGER: BusinessWorks Schema Cache loggers                  * -->
  <!-- *=============================================================* -->
  <logger name="com.tibco.bw.cache.runtime.xsd">
    <level value="ERROR"/>
  </logger> 
  
  <logger name="com.tibco.bw.cache.runtime.wsdl">
    <level value="ERROR"/>
  </logger> 


  <!-- *=============================================================* -->
  <!-- * LOGGER: BusinessWorks Governance loggers                    * -->
  <!-- *=============================================================* -->  
  <!-- Governance: Policy Director logger1 --> 
  <logger name="com.tibco.governance">
    <level value="ERROR"/>
  </logger>
   
  <logger name="com.tibco.amx.governance">
    <level value="WARN"/>
  </logger>
   
  <!-- Governance: Policy Director logger2 -->
  <logger name="com.tibco.governance.pa.action.runtime.PolicyProperties">
    <level value="ERROR"/>
  </logger>
  
  <!-- Governance: SPM logger1 -->
  <logger name="com.tibco.governance.spm">
    <level value="ERROR"/>
  </logger>
  
  <!-- Governance: SPM logger2 -->
  <logger name="rta.client">
    <level value="ERROR"/>
  </logger>


  <!-- *=============================================================* -->
  <!-- * LOGGER: BusinessWorks Miscellaneous Loggers                 * -->
  <!-- *=============================================================* --> 
  <logger name="com.tibco.bw.platformservices">
    <level value="INFO"/>
  </logger>
  
  <logger name="com.tibco.bw.core.runtime.statistics">
    <level value="ERROR"/>
  </logger>


  <!-- *=============================================================* -->
  <!-- * LOGGER: Other loggers                                       * -->
  <!-- *=============================================================* -->  
  <logger name="org.apache.axis2">
    <level value="ERROR"/>
  </logger>

  <logger name="org.eclipse">
    <level value="ERROR"/>
  </logger>
  
  <logger name="org.quartz">
    <level value="ERROR"/>
  </logger>
  
  <logger name="org.apache.commons.httpclient.util.IdleConnectionHandler">
    <level value="ERROR"/>
  </logger>


  <!-- *=============================================================* -->
  <!-- * LOGGER: User loggers.  User's custom loggers should be      * -->
  <!-- *         configured in this section.                         * -->
  <!-- *=============================================================* -->

  <!-- *=============================================================* -->
  <!-- * ROOT                                                        * -->
  <!-- *=============================================================* --> 
  <root level="ERROR">
   <appender-ref ref="STDOUT" />
  </root>
  
</configuration>

You can also do more custom configurations based on the information available on the ECS encoder configuration page here.

How to enable TIBCO BW ECS Logging Support?

For BWCE, the steps are similar, but we need to be aware that all the runtime components are packaged inside the base-runtime-version.zip that we download from our TIBCO eDelivery site, so we will need to use a tool to open that ZIP and do the following modifications:

  • We will place the download JARs on that folder /tibco.home/bwce/2.8/system/shared/com.tibco.tpcl.logback_1.2.1600.004
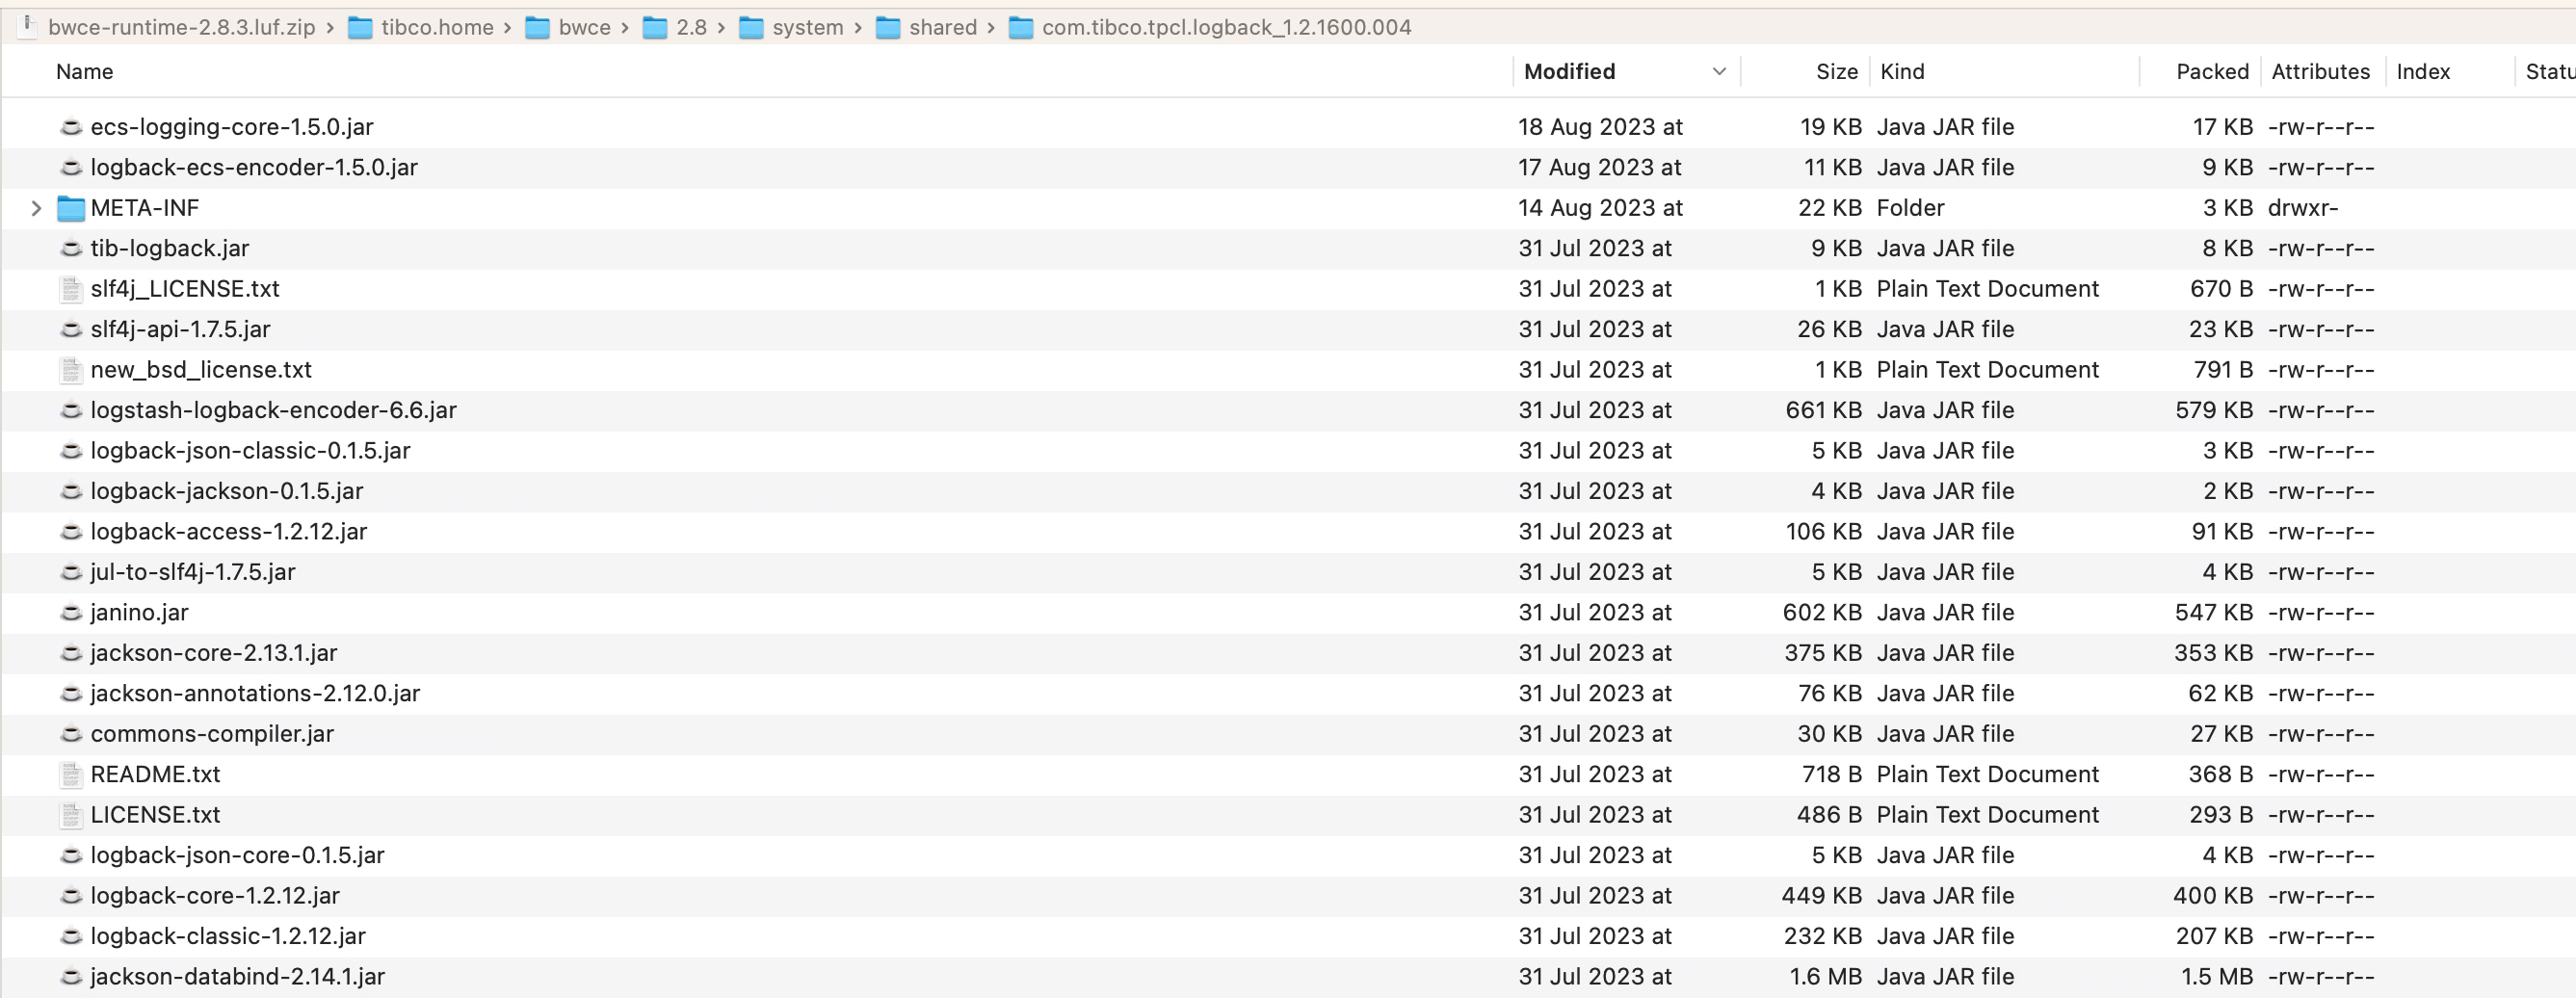
BW ECS Logging: JAR location
  • We will open the META-INF/MANIFEST.MF and do the following modifications:
    • Add those JARs to the Bundle-Classpath section:
BW ECS Logging: Bundle-Classpath changes
  • Include the following package (co.elastic.logging.logback) as part of the exported packages by adding it to the Exported-packagesection:
BW ECS Logging: Export-package changes
  • Additionally we will need to modify the bwappnode in the location /tibco.home/bwce/2.8/bin to add the JAR files also to the classpath that the BWCE base image use to run to ensure this is loading:
BW ECS Logging: bwappnode change

Now we can build our BWCE base image as usual and modify the logback.xml as explained above. Here you can see a sample application using this configuration:

{"@timestamp":"2023-08-28T12:49:08.524Z","log.level": "INFO","message":"TIBCO BusinessWorks version 2.8.2, build V17, 2023-05-19","ecs.version": "1.2.0","service.name":"a","service.version":"b","service.environment":"c","service.node.name":"d","event.dataset":"a","process.thread.name":"main","log.logger":"com.tibco.thor.frwk"}

<>@BWEclipseAppNode> {"@timestamp":"2023-08-28T12:49:25.435Z","log.level": "INFO","message":"Started by BusinessStudio.","ecs.version": "1.2.0","service.name":"a","service.version":"b","service.environment":"c","service.node.name":"d","event.dataset":"a","process.thread.name":"main","log.logger":"com.tibco.thor.frwk.Deployer"}
{"@timestamp":"2023-08-28T12:49:32.795Z","log.level": "INFO","message":"TIBCO-BW-FRWK-300002: BW Engine [Main] started successfully.","ecs.version": "1.2.0","service.name":"a","service.version":"b","service.environment":"c","service.node.name":"d","event.dataset":"a","process.thread.name":"main","log.logger":"com.tibco.bw.frwk.engine.BWEngine"}
{"@timestamp":"2023-08-28T12:49:34.338Z","log.level": "INFO","message":"TIBCO-THOR-FRWK-300001: Started OSGi Framework of AppNode [BWEclipseAppNode] in AppSpace [BWEclipseAppSpace] of Domain [BWEclipseDomain]","ecs.version": "1.2.0","service.name":"a","service.version":"b","service.environment":"c","service.node.name":"d","event.dataset":"a","process.thread.name":"Framework Event Dispatcher: Equinox Container: 1395256a-27a2-4e91-b774-310e85b0b87c","log.logger":"com.tibco.thor.frwk.Deployer"}
{"@timestamp":"2023-08-28T12:49:34.456Z","log.level": "INFO","message":"TIBCO-THOR-FRWK-300018: Deploying BW Application [t3:1.0].","ecs.version": "1.2.0","service.name":"a","service.version":"b","service.environment":"c","service.node.name":"d","event.dataset":"a","process.thread.name":"Framework Event Dispatcher: Equinox Container: 1395256a-27a2-4e91-b774-310e85b0b87c","log.logger":"com.tibco.thor.frwk.Application"}
{"@timestamp":"2023-08-28T12:49:34.524Z","log.level": "INFO","message":"TIBCO-THOR-FRWK-300021: All Application dependencies are resolved for Application [t3:1.0]","ecs.version": "1.2.0","service.name":"a","service.version":"b","service.environment":"c","service.node.name":"d","event.dataset":"a","process.thread.name":"Framework Event Dispatcher: Equinox Container: 1395256a-27a2-4e91-b774-310e85b0b87c","log.logger":"com.tibco.thor.frwk.Application"}
{"@timestamp":"2023-08-28T12:49:34.541Z","log.level": "INFO","message":"Started by BusinessStudio, ignoring .enabled settings.","ecs.version": "1.2.0","service.name":"a","service.version":"b","service.environment":"c","service.node.name":"d","event.dataset":"a","process.thread.name":"Framework Event Dispatcher: Equinox Container: 1395256a-27a2-4e91-b774-310e85b0b87c","log.logger":"com.tibco.thor.frwk.Application"}
{"@timestamp":"2023-08-28T12:49:35.842Z","log.level": "INFO","message":"TIBCO-THOR-FRWK-300006: Started BW Application [t3:1.0]","ecs.version": "1.2.0","service.name":"a","service.version":"b","service.environment":"c","service.node.name":"d","event.dataset":"a","process.thread.name":"EventAdminThread #1","log.logger":"com.tibco.thor.frwk.Application"}
{"@timestamp":"2023-08-28T12:49:35.954Z","log.level": "INFO","message":"aaaaaaa&#10;","ecs.version": "1.2.0","service.name":"a","service.version":"b","service.environment":"c","service.node.name":"d","event.dataset":"a","process.thread.name":"bwEngThread:In-Memory Process Worker-1","log.logger":"com.tibco.bw.palette.generalactivities.Log.t3.module.Log"}
gosh: stopping shell

Increase HTTP Logs in TIBCO BusinessWorks for Debugging and Troubleshooting

Increase HTTP Logs in TIBCO BusinessWorks for Debugging and Troubleshooting

Increasing the HTTP logs in TIBCO BusinessWorks when you are debugging or troubleshooting an HTTP-based integration that could be related to a REST or SOAP service is one of the most used and helpful things you can do when developing with TIBCO BusinessWorks.

This article is part of my comprehensive TIBCO Integration Platform Guide where you can find more patterns and best practices for TIBCO integration platforms.

The primary purpose of increasing the HTTP logs is to get complete knowledge about what information you are sending and which communication you are receiving from your partner communicator to help understand an error or unexpected behavior.

What are the primary use cases for increasing the HTTP logs?

In the end, all the different use cases are variations of the primary use case: “Get full knowledge about the HTTP exchange communication between both parties.” Still, some more detailed ones can be listed below:

  • Understand why a backend server is rejecting a call that could be related to Authentication or Authorization, and you need to see the detailed response by the backend server.
  • Verify the value of each HTTP Header you are sending that could affect the communication’s compression or accepted content type.
  • See why you’re rejecting a call from a consumer

Splitting the communication based on the source

The most important thing to understand is that the logs usually depend on the library you are using, and it is not the same library used to expose an HTTP-based Server as the library you use to consume an HTTP-based service such as REST or a SOAP service.

Starting from what you expose, this is the easiest thing because this will be defined by the HTTP Connector resources you’re using, as you can see in the picture below:

HTTP Shared Resources Connector in BW

All HTTP Connector Resources that you can use to expose REST and SOAP services are based on the Jetty Service implementation, and that means that the loggers that you need to change their configuration are related to the Jetty server itself.

More complex, in theory, are the ones related to the client communication when our TIBCO BusinessWorks application consumes an HTTP-based service provided by a backend because each of these communications has its own HTTP Client Shared Resources. The configuration of each of them will be different because one of the settings we can get here is the Implementation Library, and that will have a direct effect on the way to change the log configuration:

HTTP Client Resource in BW that shows the different implementation libraries to detect the logger to Increasing HTTP Logs in TIBCO BusinessWorks

You have three options when you define an HTTP Client Resource, as you can see in the picture above:

  • Apache HttpComponents: The default one supports HTTP1, SOAP and REST services.
  • Jetty HTTP Client: This client only supports HTTP flows such as HTTP1 and HTTP2, and it would be the primary option when you’re working with HTTP2 flows.
  • Apache Commons: Similar to the first one, but this is currently deprecated, and to be honest, if you have some client component using this configuration, you should change it when you can to the Apache HttpComponents.

So, if we’re consuming a SOAP and REST service, it is clear that we will be using the implementation library Apache HttpComponents, and that will give us the logger we need to use.

Because for Apache HttpComponents, we can rely on the following logger: “org.apache.http” and in case we want to extend the server side, or we’re using Jetty HTTP client, we can use this one: “org.eclipse.jetty.http”

We need to be aware that we cannot extend it just for a single HTTP Client resource because the configuration will be based on the Implementation Library, so in case we set the DEBUG level for the Apache HttpComponents library, it will affect all Shared Resources using this implementation Library, and you’ll need to differentiate based on the data inside the log so that will be part of your data analysis.

How to set HTTP Logs in TIBCO BusinessWorks?

Now that we have the loggers, we must set it to a DEBUG (or TRACE) level. We need to know how to do it, and we have several options depending on how we would like to do it and what access we have. The scope of this article is TIBCO BusinessWorks Container Edition, but you can easily extrapolate part of this knowledge to an on-premises TIBCO BusinessWorks installation.

TIBCO BusinessWorks (container or not) relies on its logging capabilities in the log back library, and this library is configured using a file named logback.xml that could have the configuration that you need, as you can see in the picture below:

logback.xml configuration with the default structure in TIBCO BW

So if we want to add a new logging configuration, we need to add a new element loggerto the file with the following structure:

  <logger name="%LOGGER_WE_WANT_TO_SEE">
    <level value="%LEVEL_WE_WANT_TO_SEE%"/>
  </logger>    

So, the logger was precise based on the previous section, and the level will depend on how much info you want to see. The log Levels are the following ones: ERROR, WARN, INFO, DEBUG, TRACE. DEBUG and TRACE are the ones that show more information.

In our case, DEBUG should be enough to get the full HTTP Request and HTTP Response, but you can also apply it to other things where you could need a different log level.

Now you need to add that to the logback.xml file, and to do that, you have several options, as commented:

  • You can find the logback.xml inside the BWCE container (or the AppNode configuration folder) and modify its content. The default location of this file is this one: /tmp/tibco.home/bwce/<VERSION>/config/logback.xml To do this, you will need to have access to do a kubectl exec on the bwce container, and if you do the change, the change will be temporary and lost in the next restart. That could be something good or bad, depending on your goal.
  • If you want to have it permanent or don’t have access to the container, you have two options. The first one is to include a custom copy of the logback.xml in the /resources/custom-logback/ folder in the BWCE base image and set the environment variable CUSTOM_LOGBACK to TRUE value, and that will override the default logback.xml configuration with the content of this file. As commented, this will be “permanent” and will apply since the first deployment of the app with this configuration. You can find more info the official doc here.
  • There is also an additional one since BWCE 2.7.0 and above that allows you to change the logback.xml content without a new copy or changing the base image, and that’s based on the usage of the environment property BW_LOGGER_OVERRIDES with the content in the following way (logger=value) so in our case it would be something like this org.apache.http=DEBUG and in the next deployment you will get this configuration. Similar to the previous one, this will be permanent but doesn’t require adding a file to the base image to be achievable.

So, as you can see, you have different options depending on your needs and access levels.

Conclusion

In conclusion, enhancing HTTP logs within TIBCO BusinessWorks during debugging and troubleshooting is a vital strategy. Elevating log levels provides a comprehensive grasp of information exchange, aiding in analyzing errors and unexpected behaviors. Whether discerning backend rejection causes, scrutinizing HTTP header effects, or isolating consumer call rejections, amplified logs illuminate complex integration scenarios. Adaptations vary based on library usage, encompassing server exposure and service consumption. Configuration through the logback library involves tailored logger and level adjustments. This practice empowers developers to unravel integration intricacies efficiently, ensuring robust and seamless HTTP-based interactions across systems.

BanzaiCloud Logging Operator on Kubernetes: Log Aggregation in 5 Minutes

BanzaiCloud Logging Operator on Kubernetes: Log Aggregation in 5 Minutes

In the previous article, we described what capability BanzaiCloud Logging Operator provides and its main features. So, today we are going to see how we can implement it.

The first thing we need to do is to install the operator itself, and to do that, we have a helm chart at our disposal, so the only thing that we will need to do are the following commands:

 helm repo add banzaicloud-stable https://kubernetes-charts.banzaicloud.com
helm upgrade --install --wait --create-namespace --namespace logging logging-operator banzaicloud-stable/logging-operator

That will create a logging namespace (in case you didn’t have it yet), and it will deploy the operator components itself, as you can see in the picture below:

BanzaiCloud Logging Operator on Kubernetes: Log Aggregation in 5 Minutes
BanzaiCloud Logging Operator installed using HelmChart

So, now we can start creating the resources we need using the CRD that we commented on in the previous article but to do a recap. These are the ones that we have at our disposal:

  • logging – The logging resource defines the logging infrastructure for your cluster that collects and transports your log messages. It also contains configurations for Fluentd and Fluent-bit.
  • output / clusteroutput – Defines an Output for a logging flow, where the log messages are sent. output will be namespaced based, and clusteroutput will be cluster based.
  • flow / clusterflow – Defines a logging flow using filters and outputs. The flow routes the selected log messages to the specified outputs. flow will be namespaced based, and clusterflows will be cluster based.

So, first of all, we are going to define our scenario. I don’t want to make something complex; I wish that all the logs that my workloads generate, no matter what namespace they are in, are sent to a Grafana Loki instance that I have also installed on that Kubernetes Cluster on a specific endpoint using the Simple Scalable configuration for Grafana Loki.

So, let’s start with the components that we need. First, we need a Logging object to define my Logging infrastructure, and I will create it with the following command.

kubectl -n logging apply -f - <<"EOF"
apiVersion: logging.banzaicloud.io/v1beta1
kind: Logging
metadata:
  name: default-logging-simple
spec:
  fluentd: {}
  fluentbit: {}
  controlNamespace: logging
EOF

We will keep the default configuration for fluentd and fluent-bit just for the sake of the sample, and later on in upcoming articles, we can talk about a specific design, but that’s it.

Once the CRD is processed, the components will appear on your logging namespace. In my case that I’m using a 3-node cluster, I will see 3 instances for fluent-bit deployed as a DaemonSet and a single example of fluentd, as you can see in the picture below:

BanzaiCloud Logging Operator on Kubernetes: Log Aggregation in 5 Minutes
BanzaiCloud Logging Operator configuration after applying Logging CRD

So, now we need to define the communication with Loki, and as I would like to use this for any namespace I can have on my cluster, I will use the ClusterOutput option instead of the normal Output one that is namespaced based. And to do that, we will use the following command (please ensure that the endpoint is the right one; in our case, this is loki-gateway. default as it is running inside the Kubernetes Cluster:

kubectl -n logging apply -f - <<"EOF"
apiVersion: logging.banzaicloud.io/v1beta1
kind: ClusterOutput
metadata:
 name: loki-output
spec:
 loki:
   url: http://loki-gateway.default
   configure_kubernetes_labels: true
   buffer:
     timekey: 1m
     timekey_wait: 30s
     timekey_use_utc: true
EOF

And pretty much we have everything; we just need one flow to communicate our Logging configuration to the ClusterOutput we just created. And again, we will go with the ClusterFlow because we would like to define this at the Cluster level and not in a by-namespaced fashion. So we will use the following command:

 kubectl -n logging  apply -f - <<"EOF"
apiVersion: logging.banzaicloud.io/v1beta1
kind: ClusterFlow
metadata:
  name: loki-flow
spec:
  filters:
    - tag_normaliser: {}
  match:
    - select: {}
  globalOutputRefs:
    - loki-output
EOF

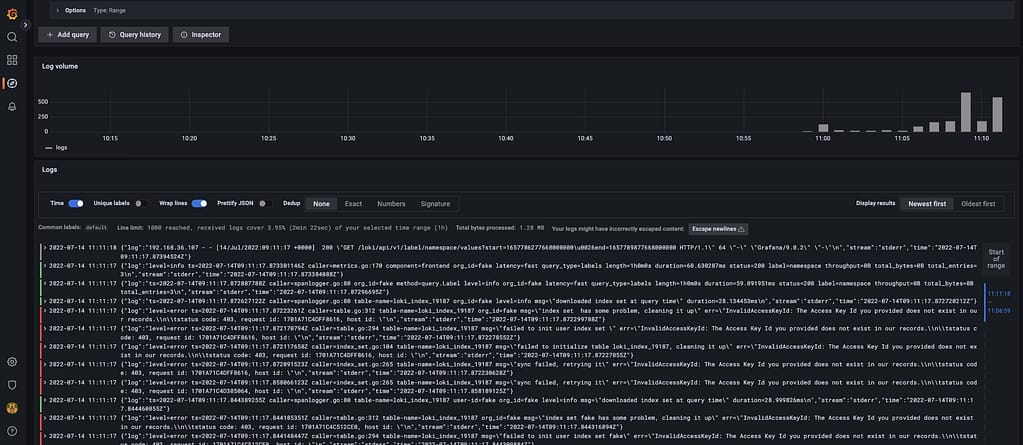
And after some time to do the reload of the configuration (1-2 minutes or so), you will start to see in the Loki traces something like this:

BanzaiCloud Logging Operator on Kubernetes: Log Aggregation in 5 Minutes
Grafana showing the logs submitted by the BanzaiCloud Logging Operator

And that indicates that we are already receiving push of logs from the different components, mainly the fluentd element we configured in this case. But I think it is better to see it graphically with Grafana:

BanzaiCloud Logging Operator on Kubernetes: Log Aggregation in 5 Minutes
Grafana showing the logs submitted by the BanzaiCloud Logging Operator

And that’s it! And to change our logging configuration is as simple as changing the CRD component we defined, applying matches and filters, or sending it to a new place. Straightforwardly we have this completely managed.

📚 Want to dive deeper into Kubernetes? This article is part of our comprehensive Kubernetes Architecture Patterns guide, where you’ll find all fundamental and advanced concepts explained step by step.

Log Aggregation in Kubernetes Explained with BanzaiCloud Logging Operator

Log Aggregation in Kubernetes Explained with BanzaiCloud Logging Operator

We already have talked about the importance of Log Aggregation in Kubernetes and why the change in the behavior of the components makes it a mandatory requirement for any new architecture we deployed today.

To solve that part, we have a lot of different stacks that you probably have heard about. For example, if we follow the traditional Elasticsearch path, we will have the pure ELK stack from Elasticsearch, Logstash, and Kibana. Now this stack has been extended with the different “Beats” (FileBeat, NetworkBeat, …) that provides a light log forwarder to be added to the task.

Also, you can change Logstash for a CNCF component such as Fluentd that probably you have heard about, and in that case, we’re talking about an EFK stack following the same principle. And also, have the Grafana Labs view using promtail, Grafana Loki, and Grafana for dashboarding following a different perspective.

Then you can switch and change any component for the one of your preference, but in the end, you will have three different kinds of components:

  • Forwarder: Component that will listen to all the log inputs, mainly the stdout/stderr output from your containers, and push it to a central component.
  • Aggregator: Component that will receive all the traces for the forwarded, and it will have some rules to filter some of the events, format, and enrich the ones received before sending it to central storage.
  • Storage: Component that will receive the final traces to be stored and retrieved for the different clients.

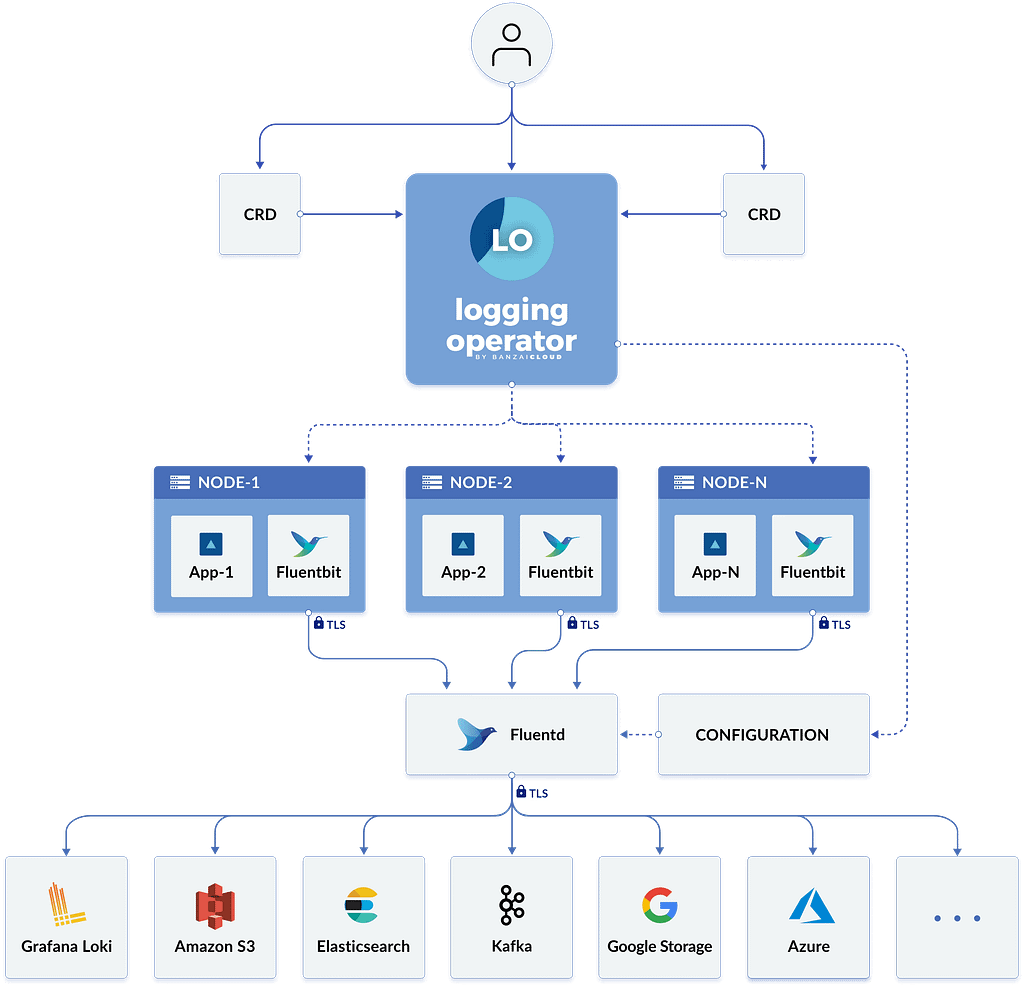
To simplify the management of that in Kubernetes, we have a great Kubernetes Operator named BanzaiCloud Logging Operator that tries to follow that approach in a declarative / policy manner. So let’s see how it works, and to explain it better, I will use its central diagram from its website:

Log Aggregation in Kubernetes Explained with BanzaiCloud Logging Operator
BanzaiCloud Logging Operator Architecture

This operator uses the same technologies we were talking about. It covers mainly the two first steps: Forwarding and Aggregation and the configuration to be sent to a Central Storage of your choice. To do that works with the following technologies, all of them part of the CNCF Landscape:

  • Fluent-bit will act as a forwarded deployed on a DaemonSet mode to collect all the logs you have configured.
  • Fluentd will act as an aggregator defining the flows and rules of your choice to adapt the trace flow you are receiving and sending to the output of your choice.

And as this is a Kubernetes Operator, this works in a declarative way. We will define a set of objects that will define our logging policies. We have the following components:

  • logging – The logging resource defines the logging infrastructure for your cluster that collects and transports your log messages. It also contains configurations for Fluentd and Fluent-bit.
  • output / clusteroutput – Defines an Output for a logging flow, where the log messages are sent. output will be namespaced based, and clusteroutput will be cluster based.
  • flow / clusterflow – Defines a logging flow using filters and outputs. The flow routes the selected log messages to the specified outputs. flow will be namespaced based, and clusterflows will be cluster based.

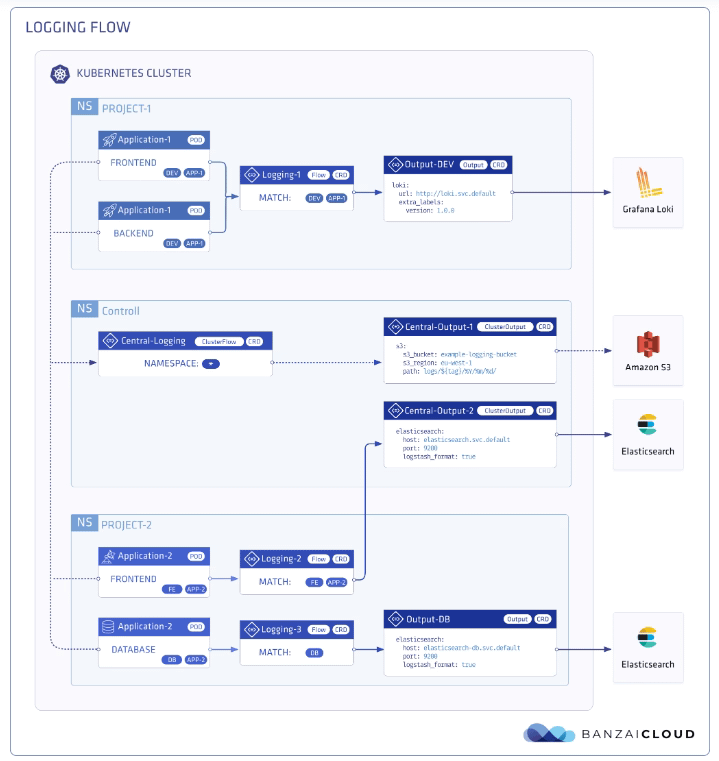
In the picture below, you will see how these objects are “interacting” to define your desired logging architecture:

Log Aggregation in Kubernetes Explained with BanzaiCloud Logging Operator
BanzaiCloud Logging Operator CRD Relationship

And apart from the policy mode, it also includes a lot of great features such as:

  • Namespace isolation
  • Native Kubernetes label selectors
  • Secure communication (TLS)
  • Configuration validation
  • Multiple flow support (multiply logs for different transformations)
  • Multiple output support (store the same logs in multiple storages: S3, GCS, ES, Loki, and more…)
  • Multiple logging system support (multiple Fluentd, Fluent Bit deployment on the same cluster)

In upcoming articles we were talking about how we can implement this so you can see all the benefits that this CRD-based, policy-based approach can provide to your architecture.

📚 Want to dive deeper into Kubernetes? This article is part of our comprehensive Kubernetes Architecture Patterns guide, where you’ll find all fundamental and advanced concepts explained step by step.

Grafana Loki with MinIO: Scalable Log Storage for Kubernetes without S3

Grafana Loki with MinIO: Scalable Log Storage for Kubernetes without S3

Grafana Loki is becoming one of the de-facto standards for log aggregation in Kubernetes workloads nowadays, and today, we are going to show how we can use together Grafana Loki and MinIO. We already have covered on several occasions the capabilities of Grafana Loki that have emerged as the main alternative to the Elasticsearch leadership in the last 5-10 years for log aggregation.

With a different approach, more lightweight, more cloud-native, more focus on the good things that Prometheus has provided but for logs and with the sponsorship of a great company such as Grafana Labs with the dashboard tools as the leader of each day more enormous stack of tools around the observability world.

And also, we already have covered MinIO as an object store that can be deployed anywhere. It’s like having your S3 service on whatever cloud you like or on-prem. So today, we are going to see how both can work together.

Grafana Loki mainly supports three deployment models: monolith, simple-scalable, and distributed. Pretty much everything but monolith has the requirement to have an Object Storage solution to be able to work on a distributed scalable mode. So, if you have your deployment in AWS, you already have covered with S3. Also, Grafana Loki supports most of the Object Storage solutions for the cloud ecosystem of the leading vendors. Still, the problem comes when you would like to rely on Grafana Loki for a private cloud or on-premises installation.

In that case, is where we can rely on MinIO. To be honest, you can use MinIO also in the cloud world to have a more flexible and transparent solution and avoid any lock-in with a cloud vendor. Still, for on-premises, its uses have become mandatory. One of the great features of MinIO is that it implements the S3 API, so pretty much anything that supports S3 will work with MinIO.

In this case, I just need to adapt some values on the helm chart from Loki in the simple-distributed mode as shown below:

 loki:
  storage:
    s3:
      s3: null
      endpoint: http://minio.minio:9000
      region: null
      secretAccessKey: XXXXXXXXXXX
      accessKeyId: XXXXXXXXXX
      s3ForcePathStyle: true
      insecure: true

We’re just pointing to the endpoint from our MinIO tenant, in our case, also deployed on Kubernetes on port 9000. We’re also providing the credentials to connect and finally just showing that needs s3ForcePathSyle: true is required for the endpoint to be transformed to minio.minio:9000/bucket instead to bucket.minio.minio:9000, so it will work better on a Kubernetes ecosystem.

And that’s pretty much it; as soon as you start it, you will begin to see that the buckets are starting to be populated as they will do in case you were using S3, as you can see in the picture below:

MinIO showing buckets and objects from Loki configuration

We already covered the deployment models from MinIO. As shown here, you can use its helm chart or the MinIO operator. But, the integration with Loki it’s even better because the helm charts from Loki already included MinIO as a sub-chart so you can deploy MinIO as part of your Loki deployment based on the configuration you will find on the values.yml as shown below:

 # -------------------------------------
# Configuration for `minio` child chart
# -------------------------------------
minio:
  enabled: false
  accessKey: enterprise-logs
  secretKey: supersecret
  buckets:
    - name: chunks
      policy: none
      purge: false
    - name: ruler
      policy: none
      purge: false
    - name: admin
      policy: none
      purge: false
  persistence:
    size: 5Gi
  resources:
    requests:
      cpu: 100m
      memory: 128Mi

So with a single command, you can have both platforms deployed and configured automatically! I hope this is as useful for you as it was for me when I discovered and did this process.

📚 Want to dive deeper into Kubernetes? This article is part of our comprehensive Kubernetes Architecture Patterns guide, where you’ll find all fundamental and advanced concepts explained step by step.

Log Aggregation Architecture Explained: 3 Reasons You Need It Today

Log Aggregation Architecture Explained: 3 Reasons You Need It Today

Log Aggregation are not more a commodity but a critical component in container-based platforms

Log Management doesn’t seem like a very fantastic topic. It is not the topic that you see and says: “Oh! Amazing! This is what I was dreaming about my whole life”. No, I’m aware that this is not to fancy, but that doesn’t make it less critical than other capabilities that you’re architecture needs to have.

Since the start of time, we’ve been used log files as the single trustable data source when it was related to troubleshoot your applications or know what was failed in your deployment or any other actions regarding a computer.

The procedure was easy:

  • Launch “something”
  • “something” failed.
  • Check the logs
  • Change something
  • Repeat

And we’ve been doing it that way for a long, long time. Even with other more robust error handling and management approaches like Audit System, we also go back to logs when we need to get the fine-grained detail about the error. Look for a stack trace there, more detail about the error that was inserted into the Audit System or more data than just the error code and description thas was provided by a REST API.

Systems starting to grow, architecture became more complicated, but even with that, we end with the same method over and over. You’re aware of log aggregation architectures like the ELK stack or commercial solutions like Splunk or even SaaS offerings like Loggly, but you just think they’re not just for you.

They’re expensive to buy or expensive to set, and you know very well your ecosystem, and it’s easier to just jump into a machine and tail the log file. Probably you also have your toolbox of scripts to do this as quickly as anyone can open Kibana and try to search for something instance ID there to see the error for a specific transaction.

Ok, I need to tell you something: It’s time to change, and I’m going to explain to you why.

Things are changing, and IT and all the new paradigms are based on some common grounds:

  • You’re going to have more components that are going to run isolated with its log files and data.
  • Deployments will be more regular in your production environment, and that means that things are going to be wrong more usual (on a controlled way, but more usual)
  • Technologies are going to coexist, so logs are going to be very different in terms of patterns and layouts, and you need to be ready for that.

So, let’s discuss these three arguments that I hope make you think in a different way about Log Management architectures and approaches.

1.- Your approach just doesn’t scale

Your approach is excellent for traditional systems. How many machines do you manage? 30? 50? 100? And you’re able to do it quite fine. Imagine now a container-base platform for a typical enterprise. I think an average number could be around 1000 containers just for business purposes, not talking about architecture or basic services. Are you able to be ready to go container by container to check 1000 logs streams to know the error?

Even if that’s possible, are you going to be the bottleneck for the growth of your company? How many container logs do you can keep a trace on? 2000? As I was saying at the beginning, that just not scale.

2.- Logs are not there forever

And now, you read the first topic and probably are you just saying to the screen you’re using to read is. Come on! I already know that logs are not there, they’re getting rotated, they got lost, and so on.

Yeah, that’s true, this is even more important in cloud-native approach. With container-based platforms, logs are ephemeral, and also, if we follow the 12-factor app manifesto there is no file with the log. All log traces should be printed to the standard output, and that’s it.

And where the logs are deleted? When the container fails.. and which records are the ones that you need more? The ones that have been failed.

So, if you don’t do anything, the log traces that you need the most are the ones that you’re going to lose.

3.- You need to be able to predict when things are going to fail

But logs are not only valid when something goes wrong are adequate to detect when something is going to be wrong but to predict when things are going to fail. And you need to be able to aggregate that data to be able to generate information and insights from it. To be able to run ML models to detect if something is going as expected or something different is happening that could lead to some issue before it happens.

Summary

I hope these arguments have made you think that even for your small size company or even for your system, you need to be able to set up a Log Aggregation technique now and not wait for another moment when it will probably be too late.