Top 6 Kubectl Commands and Kubectl Tips

Top 6 Kubectl Commands and Kubectl Tips

Kubectl command can be the most used command you can type when working with the Kubernetes ecosystem. As you know, kubectl is the open the door to all the Kubernetes world as pretty much all of our interactions go through that part, unless you are using a CLI approach.

So, based on the productivity principles, if you can improve just 1% in the task that you perform the most, the global improvement will be massive. So, let’s see how we can do that here.

kubectl is a command with many different options that could help boost your productivity a lot. But at the same time, as it has so many options, it is pretty complex to know all of them or be aware that there is a faster way to do the job, and that’s why I would like to add some options here to try to help you with this set of kubectl tips.

Kubectl Commands Tips

Let’s start with the first kubectl commands that help a lot to improve your productivity:

kubectl explain <resource-object>

This command will show the API reference for any Kubernetes Object, so it would help you know the exact spelling of the option that you always miswrite.

kubectl get <resource-object> —watch-output

The —watch-output option added to any kubectl command will work in the same way as the watch command itself, so it will refresh the same command every 2.0 seconds to see the real-time version of that command and avoid that you need to type it again or rely on an external command such as watch

kubectl get events --sort-by=".lastTimestamp"

This command will help you when you want to see the events in your current context, but the main difference is that it will sort the output by the timestamp from more recent to older, so you will avoid needing to scroll to find the latest events.

kubectl logs --previous

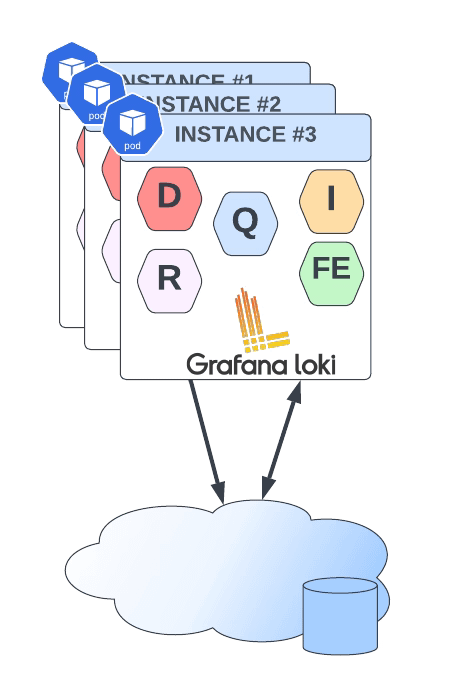
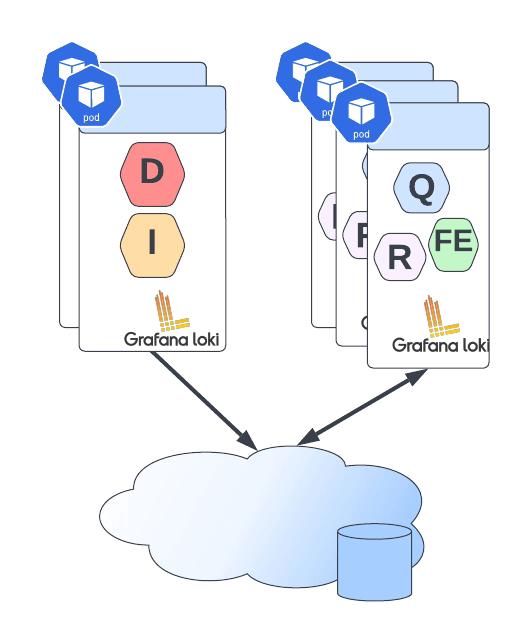
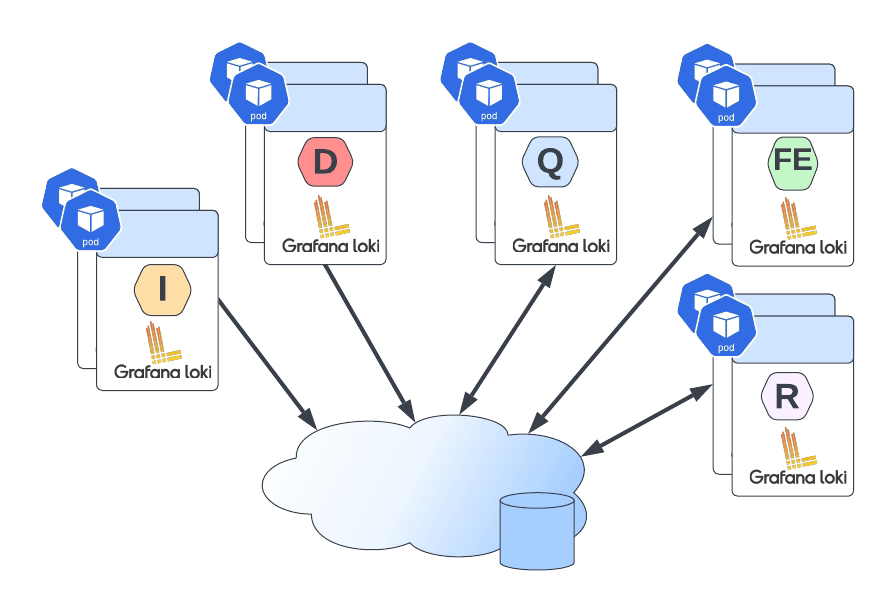
We always talk about one of the needs for a Log Aggregation Architecture because the logs are disposable, but what about if you want to get the logs in a killed container? You can use the --previous flag to access the logs for a recently terminated container. This will not remove the need for a logging aggregation technique, but it will help troubleshoot when Kubernetes start killing things and you need to know what happened.

kubectl create <object> <options> -o=yaml --dry-run=client

kubectl create allows us to create an object of our preference by providing the required arguments imperatively, but if we add the -o=yaml --dry-run=client option, we will not get our object created. Instead, we will have a YAML file defining that object. So we can easily modify it to our needs without needing to make it from scratch by searching Google for a sample to start with.

kubectl top pods --all-namespaces --sort-by='memory'

This command will alter the standard top pods order to show the pods and the resources they are consuming, and at the same time, it will sort that output by the memory usage. So, in environments with many pods, it will provide just at the top the ones you should focus on first to optimize the resources for your whole cluster.

Kubectl Alias

One step beyond that is to simplify those commands by adding an alias to this. As you can see, most of these commands are pretty long as they have many options, so writing each of these options will take a while.

So, if you want to go one step further on this optimization, you can always add an alias to that command to simplify it a lot. And if you want to learn more about those aliases, I strongly recommend the GitHub repo from Ahmet Alp Balkan:

MinIO: Multi Cloud Object Storage

All The Power of Object Storage In Your Kubernetes Environment

MinIO: Multi Cloud Object Storage
MinIO: Multi Cloud Object Storage (Photo by Timelab Pro on Unsplash)

In this post, I would like to bring to you MinIO, a real cloud object storage solution with all the features you can imagine and even some more. You are probably aware of Object Storage from the AWS S3 service raised some years ago and most of the alternatives in the leading public cloud providers such as Google or Azure.

But what about private clouds? Is it something available that can provide all the benefits of object storage, but you don’t need to rely on a single cloud provider. And even more important than that, in the present and future, that all companies are going to be multi cloud do we have at our disposal a tool that provides all these features but doesn’t force us to have a vendor lock-in. Even some software, such as Loki, encourages you to use an object storage solution

The answer is yes! And this is what MinIO is all about, and I just want to use their own words:

“MinIO offers high-performance, S3 compatible object storage. Native to Kubernetes, MinIO is the only object storage suite available on every public cloud, Kubernetes distribution, the private cloud, and the edge. MinIO is software-defined and is 100% open source under GNU AGPL v3.”

So, as I said, everything you can imagine and even more. Let’s focus on some points:

  • Native to Kubernetes: You can deploy it in any Kubernetes distribution of choice, whether this is public or private (or even edge).
  • 100% open source under GNU AGPL v3, so no vendor lock-in.
  • S3 compatible object storage, so it even simplifies the transition for customers with a strong tie with the AWS service.
  • High-Performance is the essential feature.

Sounds great. Let’s try it in our environment! So I’m going to install MinIO in my rancher-desktop environment, and doing that, I am going to use the operator that they have available here:

To be able to install, the recommended option is to use krew, the plugin manager we already talked about it in another article. The first thing we need to do is run the following command.

 kubectl minio init

This command will deploy the operator on the cluster as you can see in the picture below:

Once done and all the components are running we can launch the Graphical interfaces that will help us create the storage tenant. To do so we need to run the following command:

 kubectl minio proxy -n minio-operator

This will expose the internal interface that will help us during that process. We will be provided a JWT token to be able to log into the platform as you can see in the picture below:

Now we need to click on the button that says “Create Tenant” which will provide us a Wizard menu to create our MinIO object storage tenant:

On that wizard we can select several properties depending on our needs, as this is for my rancher desktop, I’ll try to keep the settings at the minimum as you can see here:

It would help if you had the namespace created in advance to be retrieved here. Also, you need to be aware that there can be only one tenant per namespace, so you will need additional namespaces to create other tenants.

As soon as you hit create, you will be provided with an API Key and Secret that you need to store (or download) to be able to use later, and after that, the tenant will start its deployment. After a few minutes, you will have all your components running, as you can see in the picture below:

If we go to our console-svc, you will find the following GUI available:

After the credentials are download in the previous step, we will enter the console for our cloud object store and be able to start creating our buckets as you can see in the picture below:

On the screen of creating a bucket, you can see several options, such as Versioning, Quota, and Object Locking, that give a view of the features and capability this solution has

And we can start uploading and downloading objects to this new bucket created:

I hope you can see this as an option for your deployments, especially when you need an Object Storage solution option for private deployments or just as an AWS S3 alternative.

Top 3 Options To Deploy Scalable Loki On Kubernetes

Deployment Models for a Scalable Log Aggregation Architecture using Loki

Deploy Scalable Loki Solution

Deploy a scalable Loki is not an straightforward task. We already have talked about Loki in previous posts on the site, and it is becoming more and more popular, and usage becomes much more regular each day. That is why I think it makes sense to include another post regarding Loki Architecture.

Loki has several advantages that promote it as a default choice to deploy a Log Aggregation Stack. One of them is its scalability because you can see across different deployment models how many components you like to deploy and their responsibilities. So the target of the topic is to show you how to deploy an scalable Loki solution and this is based on two concepts: components available and how you group them.

So we will start with the different components:

  • ingester: responsible for writing log data to long-term storage backends (DynamoDB, S3, Cassandra, etc.) on the write path and returning log data for in-memory queries on the read path.
  • distributor: responsible for handling incoming streams by clients. It’s the first step in the write path for log data.
  • query-frontend: optional service providing the querier’s API endpoints and can be used to accelerate the read path
  • querier: service handles queries using the LogQL query language, fetching logs from the ingesters and long-term storage.
  • ruler: responsible for continually evaluating a set of configurable queries and performing an action based on the result.

Then you can join them into different groups, and depending on the size of these groups, you have a different deployment topology, as shown below:

Loki Monolith Deployment Mode
  • Monolith: As you can imagine, all components are running together in a single instance. This is the simplest option and is recommended as a 100 GB / day starting point. You can even scale this deployment, but it will scale all components simultaneously, and it should have a shared object state.
Loki Simple Scalable Deployment Mode
  • Simple Scalable Deployment Model: This is the second level, and it can scale up at several TB of logs per day. It consists of splitting the components into two different profiles: read and write.
Loki Microservice Deployment Mode
  • Microservices: That means that each component will be managed independently, giving you all the power at your hand to scale each of these components alone.

Defining the deployment model of each instance is very easy, and it is based on a single parameter named target. So depending on the value of the target it will follow one of the previous deployment models:

  • all (default): It will deploy as in monolith mode.
  • write: It will be the write path on the simple scalable deployment model
  • read: It will be the reading group on the simple, scalable deployment model
  • ingester, distributor, query-frontend, query-scheduler, querier, index-gateway, ruler, compactor: Individual values to deploy a single component for the microservice deployment model.

The target argument will help for an on-premises kind of deployment. Still, if you are using Helm for the installation, Loki already provides different helm charts for the other deployment models:

But all those helm charts are based on the same principle commented above on defining the role of each instance using the argument target, as you can see in the picture below:

How To Enable Access Logs on Openshift Default Routes

white and gray spiral stairs

Put some brain when a route is not working as expected, or your consumers are not able to reach the service

We all know that Openshift is an outstanding Kubernetes Distribution and one of the most used mainly when talking about private-cloud deployments. Based on the solid reputation of Red Hat Enterprise Linux, Openshift was able to create a solid product that is becoming almost a standard for most enterprises.

It provides a lot of extensions from the Vanilla Kubernetes style, including some of the open-source industry standards such as Prometheus, Thanos, and Grafana for Metrics Monitoring or ELK stack for Logging Aggregation but also including its extensions such as the Openshift Routes.

Openshift Routes was the initial solution before the Ingress concept was a reality inside the standard. Now, it also implements following that pattern to keep it compatible. It is backed by HAProxy, one of the most known reverse-proxy available in the open-source community.

One of the tricky parts by default is knowing how to debug when one of your routes is not working as expected. The way you create routes is so easy that anyone can make it in a few clicks, and if everything works as expected, that’s awesome.

But if it doesn’t, the problems start because, by default, you don’t get any logging about what’s happening. But that’s what we are going to solve here.

First, we will talk a little more about how this is configured. Currently (Openshift 4.8 version), this is implemented, as I said, using HAProxy by default so if you are using other technology as ingresses such as Istio or Nginx, this article is not for you (but don’t forget to leave a comment if a similar kind of article would be of your interest so I can also bring it to the back-log 🙂 )

From the implementation perspective, this is implemented using the Operator Framework, so the ingress is deployed as an Operator, and it is available in the openshift-ingress-operator namespace.

ingress-operator pods on Openshift ecosystem

So, as this is an operator, several Custom Resources Definition (CRD) have been installed to work with this, one of the most interesting of this article. This CRD is Ingress Controllers.

Ingress instances on Openshift Ecosystem

By default, you will only see one instance named default. This is the one that includes the configuration of the ingress that is being deployed, so we need to add here an additional configuration to have also the logs.

Ingress controller YAML file

The snippet that we need to that is the one shown below under the spec parameter that starts the definition of the specification of the IngressController itself:

   logging:
    access:
      destination:
        type: Container
      httpLogFormat: >-
        log_source="haproxy-default" log_type="http" c_ip="%ci" c_port="%cp"
        req_date="%tr" fe_name_transport="%ft" be_name="%b" server_name="%s"
        res_time="%TR" tot_wait_q="%Tw" Tc="%Tc" Tr="%Tr" Ta="%Ta"
        status_code="%ST" bytes_read="%B" bytes_uploaded="%U"
        captrd_req_cookie="%CC" captrd_res_cookie="%CS" term_state="%tsc"
        actconn="%ac" feconn="%fc" beconn="%bc" srv_conn="%sc" retries="%rc"
        srv_queue="%sq" backend_queue="%bq" captrd_req_headers="%hr"
        captrd_res_headers="%hs" http_request="%r"
 

This will make another container deployed on the router pods in the openshift-ingressnamespace following the sidecar pattern named logs.

Router pods on Openshift Installation

This container will print the logs from the requests reaching the ingress component, so next time your consumer is not able to call your service, you will be able to see the incoming requests with all their metadata and know at least what is doing wrong:

Openshift Route Access Logs

As you can see, simple and easy!! If you don’t need it anymore, you can again remove the configuration and save it, and the new version will be rolled out and go back to normal.

How To Improve Your Kubernetes Workload Development Productivity

timelapse photo of highway during golden hour

Telepresence is the way to reduce the time between your lines of code and a cloud-native workload running.

timelapse photo of highway during golden hour
Photo by Joey Kyber on Unsplash

We all know how cloud-native workloads and Kubernetes have changed how we do things. There are a lot of benefits that come with the effect of containerization and orchestration platforms such as Kubernetes, and we have discussed a lot about it: scalability, self-healing, auto-discovery, resilience, and so on.

But some challenges have been raised, most of them on the operational aspect that we have a lot of projects focused on tackling, but usually, we forget about what the ambassador has defined as the “inner dev cycle.”

The “inner dev cycle” is the productive workflow that each developer follows when working on a new application, service, or component. This iterative flow is where we code, test what we’ve coded, and fix what is not working or improve what we already have.

This flow has existed since the beginning of time; it doesn’t matter if you were coding in C using STD Library or COBOL in the early 1980 or doing nodejs with the latest frameworks and libraries at your disposal.

We have seen movements towards making this inner cycle more effective, especially in front-end development. We have many options to see the last change we have done in code, just saving the file. But for the first time when the movement to a container-based platform, this flow makes devs less productive.

The main reason is that the number of tasks a dev needs to do has increased. Imagine this set of steps that we need to perform:

  • Build the app
  • Build the container image
  • Deploy the container image in Kubernetes

These actions are not as fast as testing your changes locally, making devs less productive than before, which is what the “telepresence” project is trying to solve.

Telepresence is an incubator project from the CNCF that has recently focused a lot of attention because it has included OOTB in the latest releases of the Docker Desktop component. Based on its own words, this is the definition of the telepresence project:

Telepresence is an open-source tool that lets developers code and test microservices locally against a remote Kubernetes cluster. Telepresence facilitates more efficient development workflows while relieving the need to worry about other service dependencies.

Ok, so let’s see how we can start? Let’s dive in together. The first thing we need to do is to install telepresence in our Kubernetes cluster:

Note: It is also a way to install telepresence using Helm in your cluster following these steps:

helm repo add datawire  https://app.getambassador.io
helm repo update
kubectl create namespace ambassador
helm install traffic-manager --namespace ambassador datawire/telepresence

Now I will create a simple container that will host a Golang application that exposes a simple REST service and make it more accessible; I will follow the tutorial that is available below; you can do it as well.

Once we have our golang application ready, we are going to generate the container from it, using the following Dockerfile:

FROM golang:latest

RUN apt-get update
RUN apt-get upgrade -y

ENV GOBIN /go/bin

WORKDIR /app

COPY *.go ./
RUN go env -w GO111MODULE=off
RUN go get .
RUN go build -o /go-rest
EXPOSE 8080
CMD [ "/go-rest" ]

Then once we have the app, we’re going to upload to the Kubernetes server and run it as a deployment, as you can see in the picture below:

kubectl create deployment rest-service --image=quay.io/alexandrev/go-test  --port=8080
kubectl expose deploy/rest-service

Once we have that, it is the moment to start executing the telepresence, and we will start connecting to the cluster using the following command telepresence connect, and it will show an output like this one:

Then we are going to list the endpoints available to intercept with the command telepresence listand we will see our rest-service that we have exposed before:

Now, we will run the specific interceptor, but before that, we’re going to do the trick so we can connect it to our Visual Studio Code. We will generate a launch.json file in Visual Studio Code with the following content:

{
    // Use IntelliSense to learn about possible attributes.
    // Hover to view descriptions of existing attributes.
    // For more information, visit: https://go.microsoft.com/fwlink/?linkid=830387
    "version": "0.2.0",
    "configurations": [
        {
            "name": "Launch with env file",
            "type": "go",
            "request": "launch",
            "mode": "debug",
            "program": "1",
            "envFile": "NULL/go-debug.env"
           }
    ]
}

The interesting part here is the envFile argument that points to a non-existent file go-debug.env on the same folder, so we need to make sure that we generate that file when we do the interception. So we will use the following command:

telepresence intercept rest-service --port 8080:8080 --env-file /Users/avazquez/Data/Projects/GitHub/rest-golang/go-debug.env

And now, we can start our debug session in Visual Studio code and maybe add a breakpoint and some lines, as you can see in the picture below:

So, now, if we hit the pod in Kubernetes, we will see how the breakpoint is being reached as we were in a local debugging session.

That means that we can inspect variables and everything, change the code, or do whatever we need to speed up our development!

Prometheus ServiceMonitor and PodMonitor: Don’t Miss The New Concepts!

black flat screen tv turned on near black and gray audio component

Discover the differences between two of the most used CRDs from Prometheus Operator and how to use each of them.

Prometheus Concepts: ServiceMonitor and PodMonitor

Photo by Ibrahim Boran on Unsplash

ServiceMonitor and PodMonitor are terms that you will start to see more often when talking about using Prometheus. We have covered a lot about Prometheus in the past articles. It is one of the primary references when we talk about monitoring in a cloud-native environment and is specially focused on the Kubernetes ecosystem.

Prometheus has a new deployment model under the Kubernetes Operator Framework in recent times. That has generated several changes in terms of resources and how we configure several aspects of the monitoring of our workloads. Some of these concepts are now managed as Customer Resource Definition (CRD) that are included to simplify the system’s configuration and be more aligned with the capabilities of the Kubernetes platform itself. This is great but, at the same time, changes how we need to use this excellent monitoring tool for cloud-native workloads.

Today, we will cover two of these new CRDs, one of the most relevant ones: ServiceMonitor and PodMonitor. These are the new objects that specify the resources that will be under monitoring scope to the platform, and each of them covers a different type of object, as you can imagine: Services and Pods.

Each of them has its definition file with its particular fields and metadata, and to highlight them, I will present a sample for each of them below:

Service Monitor

apiVersion: monitoring.coreos.com/v1
kind: ServiceMonitor
metadata:
  labels:
    serviceMonitorSelector: prometheus
  name: prometheus
  namespace: prometheus
spec:
  endpoints:
  - interval: 30s
    targetPort: 9090
    path: /metrics
  namespaceSelector:
    matchNames:
    - prometheus
  selector:
    matchLabels:
      operated-prometheus: "true"

Pod Monitor

apiVersion: monitoring.coreos.com/v1
kind: PodMonitor
metadata:
  name: front-end
  labels:
    name: front-end
spec:
  namespaceSelector:
    matchNames:
      - sock-shop
  selector:
    matchLabels:
      name: front-end
  podMetricsEndpoints:
  - targetPort: 8079

As you can see, the definitions of the components are very similar and very intuitive, focusing on the selector to detect which pods or services we should monitor and some data regarding the specific target of the monitoring, so Prometheus knows how to scrape them.

If you want to take a look more in detail at any option you can configure on this CRD, I would recommend you to take a look at this URL which includes a detailed field to field documentation of the most common CRDs:

These components will belong to the definition of your workloads, which means that the creation and maintenance of these objects will be from the application’s developers.

That is great because several reasons:

  • It will include the Monitoring aspect of the component itself, so you will never forget the add the configuration from a specific component. That means it can be included in the duplicate YAML files or Helm Chart or a Kustomize resources as another needed resource.
  • It will de-centralize the monitoring configuration making it more agile, and it will progress as the software components do it.
  • It will reduce the impact on other monitored components as there is no need to act in any standard file or resource, so any different workloads will continue to work as expected.

Both objects are very similar in their purposes as both of them scrape all the endpoints that match the selector that we added. So, in which cases should I use one or the other?

The answer will be straightforward. By default, you will go with a ServiceMonitor because it will provide the metrics from the service itself and each of the endpoints that the service has, so each of the pods that are implementing the service will be discovered and scraped as part of this action.

So, in which cases should I use PodMonitor? Where the workload you are trying to monitor doesn’t act behind a service, so as there is no service defined, you cannot use ServiceMonitor. Do you want some examples of those? Let’s bring some!

  • Services that interact using other protocols that are not HTTP-based, such as Kafka, SQS/SNS, JMS, or similar ones.
  • Components such as CronJobs, DaemonSets, or non exposing any incoming connection model.

So I hope this article will help you understand the main difference between those objects and go a little deeper into how the new Prometheus Operator Framework resources work. We will continue covering other aspects in upcoming posts.

Scale To Zero And From Zero in Your Kubernetes Cluster

brown and beige weighing scale

Bringing the Serverless Experience To Your Kubernetes Cluster


Photo by Piret Ilver on Unsplash

Serverless always has been considered the next step in the cloud journey. You know what I mean: you start from your VM on-premises, then you move to have containers on a PaaS platform, and then you try to find your next stop in this journey that is serverless.

Technological evolution defined based on infrastructure abstraction perspective

Serverless is the idea of forgetting about infrastructure and focusing only on your apps. There is no need to worry about where it will run or the management of the underlying infrastructure. Serverless has started as a synonym of the Function as a Service (FaaS) paradigm. It has been populated first by the Amazon Lambda functions and later by all the major cloud providers.

It started as an alternative to the containerized approach that probably requires a lot of technical skills to manage and run at a production scale, but this is not the case anymore.

We have seen how the serverless approach has reached any platform despite this starting point. Following the same principles, we have different platforms that its focus is to abstract all technical aspects for the operational part and provide a platform where you can put your logic running. Pretty much every SaaS platform covers this approach but I would like to highlight some samples to clarify:

  • netlify is a platform that allows you to deploy your web application without needing to manage anything else that the code needed to run it.
  • TIBCO Cloud Integration is an iPaaS solution that provides all the technical resources you could need so you can focus on deploying your integration services.

But going beyond that, pretty much each service provided by the major cloud platform such as Azure, AWS, or GCP follows the same principle. Most of them (messaging, machine learning, storage, and so on) abstract all the infrastructure underlying it so you can focus on the real service.

Going back to the Kubernetes ecosystem we have two different layers of that approach. The main one is the managed Kubernetes services that all big platforms provide where all the management of the Kubernetes (master nodes, internal Kubernetes components) are transparent to you and you center everything on the workers. And the second level is what you can get in the AWS world with the EKS + Fargate kind of architecture where not even the worker nodes exist, you have your pods that will be deployed on a machine that belongs to your cluster but you don’t need to worry about it, or manage anything related to that.

So as we have seen serverless approach is coming to all areas but this is not the scope of this article. The idea here is to try to focus on the serverless as a synonym of Function as a Service and (FaaS) and How we can bring the FaaS experience to our productive K8S ecosystem. But let’s start with the initial questions:

Why would we like to do that?

This is the most exciting thing to ask: what are the benefits this approach provides? Function as a Service follows the zero-scale approach. That means that the function is not loaded if they are not being executed, and this is important, especially when you are responsible for your infrastructure or at least paying for it.

Imagine a normal microservices written in any technology, the amount of resources it can use depends on its load, but even without any load, you need some resources to keep it running; mainly, we are talking about memory that you need to stay in use. The actual amount will depend on the technology and the development itself, but it can be moved from some MB to some hundreds. If we consider all the microservices a significant enterprise can get, you will get a difference of several GB that you are paying for that are not providing any value.

But beyond the infrastructure management, this approach also plays very well with another of the latest architectural approaches, the Event-Driven Application (EDA), because we can have services that are asleep just waiting for the right event to wake them up and start processing.

So, in a nutshell, the serverless approach helps you get your optimized infrastructure dream and enable different patterns also in an efficient way. But what happens is I already own the infrastructure? It will be the same because you will run more services in the same infrastructure, so you will still get the optimized use of your current infrastructure.

What do we need to enable that?

The first thing that we need to know is that not all technologies or frameworks are suitable to run on this approach. That is because you need to meet some requirements to be able to do that as a successful approach, as shown below:

  • Quick Startup: If your logic is not loaded before a request hits the service, you will need to make sure the logic can load quickly to avoid impacting the consumer of the service. So that means that you will need a technology that can load in a small amount of time, usually talking in the microsecond range.
  • Stateless: As your logic is not going to be loaded in a continuous mode it is not suitable for stateful services.
  • Disposability: Similar to the previous point it should be ready for graceful shutdown in a robust way

How do we do that?

Several frameworks allow us to get all those benefits that we can incorporate into our Kubernetes ecosystem, such as the following ones:

  • KNative: This is the framework that the CNCF Foundation supports and is being included by default in many Kubernetes distributions such as Red Hat Openshift Platform.
  • OpenFaaS: This is a well-used framework created by Alex Ellis that supports the same idea.

It is true that there are other alternatives such as Apache OpenWhisk, Kubeless, or Fission but there less used in today’s world and mainly most alternative has been chosen between OpenFaaS and KNative but if you want to read more about other alternatives I will let you an article about the CNCF covering them so you can take a look for yourself:

Multi Container Pod: How, When, and Why

city with high rise buildings during night time

Let’s Talk About the Most Dangerous Option From Pod Design Perspective, so you can be ready to use it!


Photo by Timelab Pro on Unsplash

One of the usual conversations is about the composition and definition of components inside a Pod. This is normal for people moving from traditional deployment to a cloud-native environment, and the main question is: How many containers can I have inside a pod? 

I’m sure that most of you have heard or have asked that question at some point on your cloud-native journey, or even you have this doubt internally at this moment, and there is no doubt on the answer: One single container.

Wait, wait!! Don’t leave the post yet! We know that is not technically true, but it is easier to understand initially; you can only have a pod doing one thing.

So, if that’s the case, why do the multi container pods exist? And most importantly, if this is the first time you have heard that concept, what is a multi container pod?

Let’s start with the definition: A multi container pod has more than one container in its composition. And when we are talking about multi container, we are not talking about having some initContainers to manage the dependencies. Still, we are talking about having more than one container run simultaneously and at the same level, as you can see in the picture below:

Multi Container Pod Definition

Does Kubernetes support this model? Yes, for sure. You can define inside your containers section as many containers as you need. So, from a technical view, there is no limit to having as many containers as you need in the same pod. But the main question you should ask yourself is:

Is this what you want to do?

A pod is the smallest unit in Kubernetes as a reminder. You deploy and undeploy pods, stop and start pods, restart pods, scale pods. So anything that is inside the same pod is highly coupled. It’s like a bundle, and they also share resources. So it is even more critical.

Imagine this situation, I’d like to buy a notebook, so I go to the shop and ask for the notebook, but they don’t have a single notebook. Still, they have an incredible bundle: a notebook, a pen, and a stapler just for $2 more than a single notebook price.

So you think that this is an excellent price because you are getting a pen and a stapler for a small part of their price if you would like to buy it in isolation. So you think that’s a good idea. But then, you remind that you also need other notebooks for other purposes. In the end, you need ten more notebooks, but when you need to buy them, you also need to acknowledge the ten pens and ten staplers that you don’t need anymore. OK, there are cheaper, but in the end, you are paying a reasonable price for something that you don’t need. So, it is not efficient. And the same applies to the Pod structure definition.

In the end, you move from traditional monolith deployments to different containers inside a pod to have the same challenges and issues? What is the point of doing that?

None.

If there is no reason to have two containers tightly together, why is this allowed in the K8S specification? Because this is useful for some specific use-cases and scenarios. Let’s talk about some of them.

  • Helper Containers: This is the most common one and is that you have different containers inside the pod. Still, one is the main one, the one that provides a business capability or a feature, and the other is just helping in some way.
  • Sidecar Pattern Implementation: Another common approach to have this composition is implementing the sidecar pattern. This is how it works by deploying another container to perform a specific capability. You have seen it, for example, for Service Meshes, Log Aggregation Architecture, or other components that follow that pattern.
  • Monitoring Exporters: Another usual see to thing do is to use one of these containers to act as an exporter for the monitoring metrics of the main component. This is usually seen on architectures such as Prometheus, where each piece has its exporter to be scraped from the Prometheus Server

There are also exciting facts of sharing containers inside a pod because, as commented, they also share resources such as:

  • Volumes: You can, for example, define a shared folder for all the different containers inside a pod, so one container can read information for the other to perform its task quickly and efficiently.
  • Inter-process Communication: You can communicate between containers using IPC to communicate more efficiently.
  • Network: The different containers inside a pod can also access ports from other containers just reaching localhost.

I hope this article has helped you understand why this capability of having many containers inside the same pod exists, but at the same time to know which kind of scenarios are using this approach and having some reasoning about if a new use-case should be used this approach or not.

How To Troubleshoot Network Connections On Your Kubernetes Workloads

blue UTP cord

Discover Mizu: Traffic Viewer for Kubernetes to ease this challenge and improve your daily work.


Photo by Jordan Harrison on Unsplash

One of the most common things we have to do when testing and debugging our cloud-native workloads on Kubernetes is to check the network communication.

It could be to check the incoming traffic you are getting so we can inspect the requests we are receiving and see what we are replying to and similar kinds of use-cases. I am sure this sounds familiar to most of you.

I usually solve that using tcpdump on the container, similar to what I would do in a traditional environment, but this is not always easy. Depending on the environment and configuration, you cannot do so because you need to include a new package in your container image, do a new deployment, so it is available, etc.

So, to solve that and other similar problems, I discovered a tool named Mizu, which I would like to have found a few months ago because it would help me a lot. Mizu is precisely that. In its own words:

Mizu is a simple-yet-powerful API traffic viewer for Kubernetes, enabling you to view all API communication between microservices across multiple protocols to help you debug and troubleshoot regressions.

To install, it is pretty straightforward. You need to grab the binary and provide the correct permission on your computer. You have a different binary for each architecture, and in my case (Mac Intel-based), these are the commands that I executed:

curl -Lo mizu github.com/up9inc/mizu/releases/latest/download/mizu_darwin_amd64 && chmod 755 mizu && mv mizu /usr/local/bin

And that’s it, then you have a binary in your laptop that connects to your Kubernetes cluster using Kubernetes API, so you need to have configured the proper context.

In my case, I have deployed a simple nginx server using the command:

 kubectl run simple-app --image=nginx --port 80

And once that the component has been deployed, as it is shown in the Lens screenshot below:

I ran the command to launch mizu from my laptop:

mizu tap

And after a few seconds, I have in front of me a webpage opened monitoring all traffic happening in this pod:

I have made the nginx port expose using the kubectl expose command:

 kubectl expose pod/simple-app

And after that, I deployed a temporary pod using the curl image to start sending some requests with the command shown below:

 kubectl run -it --rm --image=curlimages/curl curly -- sh

now I’ve started to send some requests to my nginx pod using curl:

 curl -vvv http://simple-app:80 

And after a few calls, I could see a lot of information in front of me. First of all, I can see the requests I was sending with all the details of it:

But even more important, I can see a service map diagram showing the dependencies and the calls graphically happening to the pod with the response time and also the protocol usage:

This will not certainly replace a complete observability solution on top of a service mesh. Still, it will be a beneficial tool to add to your toolchain when you need to debug a specific communication between components or similar kinds of scenarios. As commented, it is like a high-level tcpdump for pod communication.

Why You Shouldn’t Add a Resource Quota Using The Limit Value?

woman in blue denim jacket holding white paper

If You Aren’t Careful You Can Block The Scalability Of Your Workloads


Photo by Joshua Hoehne on Unsplash

One of the great things about container-based developments idefiningne isolation spaces where you have guaranteed resources such as CPU and memory. This is also extended on Kubernetes-based environments at the namespace level, so you can have different virtual environments that cannot exceed the usage of resources at a specified level.

To define that you have the concept of Resource Quota that works at the namespace level. Based on its own definition (https://kubernetes.io/docs/concepts/policy/resource-quotas/)

A resource quota, defined by a ResourceQuota object, provides constraints that limit aggregate resource consumption per namespace. It can limit the quantity of objects that can be created in a namespace by type, as well as the total amount of compute resources that may be consumed by resources in that namespace.

You have several options to define the usage of these Resource Quotas but we will focus on this article on the main ones as follows:

  • limits.cpu: Across all pods in a non-terminal state, the sum of CPU limits cannot exceed this value.
  • limits.memory: Across all pods in a non-terminal state, the sum of memory limits cannot exceed this value.
  • requests.cpu: Across all pods in a non-terminal state, the sum of CPU requests cannot exceed this value.
  • requests.memory: Across all pods in a non-terminal state, the sum of memory requests cannot exceed this value.

So you can think that this is a great option to define a limit.cpu and limit.memory quota, so you make sure that you will not extend that amount of usage by any means. But you need to be careful about what this means, and to illustrate that I will use a sample.

I have a single workload with a single pod with the following resource limitation:

  • requests.cpu: 500m
    • limits.cpu: 1
    • requests.memory: 500Mi
    • limits.memory: 1 GB

Your application is a Java-based application that exposes a REST Service ant has configured a Horizontal Pod Autoscaler rule to scale when the amount of CPU exceeds its 50%.

So, we start in the primary situation: with a single instance that requires to run 150 m of vCPU and 200 RAM, so a little bit less than 50% to avoid the autoscaler. But we have a Resource Quota about the limits of the pod (1 vCPU and 1 GB) so we have blocked that. We have more requests and we need to scale to two instances. To simplify the calculations, we will assume that we will use the same amount of resources for each of the instances, and we will continue that way until we reach 8 instances. So lets’ see how it changes the limits defined (the one that will limit the number of objects I can create in my namespace) and the actual amount of resources that I am using:

So, for resources used amount of 1.6 vCPU I have blocked 8 vCPU, and in case that was my Resource Limit, I cannot create more instances, even though I have 6.4 vCPU not used that I have allowed deploying because of this kind of limitation I cannot do it.

Yes, I am able to ensure the principle that I never will use more than 8 vCPU, but I’ve been blocked very early on that trend affecting the behavior and scalability of my workloads.

Because of that, you need to be very careful when you are defining these kinds of limits and making sure what you are trying to achieve because to solve one problem you can be generating another one.

I hope this can help you to prevent this issue for happening in your daily work or at least to keep it in mind when you are facing similar scenarios.