Create Secrets in Hashicorp Vault Using 2 Easy Ways

Introduction

Create secrets in Hashicorp Vault is one of the most important and relevant things you can do once you have installed Hashicorp Vault on your environment, probably by recovering and getting these secrets from the components they need it. But in today’s article, we will focus on the first part so you can learn how easily you can create secrets in Hashicorp Vault.

In previous articles we commented on the importance of Hashicorp Vault and the installation process, as you can read here. Hence, at this point, we already have our vault ready to start working with it wholly initialized and unseal to be able to start serving requests.

Create Secrets in Hashicorp Vault using Hashicorp Vault CLI Commands

All the commands we will do will use a critical component named Hashicorp Vault CLI, and you will notice that because all of our commands will start with vault. To be honest, we already started with that in the previous article; if you remember, we already run some of these commands to initialize or unseal the vault, but now this will be our main component to interact with.

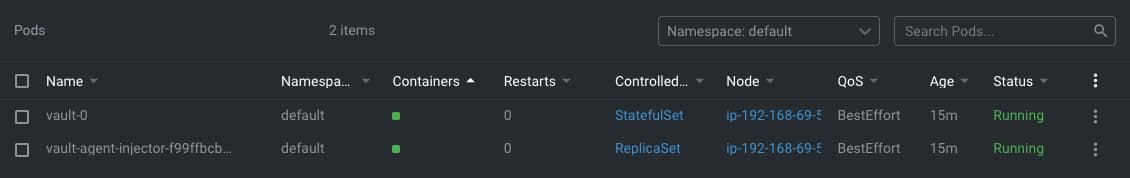
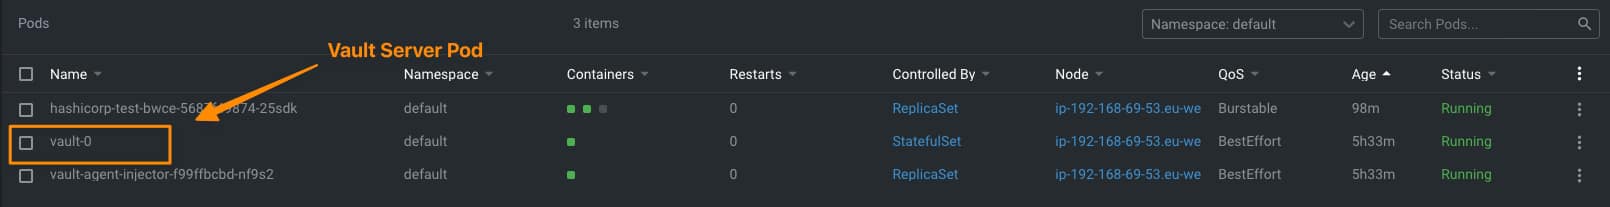
The first thing we need to do is to be able to log into the vault, and to do that; we are going to use the root token that was provided to us when we initialized the vault; we are going to store this vault in an environment variable so it will be easy to work with it. All the commands we are going to run now are going to be inside the vault agent server pod, as shown in the picture below:

Create Secrets in Hashicorp Vault: Detecting Vault Server Pod

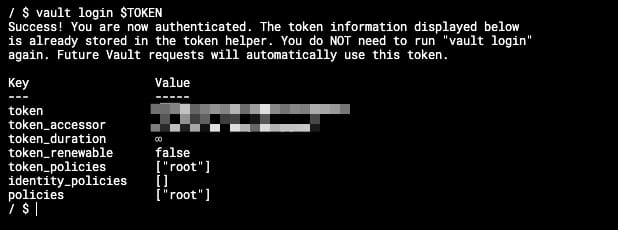
Once we are inside of it, we are going to do the log command with the following syntax:

 vault login 

And we will get an output similar to this one:

Create Secrets in Hashicorp Vault: Login in Hashicorp Vault

If we do not provide the token in advance, the console will ask for the token to be typed afterward, and it will be automatically hidden, as you can see in the picture below:

Create Secrets in Hashicorp Vault: Login without Token provided

After this point, we are already logged into the vault, so we can start typing commands to create secrets in Hashicorp Vault. Let’s start with that process.

To start with our process for creating secrets in Hashicorp Vault, we first need to make or be more accurate to the Hashicorp Vault syntax to enable a secret path that you can think about as the root path to which all your secrets will be related to. If we are talking about having secrets for different applications, each path can be each of the applications, but the organization of secrets can be other depending on the context. We will cover that in much more detail in the following articles.

To enable the secret path to start the creation of secrets in Hashicorp Vault, we will type the following command:

 vault secrets enable -path=internal kv-v2

That will enable a secret store of the type kv-v2 (key-value store in its v2), and the path will be “internal,” so everything else that we create after that will be under this “internal” root path.

And now, we’re going to do the creation of the secret in Hashicorp Vault, and as we are using a key-value store, the syntax is also related to that because we are going to “put” a secret using the following command:

 vault kv put internal/database/config username="db-readonly-username" password="db-secret-password"

That will create inside the internal path a child path /database/config where it will store two keys:

  • username that will have the value db-readonly-username
  • password that will have the value db-secret-password

As you can see, it is quite easy to create new secrets on the Vault linked to the path, and if you want to retrieve its content, you can also do it using the Vault CLI, but this time using the get command as shown in the snippet below:

 vault kv get internal/database/config

And the output will be similar to the one shown below:

Create Secrets in Hashicorp Vault: Retrieving Secrets from the Vault

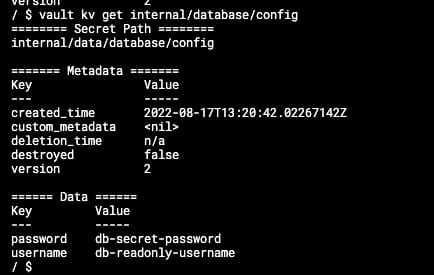
This will help you interact with your store’s content to retrieve, add or update what you already have there. Once you have everything ready there, we can move to the client side to configure it to gather all this data as part of its lifecycle workflow.

Create Secrets in Hashicorp Vault using REST API

The Hashicorp Vault CLI simplifies the interaction with the vault server, but all the interaction between the CLI and the server happens through a REST API that the server exposes and the CLI client consumes. It provides a simplified syntax to the user and translates the parameters provided into REST requests to the server, but you can use also REST requests to go to the server directly. Please look at this article in the official documentation to get more details about the REST API.

Best Apple iPhone Chargers in 2022 for Less than 50$

Introduction

In this article, I would like to discuss the Best iPhone Chargers for Remote Work (or not). Because different reasons, among them, is my love to test any gadgets that can help improve my productivity when I am working or just because they do fun or have the excellent capability. I have been trying a lot of chargers, and today I would like to share the outcomes of several years of research and try to give you what, to me, are the best iPhone Chargers that I have been using and that I’m still using today.

My Devices

Before that, I would like to share the devices I own at this moment because that would give a better sense of the kind of chargers I am going to recommend. Currently, I have the following items on my hands:

My Requirements

So, that would give you pretty much the kind of chargers I am going to prioritize components that meet the following requirement:

  • Multidevice: Even though not all the chargers that I have are multidevice, it is essential that the same charger can charge several components at the same time or at least be valid for several of them
  • Easy to Transport: As remote work is a new release, all the iOS chargers must be easy to pack and slim enough to be able to be a required item always to your backpack to work anywhere and everywhere
  • Quality/Price ratio: Even though the quality is essential also, it is price, and I don’t support that a charger can cost you more than the device that it needs to charge, so that will be another factor to take into consideration

Best iPhone Charger for Travel: New 3 In1 Dual Magnetic Wireless Charger For iPhone 13 12 Pro Max Mini Charger 15W Fast Charging For AirPods Apple Watch 7 6 5 4

Best iPhone Chargers for Remote Work

This is, to me, the best iOS Charger for Travel. It allows us in a very portable way to support the charge of up to three components: iPhone, Apple Watch, and Air Pods, using a Magnetic Wireless approach that makes it even easier to charge. First, let me explain how this item is designed:

It has two charger parts that you can fold in one for easy portability. The first charger part, the bigger one, is for the iPhone. The second one is split into two smaller parts designed to host the Airpods (any wireless charger AirPods) and a specific place for the Apple Watch that you need to move to be able to charge the Apple Watch in a way that is also visible the hour while it is charging. It has 15W of transmit power through a USB-C charger port which makes the charger quite fast for a charger of this capabilities.

What I like the most about this item is its portability because you can fold the charger in a small way, and it can be the best iOS charger to always be on your backpack when taking your iOS devices with you.

Best iPhone Charger for Home: Qi 3 en 1 for IPhone 13, 12, 11, XR, 8, Apple Watch, Airpods Pro, IWatch 7, 6, 20W

Best iOS Chargers for Home

This is a very similar charger to the one commented below; it is the one I used at home so to me is the best iPhone Charger. Because it covers all the things I need, it is too critical that I don’t have just one but two of these chargers in my house: One in my studio and the other in my bedroom, depending on where I need to have my devices.

This charger is also a multidevice charger with three different device regions. The big one in the front of the charger has the phone, so you can see the entire screen of your device in case any notification arrives or even use your phone very quickly. Then you have two charger regions on the back, one on the top and the other on the bottom. The one on the top is for the Apple Watch, which has a lovely place, and then on the bottom is a place for the AirPods to charge simultaneously.

This is great to be in the office because I have it just below the screen that I use all the time, so I can quickly grab it to handle a phone call or manage any notification and then leave it there, and it will always be charged when you need it, and the same applies to the other devices.

So it is not just a charger but a location point, and that’s why I have two of them because in the bedroom is where I put all my devices at night before going to be, so all the devices are going to be charged during the night and always located in the same place so you will ever find them.

You can buy it from Amazon or AliExpress with prices from $25 – $40

Summary

All this information about my devices, my requirements, and why I think these are the best iPhone chargers you could find are helpful to you and maybe will help you upgrade your setup a little bit and improve your work (or personal) workflow! If you want more ideas check them here!

Hashicorp Vault Installation on Kubernetes: Quick and Simple in 3 Easy Steps

Introduction

In this article, we are going to cover the Hashicorp Vault Installation on Kubernetes. Hashicorp Vault has become one of the industry standards when we talk about managing secrets and sensitive data in production environments, and this covers cloud and non-cloud-native deployments. But especially in Kubernetes, this is a critical component. We have already commented that the Kubernetes Secrets are not very secured by default, so HashiCorp Vault solves that problem.

Installation Methods

Hashicorp Vault provides many different installation methods that you can read about on their official page here; most still focus on a traditional environment. But in summary, these are the ones you have available:

  • Install from Package Manager
  • Install from pre-existing binary
  • Install it from the source
  • Helm for Kubernetes

As you can imagine, the path we will follow here is the Helm way. I guess you are already familiar with help, but if not, take a look here, and if you are also in the process of creating helm charts, this other one can also help you.

Helm Chart for Hashicorp Vault

For the sake of this article, we are going to what is called a standalone hashicorp vault installation, so we are not going to create in this post an architecture with High-Availability (HA) that is production-ready but something that can help you to start playing with the tool and see how this tool can be integrated with other ones that belong to the same cloud-native environment. To get more information about deploying Hashicorp Vault into a production-ready setup, please look at the following link.

We first need to install the helm chart in our local environment, but we need to be very careful about the helm version we have. When writing this article, Hashicorp Vault Installation requires a 3.7+ Helm Version, so you must first check the version you have installed.

In case you’re running on an older version, you will get the following error:

 Error: parse error at (vault/templates/_helpers.tpl:38): unclosed action

You can get more details on this GitHub issue.

At the time of writing this article, the latest version of Helm is 3.9, but this version generates an issue with AWS EKS with this error:

 Error: Kubernetes cluster unreachable: exec plugin: invalid apiVersion "client.authentication.k8s.io/v1alpha1."
Failed installing **** with helm

You can get more details on this GitHub issue.

So, in that case, the best way to ensure there will not be a problem with the Hashicorp Vault Installation is to downgrade to 3.8, and you will be able to deploy the helm chart without any issue.

Hashicorp Vault Installation Process

To proceed with the Hashicorp Vault Installation, we need to run the following commands:

helm repo add hashicorp https://helm.releases.hashicorp.com
helm install vault hashicorp/vault

This will install two different components a single vault server as part of a StatefulSet and a vault-agent-injector to manage the injection of vault configuration on the various components and deployments on the other namespaces.

To get the pods running, we need to initialize and unseal the vault before being ready to use. To do that, we need to enter inside the vault-server pod and execute the following commands:

 vault operator init

This will generate several essential things:

  • It will generate the keys to be able to unseal the vault to be able to start using it. It will prompt a different number of keys, in our sample 5, and you will need at least 3 of them to be able to unseal the vault as
  • It will also generate a root token to be able to log into the CLI and interactor with the server to be able to read and write secrets

After that, we will need to run the following command at least three times, providing each of them with a different unseal key:

 Vault operator unseal

After that point, all components are Running and Ready and we can conclude our Hashicorp Vault Installation and start interacting with the vault to create your secrets.

Hashicorp Vault Installation: All Components Ready

Helm Loops: Helm Hack #1

Introduction

Discover how to add Helm Loops to your helm charts to provide more dynamic behavior to your Helm Charts.

Helm Charts are becoming the default de-factor solution when you want to package your Kubernetes deployment to be able to distribute or quickly install it in your system.

Defined several times as the apt for Kubernetes for its similarity with the ancient package manager from GNU/Linux Debian-like distributions, it seems to continue to grow in popularity each month compared with other similar solutions even more tightly integrated into Kubernetes such as Kustomize, as you can see in the Google Trends picture below:

Helm Loops: Helm Charts vs Kustomize

But creating these helm charts is not as easy as it shows. If you already have been on the work of doing so, you probably get stuck at some point, or you spend a lot of time trying to do some things. If this is the first time you are creating one or trying to do something advanced, I hope all these tricks will help you on your journey. Today we are going to cover one of the most important tricks, and those are Helm Loops.

Helm Loops Introduction

If you see any helm chart for sure, you will have a lot of conditional blocks. Pretty much everything is covered under an if/else structure based on the values.yml files you are creating. But this gets a little bit tricky when we talk about loops. But the great thing is that you will have the option to execute a helm loop inside your helm charts using the rangeprimitive.

How to create a Helm Loop?

The usage of the rangeprimitive is quite simple, as you only need to specify the element you want to iterate across, as shown in the snippet below:

{{- range .Values.pizzaToppings }}
- {{ . | title | quote }}
{{- end }}    

This is a pretty simple sample where the yaml will iterate over the values that you have assigned to the pizzaToppings structure in your values.yml

There are some concepts to keep in mind in this situation:

  • You can easily access everything inside this structure you are looping across. So, if pizza topping has additional fields, you can access them with something similar to this:
{{- range.Values.pizzaToppings }}
- {{ .ingredient.name | title | quote }}
{{- end }}    

And this will access a structure similar to this one in your values.yml:

 pizzaToppings:
	- ingredient:
		name: Pinneaple
		weight: 3

The good thing is that you can access their underlying attribute without replicating all the parent hierarchy until you reach the looping structure because inside the range section, the scope has changed. We will refer to the root of each element we are iterating across.

How to access parent elements inside a Helm Loop?

In the previous section, we covered how easily we can access the inner attribute inside the loop structure because of the change of scope, which also has an issue. In case I want to access some element in the parent of my values.yml file or somewhere outside the structure, how can I access them?

The good thing is that we also have a great answer to that, but you can get there. We need to understand a little bit about the scopes in Helm.

As commented, . refers to the root element in the current scope. If you have never defined a range section or another primitive that switches the context, .always will refer to the root of your values.yml. That is why when you see a helm chart, you see all the structures with the following way of working: .Values.x.y.z, but we already have seen that when we have a range section, this is changing, so this is not a good way.

To solve that, we have the context $ that constantly refers to the root of the values. ymlno matter which one is the current scope. So that means that if I have the following values.yml:

base:
	- type: slim 
pizzaToppings:
	- ingredient:
		name: Pinneaple
		weight: 3
	- ingredient:
		name: Apple
		weight: 3

And I want to refer to the base type inside the range section similar to before I can do it using the following snippet:

{{- range .Values.pizzaToppings }}
- {{ .ingredient.name | title | quote }} {{ $.Values.base.type }}
{{- end }}    

That will generate the following output:

 - Pinneaple slim
 - Apple slim

So I hope this helm chart trick will help you with the creation, modification, or improvement of your upgraded helm charts in the future by using helm loops without any further concern!

BanzaiCloud Logging Operator in Kubernetes Simplified in 5 minutes.

How to Configure BanzaiCloud Logging Operator in Kubernetes In Less Than 5 minutes
How to Configure BanzaiCloud Logging Operator in Kubernetes In Less Than 5 minutes (Photo by Markus Spiske on Unsplash)

In the previous article, we described what capability BanzaiCloud Logging Operator provides and its main features. So, today we are going to see how we can implement it.

The first thing we need to do is to install the operator itself, and to do that, we have a helm chart at our disposal, so the only thing that we will need to do are the following commands:

 helm repo add banzaicloud-stable https://kubernetes-charts.banzaicloud.com
helm upgrade --install --wait --create-namespace --namespace logging logging-operator banzaicloud-stable/logging-operator

That will create a logging namespace (in case you didn’t have it yet), and it will deploy the operator components itself, as you can see in the picture below:

BanzaiCloud Logging Operator installed using HelmChart

So, now we can start creating the resources we need using the CRD that we commented on in the previous article but to do a recap. These are the ones that we have at our disposal:

  • logging – The logging resource defines the logging infrastructure for your cluster that collects and transports your log messages. It also contains configurations for Fluentd and Fluent-bit.
  • output / clusteroutput – Defines an Output for a logging flow, where the log messages are sent. output will be namespaced based, and clusteroutput will be cluster based.
  • flow / clusterflow – Defines a logging flow using filters and outputs. The flow routes the selected log messages to the specified outputs. flow will be namespaced based, and clusterflows will be cluster based.

So, first of all, we are going to define our scenario. I don’t want to make something complex; I wish that all the logs that my workloads generate, no matter what namespace they are in, are sent to a Grafana Loki instance that I have also installed on that Kubernetes Cluster on a specific endpoint using the Simple Scalable configuration for Grafana Loki.

So, let’s start with the components that we need. First, we need a Logging object to define my Logging infrastructure, and I will create it with the following command.

kubectl -n logging apply -f - <<"EOF"
apiVersion: logging.banzaicloud.io/v1beta1
kind: Logging
metadata:
  name: default-logging-simple
spec:
  fluentd: {}
  fluentbit: {}
  controlNamespace: logging
EOF

We will keep the default configuration for fluentd and fluent-bit just for the sake of the sample, and later on in upcoming articles, we can talk about a specific design, but that’s it.

Once the CRD is processed, the components will appear on your logging namespace. In my case that I’m using a 3-node cluster, I will see 3 instances for fluent-bit deployed as a DaemonSet and a single example of fluentd, as you can see in the picture below:

BanzaiCloud Logging Operator configuration after applying Logging CRD

So, now we need to define the communication with Loki, and as I would like to use this for any namespace I can have on my cluster, I will use the ClusterOutput option instead of the normal Output one that is namespaced based. And to do that, we will use the following command (please ensure that the endpoint is the right one; in our case, this is loki-gateway. default as it is running inside the Kubernetes Cluster:

kubectl -n logging apply -f - <<"EOF"
apiVersion: logging.banzaicloud.io/v1beta1
kind: ClusterOutput
metadata:
 name: loki-output
spec:
 loki:
   url: http://loki-gateway.default
   configure_kubernetes_labels: true
   buffer:
     timekey: 1m
     timekey_wait: 30s
     timekey_use_utc: true
EOF

And pretty much we have everything; we just need one flow to communicate our Logging configuration to the ClusterOutput we just created. And again, we will go with the ClusterFlow because we would like to define this at the Cluster level and not in a by-namespaced fashion. So we will use the following command:

 kubectl -n logging  apply -f - <<"EOF"
apiVersion: logging.banzaicloud.io/v1beta1
kind: ClusterFlow
metadata:
  name: loki-flow
spec:
  filters:
    - tag_normaliser: {}
  match:
    - select: {}
  globalOutputRefs:
    - loki-output
EOF

And after some time to do the reload of the configuration (1-2 minutes or so), you will start to see in the Loki traces something like this:

Grafana showing the logs submitted by the BanzaiCloud Logging Operator

And that indicates that we are already receiving push of logs from the different components, mainly the fluentd element we configured in this case. But I think it is better to see it graphically with Grafana:

Grafana showing the logs submitted by the BanzaiCloud Logging Operator

And that’s it! And to change our logging configuration is as simple as changing the CRD component we defined, applying matches and filters, or sending it to a new place. Straightforwardly we have this completely managed.

Empower Log Aggregation in Kubernetes with BanzaiCloud Logging Operator

Empower Log Aggregation in Kubernetes with BanzaiCloud Logging Operator
Empower Log Aggregation in Kubernetes with BanzaiCloud Logging Operator (Photo by Markus Spiske on Unsplash)

We already have talked about the importance of Log Aggregation in Kubernetes and why the change in the behavior of the components makes it a mandatory requirement for any new architecture we deployed today.

To solve that part, we have a lot of different stacks that you probably have heard about. For example, if we follow the traditional Elasticsearch path, we will have the pure ELK stack from Elasticsearch, Logstash, and Kibana. Now this stack has been extended with the different “Beats” (FileBeat, NetworkBeat, …) that provides a light log forwarder to be added to the task.

Also, you can change Logstash for a CNCF component such as Fluentd that probably you have heard about, and in that case, we’re talking about an EFK stack following the same principle. And also, have the Grafana Labs view using promtail, Grafana Loki, and Grafana for dashboarding following a different perspective.

Then you can switch and change any component for the one of your preference, but in the end, you will have three different kinds of components:

  • Forwarder: Component that will listen to all the log inputs, mainly the stdout/stderr output from your containers, and push it to a central component.
  • Aggregator: Component that will receive all the traces for the forwarded, and it will have some rules to filter some of the events, format, and enrich the ones received before sending it to central storage.
  • Storage: Component that will receive the final traces to be stored and retrieved for the different clients.

To simplify the management of that in Kubernetes, we have a great Kubernetes Operator named BanzaiCloud Logging Operator that tries to follow that approach in a declarative / policy manner. So let’s see how it works, and to explain it better, I will use its central diagram from its website:

BanzaiCloud Logging Operator Architecture

This operator uses the same technologies we were talking about. It covers mainly the two first steps: Forwarding and Aggregation and the configuration to be sent to a Central Storage of your choice. To do that works with the following technologies, all of them part of the CNCF Landscape:

  • Fluent-bit will act as a forwarded deployed on a DaemonSet mode to collect all the logs you have configured.
  • Fluentd will act as an aggregator defining the flows and rules of your choice to adapt the trace flow you are receiving and sending to the output of your choice.

And as this is a Kubernetes Operator, this works in a declarative way. We will define a set of objects that will define our logging policies. We have the following components:

  • logging – The logging resource defines the logging infrastructure for your cluster that collects and transports your log messages. It also contains configurations for Fluentd and Fluent-bit.
  • output / clusteroutput – Defines an Output for a logging flow, where the log messages are sent. output will be namespaced based, and clusteroutput will be cluster based.
  • flow / clusterflow – Defines a logging flow using filters and outputs. The flow routes the selected log messages to the specified outputs. flow will be namespaced based, and clusterflows will be cluster based.

In the picture below, you will see how these objects are “interacting” to define your desired logging architecture:

BanzaiCloud Logging Operator CRD Relationship

And apart from the policy mode, it also includes a lot of great features such as:

  • Namespace isolation
  • Native Kubernetes label selectors
  • Secure communication (TLS)
  • Configuration validation
  • Multiple flow support (multiply logs for different transformations)
  • Multiple output support (store the same logs in multiple storages: S3, GCS, ES, Loki, and more…)
  • Multiple logging system support (multiple Fluentd, Fluent Bit deployment on the same cluster)

In upcoming articles we were talking about how we can implement this so you can see all the benefits that this CRD-based, policy-based approach can provide to your architecture.

Grafana Loki and MinIO: A Perfect Match!

Grafana Loki and MinIO: A Perfect Match!

Grafana Loki is becoming one of the de-facto standards for log aggregation in Kubernetes workloads nowadays, and today, we are going to show how we can use together Grafana Loki and MinIO. We already have covered on several occasions the capabilities of Grafana Loki that have emerged as the main alternative to the Elasticsearch leadership in the last 5-10 years for log aggregation.

With a different approach, more lightweight, more cloud-native, more focus on the good things that Prometheus has provided but for logs and with the sponsorship of a great company such as Grafana Labs with the dashboard tools as the leader of each day more enormous stack of tools around the observability world.

And also, we already have covered MinIO as an object store that can be deployed anywhere. It’s like having your S3 service on whatever cloud you like or on-prem. So today, we are going to see how both can work together.

Grafana Loki mainly supports three deployment models: monolith, simple-scalable, and distributed. Pretty much everything but monolith has the requirement to have an Object Storage solution to be able to work on a distributed scalable mode. So, if you have your deployment in AWS, you already have covered with S3. Also, Grafana Loki supports most of the Object Storage solutions for the cloud ecosystem of the leading vendors. Still, the problem comes when you would like to rely on Grafana Loki for a private cloud or on-premises installation.

In that case, is where we can rely on MinIO. To be honest, you can use MinIO also in the cloud world to have a more flexible and transparent solution and avoid any lock-in with a cloud vendor. Still, for on-premises, its uses have become mandatory. One of the great features of MinIO is that it implements the S3 API, so pretty much anything that supports S3 will work with MinIO.

In this case, I just need to adapt some values on the helm chart from Loki in the simple-distributed mode as shown below:

 loki:
  storage:
    s3:
      s3: null
      endpoint: http://minio.minio:9000
      region: null
      secretAccessKey: XXXXXXXXXXX
      accessKeyId: XXXXXXXXXX
      s3ForcePathStyle: true
      insecure: true

We’re just pointing to the endpoint from our MinIO tenant, in our case, also deployed on Kubernetes on port 9000. We’re also providing the credentials to connect and finally just showing that needs s3ForcePathSyle: true is required for the endpoint to be transformed to minio.minio:9000/bucket instead to bucket.minio.minio:9000, so it will work better on a Kubernetes ecosystem.

And that’s pretty much it; as soon as you start it, you will begin to see that the buckets are starting to be populated as they will do in case you were using S3, as you can see in the picture below:

MinIO showing buckets and objects from Loki configuration

We already covered the deployment models from MinIO. As shown here, you can use its helm chart or the MinIO operator. But, the integration with Loki it’s even better because the helm charts from Loki already included MinIO as a sub-chart so you can deploy MinIO as part of your Loki deployment based on the configuration you will find on the values.yml as shown below:

 # -------------------------------------
# Configuration for `minio` child chart
# -------------------------------------
minio:
  enabled: false
  accessKey: enterprise-logs
  secretKey: supersecret
  buckets:
    - name: chunks
      policy: none
      purge: false
    - name: ruler
      policy: none
      purge: false
    - name: admin
      policy: none
      purge: false
  persistence:
    size: 5Gi
  resources:
    requests:
      cpu: 100m
      memory: 128Mi

So with a single command, you can have both platforms deployed and configured automatically! I hope this is as useful for you as it was for me when I discovered and did this process.

Learn How to Write Kubernetes YAML Manifest more Efficiently

Learn How to Write Kubernetes YAML Manifest more Efficiently
Learn How to Write Kubernetes YAML Manifest more Efficiently (Photo by Stillness InMotion on Unsplash)

When we are all in this new cloud-native environment where Kubernetes is the uncontestable king, you need to learn how to deal with Kubernetes YAML manifest all the time. You will become an expert on indent sections to make sure this can be processed and so on. But we need to admit that it is tedious. All the benefits from the Kubernetes deployment make an effort worth it, but even with that, it is pretty complex to be able to handle it.

It is true that, to simplify this situation, there are a lot of projects that have been launched, such as Helm to manage templates of related Kubernetes YAML manifest or Kustomize different approaches to get to the sample place or even solutions that are specific to a Kubernetes distribution such as the Openshift Templates. But in the end, none of this can solve the problem at the primary level. So you need to write those files manually yourself.

And what is the process now? You are probably following a different one, but I will tell you my approach. Depending on what I’m trying to create, I try to find a template available for the Kubernetes YAML Manifest that I want to make. This template can be some previous resource that I have already created. Hence, I use that as a base, it could be something generated for some workload that is already deployed (so great that Lens has existed to simplify the management of Running Kubernetes workloads! If you don’t know Lens, please take a look at this article) or if you don’t have anything at hand, you search on google about something similar probably in the Kubernetes documentation, stack overflow or the first reasonable resource that Google provides to you.

And after that, the approach is the same. You go to your Text Editor, VS Code in my case. I have a lot of different plugins to make this process less painful. A lot of different linters validate the structure of the Kubernetes YAML Manifest to make sure everything is indented property, that there are no repeated tags or no missing mandatory tags in the latest version of the resource, and so on.

Things got a bit tricky if you are creating a Helm Chart because in that case the linters for YAML don’t work that well and detect some false positives because they don’t truly understand the Helm syntax. You also complete your setup with a few more linters for Helm, and that’s it. You fight error and error and change by change to have your desired Kubernetes YAML Manifest.

But, it should be a better way to do that? Yes, it should, and this is what tools such as Monokle try to provide a better experience of that process. Let’s see how that works. Starting from their contributor words:

Monokle is your friendly desktop UI for managing Kubernetes manifests. Monokle helps you quickly get a high-level view of your manifests and their contained resources, easily edit resources without having to learn yaml syntax, diff resources against your cluster, preview and debug resources generated with kustomize or Helm, and more.

Monokle helps you in the following ways. First of all, present at the beginning of your work with a set of templates to create your Kubernetes YAML Manifests, as you can see in the picture below:

Monokle Template Selection Dialog

When you select a template, you can populate the required values graphically without needing to type YAML code yourself, as you can see in the picture below:

Monokle Template Value Population Process

It also supports Helm Chart and Kustomize resource recognition so you will quickly see your charts, and you can edit them in a more fashion mode even graphically for some of the resources as well:

Helm Chart Modification using Monokle

If allows good integration in several ways, first of all with OPA so it can validate all the rules and best-practice that you have defined and also you can connect to a running cluster to see the resources from there and also see the difference between them if exists to simplify the process and provide more agility on the Kubernetes YAML Manifest creation process

On top of all of that, Monokle is a certified component from the CNCF foundation, so you will be using a project that is backup from the same foundation is that takes care of Kubernetes itself, among other tasks:

Monokle is part of the CNCF Foundation Landscape

If you want to download Monokle, give it a try and you can do it from its web page: https://monokle.kubeshop.io/ and I’m sure your performance writing Kubernetes YAML Manifest will thank you shortly!

TIBCO BW Modules: 3 Things You Need to Know To Succeed

TIBCO BW Modules are one of the most relevant contents on your TIBCO BW developments. Learn all the details about the different TIBCO BW Modules available and when to use each of them.

TIBCO BW Modules

TIBCO BW has evolved in several ways and adapter to the latest changes of architecture. Because of that, since the conception of the latest major version, it has introduced several concepts that is important to master to be able to unleash all the power that this remarkable tool provides to you. Today we are going to talk about the Modules.

Every TIBCO BW application is composed of different modules that are the components that host all the logic that you can create, and that’s the first thing to write down: All your code and everything you do in your application will belong to one TIBCO BW Module.

If we think about the normal hierarchy of TIBCO BW components it will be something like that picture below:

At the top level, we will have the Application; at the second level, we will have the modules, and after that, we will have the packages and finally, the technical components such as Process, Resources, Classes, Schemas, Interfaces, and so on. Learn more about this here.

TIBCO BW Module Classification

There are several kind of module and each of them provides a specific use-case and has some characteristics associated with it.

  • Application Module: It is the most important kind of module because without each you cannot have an application. It is the master module and only can be one per application. It is where all your main logic to that application will reside.
  • Shared Module: It is the other only BW native module and it is main purpose as the name shows it is to host all the code and components that can be shared between several applications. If you have experience with previous versions of TIBCO BW you can think on this TIBCO BW Module as a replacement of a Design Time Library (a.k.a DTL) or if you have experience with a programming language a library that is imported to the code. Because of that it doesn’t have a restriction on the number of applications that can use a share module and there is no limitation on the number of share modules that a TIBCO BW Application can have.
  • OSGI Module: This module is the one that is not BW native and it is not going to be include BW objects such as Processes, Resources and so on, and there are mainly concieved to have Java classes. And again it is more like a helper module that also can be shared as needed. Usual scenarios for use this kind of module is to define Custom XPath Functions for example or to have Java Code shared between several applications.

Both Shared Modules and OSGI Modules can be defined as Maven dependencies and use the Maven process to publish them in a Maven repository and also to be retrieved from it based on the declaration.

That provides a very efficient way for distribution and version control of these shared components and, at the same, offers a similar process for other programming languages such as Java so that it will decrease the learning curve for that process.

TIBCO BW Module Limitations

As we already commented, there are some limitations or special characteristics that each module has. We should be very aware of it to help us properly distribute our code using the right kind of modules.

As commented, one application can have only one TIBCO BW Application Module. Even though it is technically possible to have the same BW Application Module in more than one application, that has no sense because both applications will be the same as its main code will be the same.

TIBCO BW Shared Modules at other hand, cannot have Starter components or Activator process as part of its declaration and all of them should reside on the TIBCO BW Application Module

Both TIBCO BW Application Module and TIBCO BW Shared Module can have Java code, but on the other way, the OSGI module can only have Java code and no other TIBCO BW resources.

TIBCO BW Shared Modules can be exported in two different ways, as regular modules (ZIP file with the source code) and in Binary format, to be shared among other developers but not allowing them to change or change their view of the implementation details. This is still supported for legacy reasons, but today’s recommended way to distribute the software is using Maven, as discussed above.

TIBCO BW Module Use-Cases

As commented there are different use cases for each of the module that because of that it will help you decide which component work best for each scenario:

  • TIBCO BW Shared Modules covers all the standard components needed for all the applications. Here, the main use-case is the framework components or main patterns that simplify the development and homogenize. This helps control standard capabilities such as error handling, auditing, logging, or even internal communication, so the developers only need to focus on the business logic for their use case.
  • Another use-case for TIBCO BW Shared Module encapsulates anything shared between applications, such as Resources, to connect to one backend, so all the applications that need to connect to that backend can import and avoid the need to re-work that part.
  • OSGi Module is to have Java code that has a weak relationship with the BW code, such as component to perform an activity such as Sign a PDF Document or Integrate with an element using a Java native API so we can keep it and evolve it separate to the TIBCO BW Code.
  • Another case for OSGI Module is defining the Custom XPath Functions that you will need as part of your Shared Module or your Application Module.
  • TIBCO BW Application Module, on the other hand, only should have code that is specific to the business problem that we are resolving here, moving all code that can be used for more than one application to a Shared Module.

Learn Now 2 Ways To Configure TIBCO BW EMS Reconnection

On this article we are going to cover how TIBCO BW EMS Reconnection works and how you can apply it on your application and the pros and const about the different options available.

TIBCO BW EMS Reconnection

One of the main issues we all have faced when working on a TIBCO BW and EMS integration is the reconnection part. Even though this is something that we need on minimal occasions because of the TIBCO EMS server’s extreme reliability, it can have severe consequences if we don’t have that well configured.

But before we start talking about the options, we need to do a little background explanation to understand the situation entirely.

Usually, there are two ways that we can use to connect our TIBCO BW application to our TIBCO EMS server: Direct and JNDI. And based on that, this will change how and where we need to configure our reconnection properties.

TIBCO BW + EMS: Direct Connection

This is, as it sounds, a direct connection to the TIBCO BW application to the EMS server itself, with the listener used to send and receive messages. There is no component in the middle, and you can detect that because on the JMS Connection Resources, it will show as “Direct,” and the URL is always in the following fashion: tcp://server: port as you can see in the picture below:

TIBCO BW + EMS: Direct Connection

 TIBCO BW + EMS: JNDI Connection

This is a different kind of connection, and it has a central component compared with the Direct link, as you can imagine. In this scenario, at the connection time, the TIBCO BW application performs a first connection to the JNDI server that is inside the TIBCO EMS server and lookups for the connection details based on a “Connection Factory.” This connection factory will have its connection URL and connection properties. TIBCO BW Application will receive that information and start connecting to that EMS Server.

You will know that you are using a JNDI Connection because the Connection Factory Type now will show JNDI. Also, you will require an additional resource name, JNDI resource, and your URL connection will be something like this tibjmsnaming://server:port.

 TIBCO BW + EMS: JNDI Connection

TIBCO EMS Reconnection Properties

Different properties manage the reconnection process. Those properties will affect the behavior of the EMS client library that lives in the client application, in this case, the TIBCO BW Application. The properties will control the following aspects: the number of connection attempts, time intervals between them, and timeout of the gap to consider it an unsuccessful attempt.


And you will have each of these properties for the reconnection process and the connection process. The main difference is that the connection process will only act when you are setting a connection for the first time (at the startup of the TIBCO BW application). The reconnection settings will apply when you lose a previously established connection.

The concrete properties are the following:

  • tibco.tibjms.reconnect.attemptcount/tibco.tibjms.connect.attemptcount: It will define the number of attempts you will perform when a reconnection scenario is detected
  • tibco.tibjms.reconnect.attemptdelay/tibco.tibjms.connect.attemptdelay: It will define the time interval between two reconnection attempts.
  • tibco.tibjms.reconnect.attempts/tibco.tibjms.connect.attempts It will serve as a combination of the attemptcount and attemptdelay in a comma-separated version.
  • tibco.tibjms.reconnect.attempt.timeout/tibco.tibjms.connect.attempt.timeout: It will define the timeout for each of the reconnection attempts, and if that time is reached, the reconnection is not established; it will be detected as an unsuccessful attempt.

 Where To Set the Reconnection Properties?

In the case that we are talking about a Direct connection, these properties need to be specified on the TIBCO BW application, and these properties will be set as JVM properties.

So depending on your deployment model, these properties will need to be added to the AppNode TRA file or the BW_JAVA_OPS environment variables if we are talking about a containerized deployment.

On the other hand, if we talk about a JNDI connection, these properties will be set at the EMS level as part of the Connection Factory reconnection properties. This can be done using the tibemsadmin CLI component, putting it directly in the factories.conf file, or even using a Graphical tool such as gEMS using the Factories section to update that, as shown in the picture below:

Depending on the approach that you will follow, the properties will be applied at runtime (gEMS or tibemsadminapproach) or on the next restart (factories.conf)

Pros and Cons

There are different pros and cons to using one connection mode. Based on the reconnection properties, using a centralized way such as the JNDI model ensures that all the components using that connection will have the same reconnection properties. If you need to change it, you don’t need to change all your TIBCO BW applications. That can be a number up to hundreds.

But, at the same time, the usage of a centralized way provides less flexibility than the direct connection where you can decide the specific values for each application or even which ones need reconnection configuration and which ones don’t.

Suppose you are looking for simplicity and ease of management. In that case, I will always go for the JNDI-based connection because it provides more benefits in those aspects, and the lack of flexibility is usually not required at all.