Monitoring is one of the hot topics when we talk about cloud-native architectures. Prometheus is a graduated Cloud Native Computing Foundation (CNCF) open-source project and one of the industry-standard solutions when it comes to monitoring your cloud-native deployment, especially when Kubernetes is involved.
Following its own philosophy of providing a managed service for some of the most used open-source projects but fully integrated with the AWS ecosystem, AWS releases a general preview (at the time of writing this article): Amazon Managed Service for Prometheus (AMP).
The first thing is to define what Amazon Managed Service for Prometheus is and what features provide. So, this is the Amazon definition of the service:
A fully managed Prometheus-compatible monitoring service that makes it easy to monitor containerized applications securely and at scale.
And I would like to spend some time on some parts of this sentence.
Fully managed service: So, this will be hosted and handle by Amazon, and we are just going to interact with it using API as we do with other Amazon services like EKS, RDS, MSK, SQS/SNS, and so on.
Prometheus-compatible: So, that means that even if this is not a pure-Prometheus installation, the API is going to be compatible. So the Prometheus clients who can use Grafana or others to get the information from Prometheus will work without changing their interfaces.
Service at-scale: Amazon, as part of the managed service, will take care of the solution’s scalability. You don’t need to define an instance-type or how much RAM or CPU you do need. This is going to be handled by AWS.
So, that sounds perfect. So you can think that you are going to delete your Prometheus server, and it will start using this service. Maybe you are even typing something like helm delete prom… WAIT WAIT!!
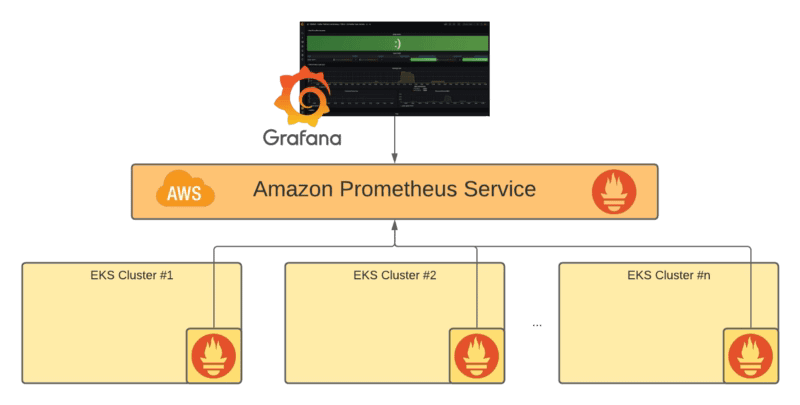
Because at this point, this is not going to replace your local Prometheus server, but it will allow the integration with it. So, that means that your Prometheus server is going to act like a scraper for the whole monitoring scalable solution that AMP is providing, something as you can see in the picture below:
Reference Architecture for Amazon Prometheus Service
So, you are still going to need a Prometheus server, that is right, but all the complexity are going to be avoided and leverage to the managed service: Storage configuration, High availability, API optimization, and so on is going to be just provided to you out of the box.
Ingesting information into Amazon Managed Service for Prometheus
At this moment, there is two way to ingest data into the Amazon Prometheus Service:
From an existing Prometheus server using the remote_write capability and configuration, so that means that each series that is scraped by the local Prometheus is going to be sent to the Amazon Prometheus Service.
Using AWS Distro for OpenTelemetry to integrate with this service using the Prometheus Receiver and the AWS Prometheus Remote Write Exporter components to get that.
Summary
So this is a way to provide an enterprise-grade installation leveraging on all the knowledge that AWS has hosting and managing this solution at scale and optimized in terms of performance. You can focus on the components you need to get the metrics ingested into the service.
I am sure this will not be the last movement from AWS in observability and metrics management topics. I am sure they will continue to provide more tools to the developer’s and architects’ hands to define optimized solutions as easily as possible.
CICD Docker means the approach most companies are using to introduce containers also in the building and pre-deployment phase to implement a part of the CICD pipeline. Let’s see why.
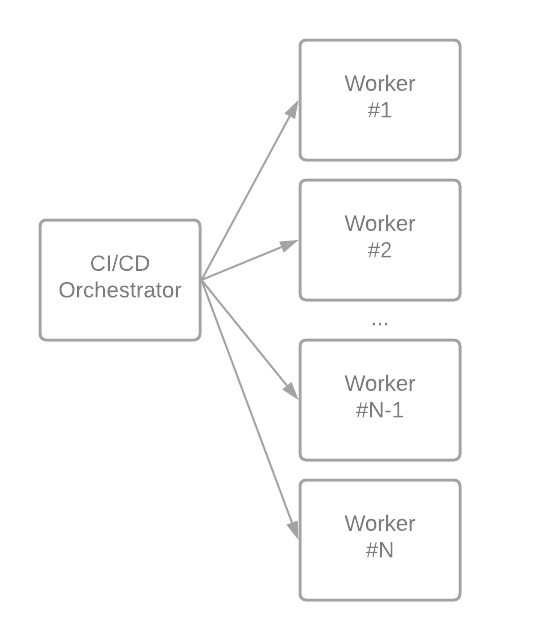
DevSecOps is the new normal for deployments at scale in large enterprises to meet the pace required in digital business nowadays. These processes are orchestrated using a CICD orchestration tool that acts as the brain of this process. Usual tools for doing this job are Jenkins, Bamboo, AzureDevOps, GitLab, GitHub.
In the traditional approach, we have different worker servers doing stages of the DevOps process: Code, Build, Test, Deploy, and for each of them, we need different kinds of tools and utilities to do the job. For example, to get the code, we can need a git installed. To do the build, we can rely on maven or Gradle, and to test, we can use SonarQube and so on.
CICD Docker Structure and the relationship between Orchestrator and Workers
So, in the end, we need a set of tools to perform successfully, and that also requires some management. In the new days, with the rise of cloud-native development and the container approach in the industry, this is also affecting the way that you develop your pipelines to introduce containers as part of the stage.
In most of the CI Orchestrators, you can define a container image to run as any step of your DevSecOps process, and let me tell you that is great if you do so because this will provide you a lot of the benefits that you need to be aware of.
1.- Much more scalable solution
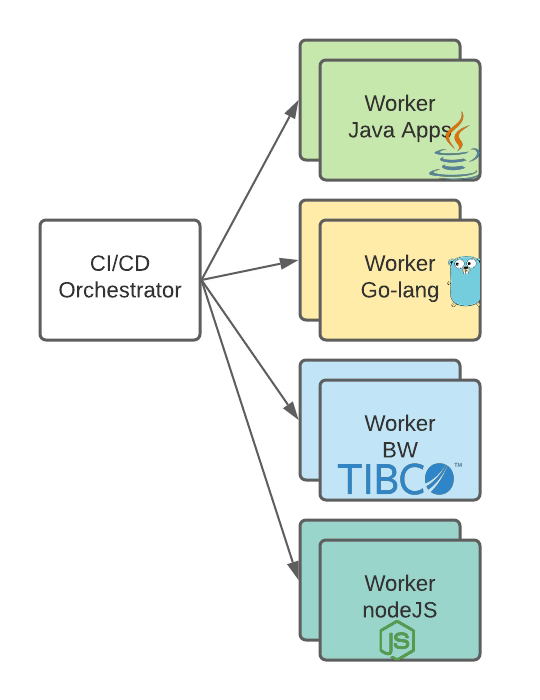
One of the problems when you use an orchestrator as the main element in your company, and that is being used by a lot of different technologies that can be open-source proprietary, code-based, visual development, and so on that means that you need to manage a lot of things and install the software in the workers.
Usually, what you do is that you define some workers to do the build of some artifacts, like the image shown below:
Worker distribution based on its own capabilities
That is great because it allows segmentation of the build process and doesn’t require all software installed in all machines, even when they can be non-compatible.
But what happens if we need to deploy a lot of applications of one of the types that we have in the picture below, like TIBCO BusinessWorks applications? That you will be limited based on the number of workers who have the software installed to build it and deploy it.
With a container-based approach, you will have all the workers available because no software is needed, you just need to pull the docker image, and that’s it, so you are only limited by the infrastructure you use, and if you adopt a cloud platform as part of the build process, these limitations are just removed. Your time to market and deployment pace is improved.
2.- Easy to maintain and extend
If you remove the need to install and manage the workers because they are spin up when you need it and delete it when they are not needed and all the thing you need to do is to create a container image that does the job, the time and the effort the teams need to spend in maintaining and extending the solution will drop considerably.
Also the removal of any upgrade process for the components involved on the steps as they follow the usual container image process.
3.- Avoid Orchestrator lock-in
As we rely on the containers to do most of the job, the work that we need to do to move from one DevOps solution to another is small, and that gives us the control to choose at any moment if the solution that we are using is the best one for our use-case and context or we need to move to another more optimized without the problem to justify big investments to do that job.
You get the control back, and you can also even go to a multi-orchestrator approach if needed, like using the best solution for each use-case and getting all the benefits for each of them at the same time without needing to fight against each of them.
Summary
All the benefits that we all know from cloud-native development paradigms and containers are relevant for application development and other processes that we use in our organization, being one of those your DevSecOps pipeline and processes. Start today making that journey to get all those advantages in the building process and not wait until it is too late. Enjoy your day. Enjoy your life.
When talking about Kubernetes, you’re always talking about the flexibility options that it provides. Usually, one of the topics that come into the discussion is the elasticity options that come with the platform — especially when working on a public cloud provider. But how can we really implement it?
Before we start to show how to scale our Kubernetes platform, we need to do a quick recap of the options that are available to us:
Cluster Autoscaler: When the load of the whole infrastructure reaches its peak, we can improve it by creating new worker nodes to host more service instances.
Horizontal Pod Autoscaling: When the load for a specific pod or set of pods reaches its peak, we deploy a new instance to ensure that we can have the global availability that we need.
Let’s see how we can implement these using one of the most popular Kubernetes-managed services, Amazon’s Elastic Kubernetes Services (EKS).
Setup
The first thing that we’re going to do is create a cluster with a single worker node to demonstrate the scalability behavior easily. And to do that, we’re going to use the command-line tool eksctl to manage an EKS cluster easily.
To be able to create the cluster, we’re going to do it with the following command:
After a few minutes, we will have our own Kubernetes cluster with a single node to deploy applications on top of it.
Now we’re going to create a sample application to generate load. We’re going to use TIBCO BusinessWorks Application Container Edition to generate a simple application. It will be a REST API that will execute a loop of 100,000 iterations acting as a counter and return a result.
BusinessWorks sample application to show the scalability options
And we will use the resources available in this GitHub repository:
GitHub – alexandrev/testeks
Contribute to alexandrev/testeks development by creating an account on GitHub.
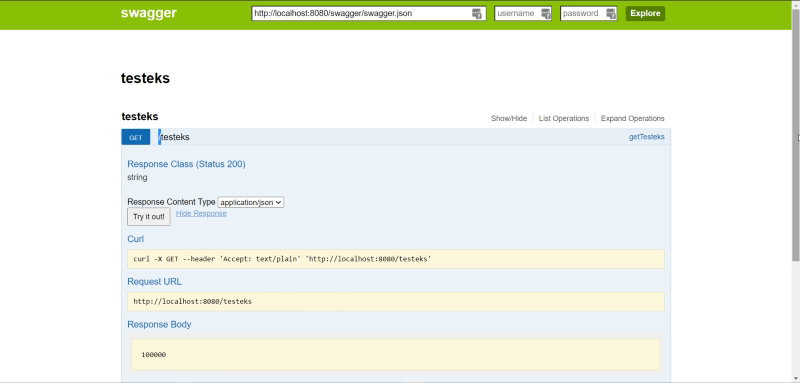
We will build the container image and push it to a container registry. In my case, I am going to use my Amazon ECR instance to do so, and I will use the following commands:
With that, I can see and test the sample application using the browser, as shown below:
Swagger UI tester for the Kubernetes sample application
Horizontal pod autoscaling
Now, we need to start defining the autoscale rules, and we will start with the Horizontal Pod Autoscaler (HPA) rule. We will need to choose the resource that we would like to use to scale our pod. In this test, I will use the CPU utilization to do so, and I will use the following command:
That command will scale the replica set testeks from one (1) instance to five (5) instances when the CPU utilization percent is higher than 80%.
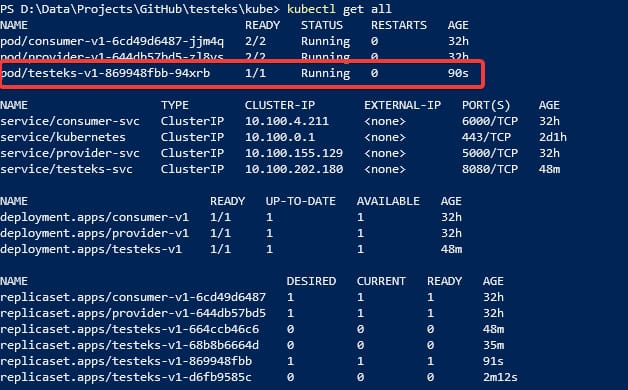
If now we check the status of the components, we will get something similar to the image below:
HPA rule definition for the application using CPU utilization as the key metric
If we check the TARGETS column, we will see this value: <unknown>/80%. That means that 80% is the target to trigger the new instances and the current usage is <unknown>.
We do not have anything deployed on the cluster to get the metrics for each of the pods. To solve that, we need to deploy the Metrics Server. To do so, we will follow the Amazon AWS documentation:
Installing the Kubernetes Metrics Server – Amazon EKS
The Kubernetes Metrics Server is an aggregator of resource usage data in your cluster, and it is not deployed by default in Amazon EKS clusters. For more information, see Kubernetes Metrics Server on GitHub. The Metrics Server is commonly used by other Kubernetes add ons, such as the
So, running the following command, we will have the Metrics Server installed.
And after doing that, if we check again, we can see that the current user has replaced the <unknown>:
Current resource utilization after installing the Metrics Server on the Kubernetes cluster
If that works, I am going to start sending requests using a Load Test inside the cluster. I will use the sample app defined below:
Auto Scaling Capacity with HPA – Ultimate Kubernetes Bootcamp
With Horizontal Pod Autoscaling, Kubernetes automatically scales the number of pods in a replication controller, deployment or replica set based on observed CPU utilization (or, with alpha support, on some other, application-provided metrics).
To deploy, we will use a YAML file with the following content:
And we will deploy it using the following command:
kubectl apply -f tester.yaml
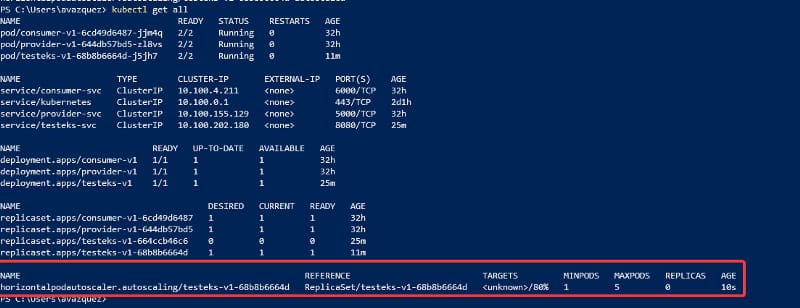
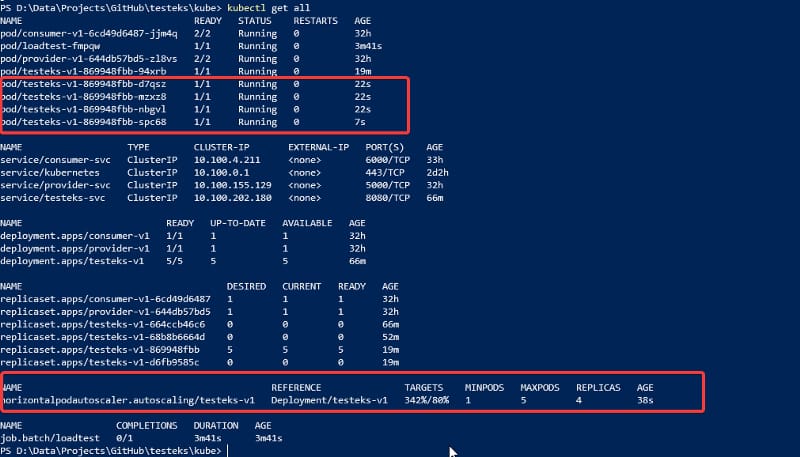
After doing that, we will see that the current utilization is being increased. After a few seconds, it will start spinning new instances until it meets the maximum number of pods defined in the HPA rule.
Pods increasing when the load exceeds the target defined in previous steps.
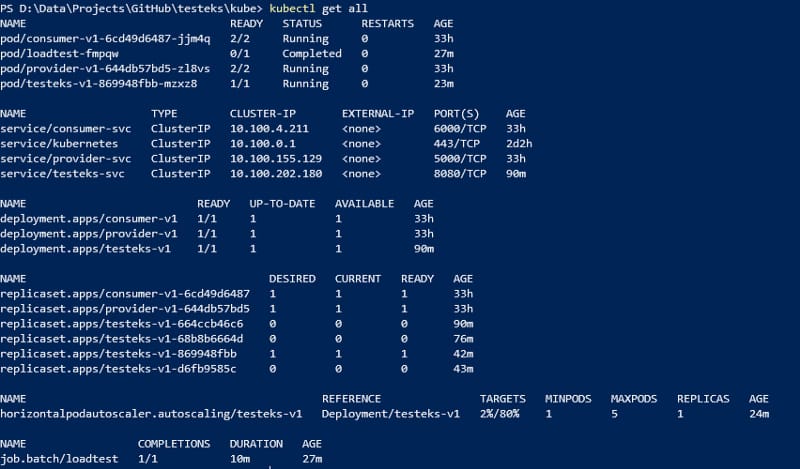
Then, as soon as the load also decreases, the number of instances will be deleted.
Pods are deleted as soon as the load decreases.
Cluster autoscaling
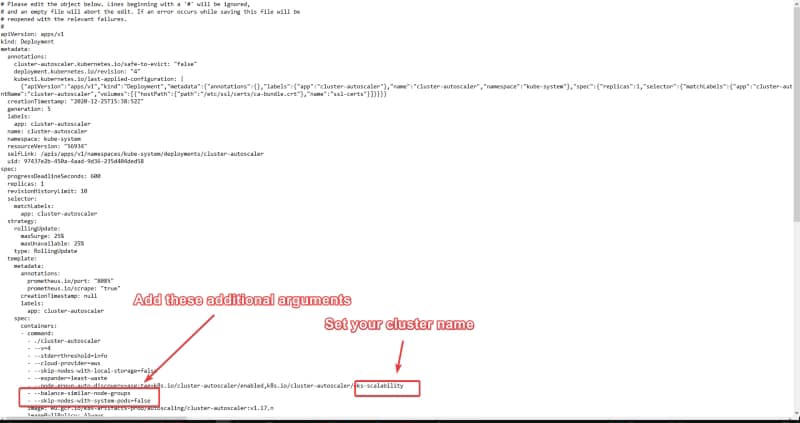
Now, we need to see how we can implement the Cluster Autoscaler using EKS. We will use the information that Amazon provides:
Deployment edits that are needed to configure the Cluster Autoscaler
Now we need to run the following command:
kubectl -n kube-system set image deployment.apps/cluster-autoscaler cluster-autoscaler=eu.gcr.io/k8s-artifacts-prod/autoscaling/cluster-autoscaler:v1.17.4
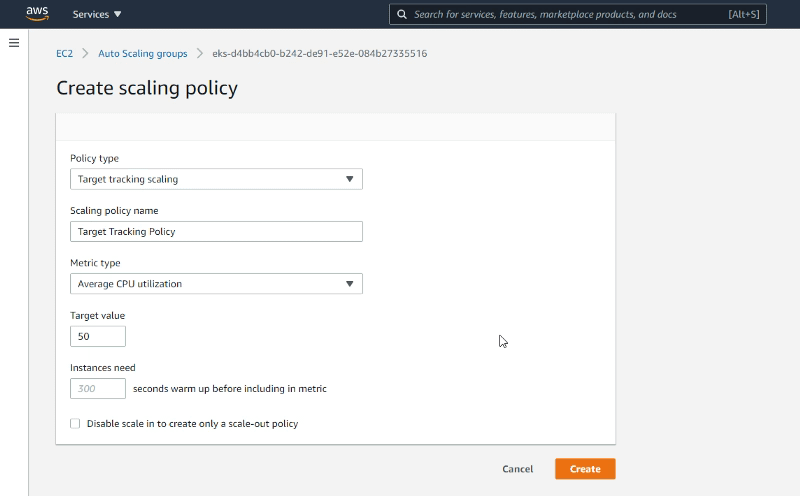
The only thing that is left is to define the AutoScaling policy. To do that, we will use the AWS Services portal:
Enter into the EC service page on the region in which we have deployed the cluster.
Select the Auto Scaling Group options.
Select the Auto Scaling Group that has been created as part of the EKS cluster-creating process.
Go to the Automatic Scaling tab and click on the Add Policy button available.
Autoscaling policy option in the EC2 Service console
Then we should define the policy. We will use the Average CPU utilization as the metric and set the target value to 50%:
Autoscaling policy creation dialog
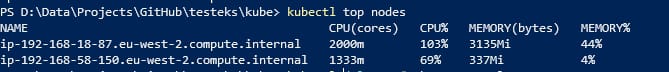
To validate the behavior, we will generate load using the tester as we did in the previous test and validate the node load using the following command:
kubectl top nodes
kubectl top nodes’ sample output
Now we deploy the tester again. As we already have it deployed in this cluster, we need to delete it first to deploy it again:
As soon as the load starts, new nodes are created, as shown in the image below:
kubectl top nodes showing how nodes have been scaled up
After the load finishes, we go back to the previous situation:
kubectl top nodes showing how nodes have been scaled down
Summary
In this article, we have shown how we can scale a Kubernetes cluster in a dynamic way both at the worker node level using the Cluster Autoscaler capability and at the pod level using the Horizontal Pod Autoscaler. That gives us all the options needed to create a truly elastic and flexible environment able to adapt to each moment’s needs with the most efficient approach.
Auto Scaling Capacity with HPA – Ultimate Kubernetes Bootcamp
With Horizontal Pod Autoscaling, Kubernetes automatically scales the number of pods in a replication controller, deployment or replica set based on observed CPU utilization (or, with alpha support, on some other, application-provided metrics).
One of the biggest announcements from the latest AWS re:Invent 2020 sessions was the release of EKS-D from Amazon. EKS-D is their open-source Kubernetes Distribution that’s now available for everyone to start using in their cloud provider or even on-premises.
It’s based on past findings and the entire process Amazon has undergone in managing their Kubernetes managed platform, Amazon EKS.
These announcements have many people asking themselves: “OK, I know Kubernetes, but what’s a Kubernetes distribution? And why should I care?”
So I’ll try to answer that with the knowledge I have, and I always try to use the same approach: a Kubernetes versus Linux model comparison.
Kubernetes is an open-source project, as you know, started by Google and is now being managed by the community and the Cloud Native Computing Foundation (CNCF), and you can find all the code available here:
GitHub – kubernetes/kubernetes: Production-Grade Container Scheduling and Management
Production-Grade Container Scheduling and Management – GitHub – kubernetes/kubernetes: Production-Grade Container Scheduling and Management
But let’s be honest: Not many of us are pulling that repo and trying to compile it to provide a cluster. That’s not how we usually work. If you follow the code path — downloading it, building it, and so on — this is usually named vanilla Kubernetes.
If we start with the Linux comparison, it’s the same situation as we have with the Linux kernel that most of the Linux distribution ships, but this is already compiled and available with a bunch of other tools all working together via the usual approach.
So that’s what a Kubernetes distribution is. They build Kubernetes. They provide other tools and components to enhance or provide more features and to focus on additional aspects like a security focus, a DevOps focus, or another focus. Another concept that usually is raised is the purity of distribution, and we try to talk about distribution that’s pure.
We call a distribution pure when it’s building Kubernetes, and that’s it. It leaves everything else to the developers or users to decide what they want to use on top of it.
What Are the Main Components Shipped in a Kubernetes Distribution?
The main components that can differ when we’re talking about a Kubernetes distribution are the following:
Container runtime and registries
We all know there’s more that one container runtime, and even if you weren’t aware of that, you’ve probably read all of the articles regarding the removal of Docker support in Kubernetes v1.20, as you can read in this awesome article from Edgar Rodriguez.
Kubernetes Just Deprecated Docker Support. What Now?
Will this kill Docker?
At this moment, it seems all runtimes should support the existing Container Runtime Interface, and runtimes like CRI-O, Containerd, or Kata seem to be the default options now.
Networking
Another topic that often differs when we’re talking about Kubernetes distributions is how they manage their network, and this is one of the most critical aspects of the whole platform.
As we have with the container runtime, a standard specification exists to cover that topic, and that’s the Container Network Interface (CNI). Several projects exist on this topic, like Flannel, Calico, Canal, and Wave. Also, some platforms provide their own component, like the Openshift SDN operator.
Storage
How to handle storage in Kubernetes is also very important, especially as we embrace this model in deployments that require stateful models. Different platforms can support different storage options, like file systems and so on.
Who Are the Top Players?
The first thing we need to be aware of is there are a huge number of Kubernetes distributions out there.
We’ll count the ones with a CNCF certification, and you can take a look at all of them here. At the moment of writing this article, we’re talking about 72 certified distributions.
These are the ones that I’d like to highlight today:
Red Hat OpenShift
The Red Hat OpenShift platform could be one of the most used platforms, especially in a private-cloud fashion. It could include most of the Red Hat services regarding storage, like GlusterFS and networking with OpenShift DNS. It has OKD as the open-source project that backs and contributes to the OpenShift platform. Check this article to see how to set up Openshift locally to test it
Mirantis
The former Docker enterprise that’s been acquired by Mirantis is another of the usual choices when we’re talking about supported platforms.
VMware Tanzu
VMware Tanzu, also coming from the acquisition of Pivotal from VMware, is a Kubernetes platform.
Canonical
Canonical (open source) is a platform from the company that develops and maintains Ubuntu. It’s another one of the important choices here and provides a variety of options, focusing not only on the common central mode but also on edge Kubernetes deployments with projects like MicroK8S and more options.
Rancher
Rancher (open source) is another one of the big players, focusing on following and extending the CNCF standards and also offering a big push for edge deployment with K3S. It also offers automated upgrades.
Summary
So, as you can see, the number of options available out there is huge. They all differ, so it’s important to take your time when you’re deciding your target platform based on your criteria for your project or your company.
And that’s without covering the managed platforms available out there that are becoming one of the more preferred options for companies so they can get all the flexibility from Kubernetes while not needing to handle the complexity of managing a Kubernetes platform themselves. But that’s a topic for another article — hopefully soon.
This article at least has provided you with more clarity about what a Kubernetes distribution is, the main differences among them, and a quick look at some of the key actors in this spectrum. Enjoy your day, and enjoy your life.
I need to start this article by admitting that I am an advocate of Graphical User Interfaces and everything that provides a way to speed up the way we do things and be more productive.
So when we talk about how to manage our Kubernetes cluster mainly for development purposes, you can imagine that I am one of those people who tries any available tool to make that journey easier. The ones who’ve started using Portainer to manage their local Docker engine or are a fan of the new dashboard in Docker for Windows/Mac. But that is far from reality.
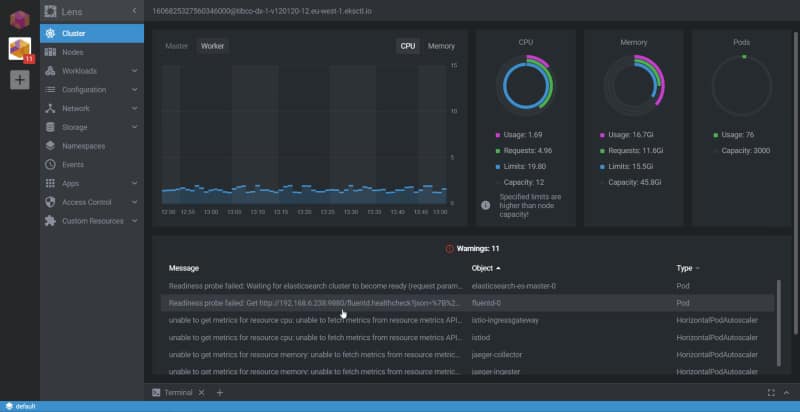
In terms of Kubernetes management, I got used to typing all the commands to check the pods, the logs, the status of the cluster to do the port-forwards, etc. Any task I did was with a terminal, and I felt that it was the right thing to do. I did not even use a Kubernetes dashboard to have a web page for my Kubernetes environment. All of that changed last week when I met with a colleague who showed me what Lens could do.
Lens is a totally different story. I am not praising it because I am being paid to do so. This is an open source project that you can find on GitHub. But the way that it does the job is just awesome!
Image of Len showing the status of a Kubernetes cluster — Screenshot by the author.
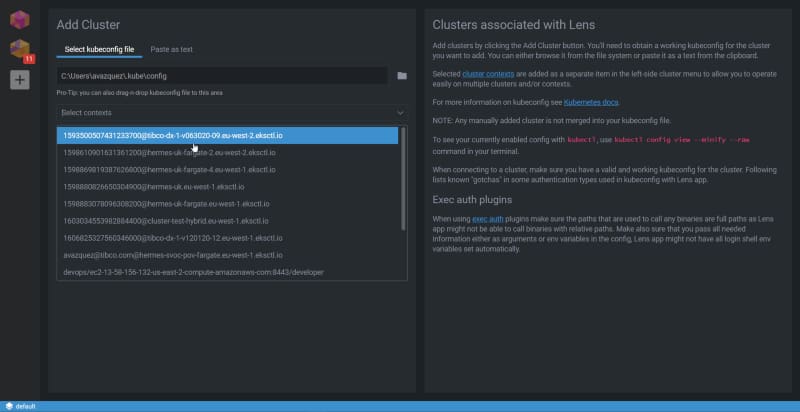
The first thing I would like to mention regarding Lens is that it has multi-context support, so you can have all the different Kubernetes contexts available to switch following a Slack approach when we switch from different workspaces. It just reads your .kube/config file and makes all those contexts available to you to connect to the one you would like.
Kubernetes context selection in Lens
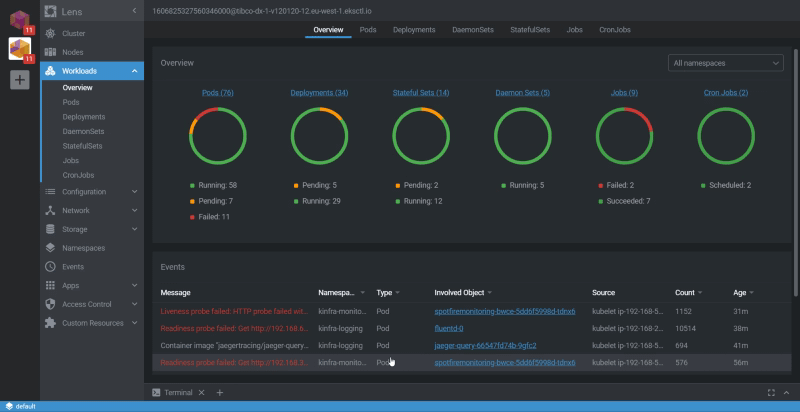
Once we have connected to one of these clusters, we have different options to see the status of it, but the first one is to check the Workloads using the Overview option:
Workloads Overview in Lens
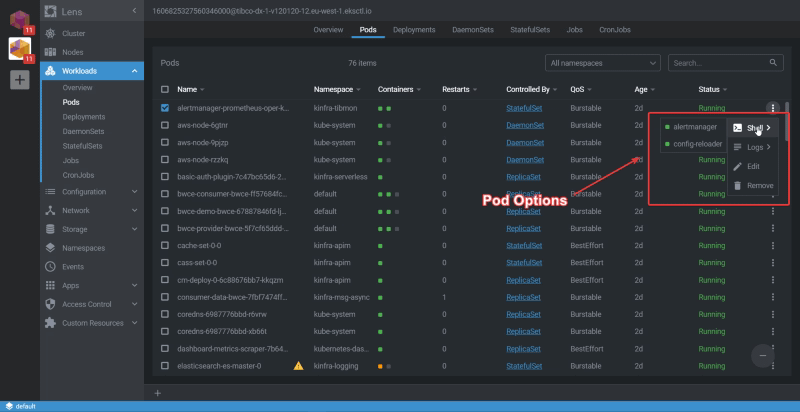
Then, you can drill down to any pod or different object inside Kubernetes to check its status and at the same time do the main actions you usually do when you deal with a pod, such as check the logs, execute a terminal to one of the containers that belong to that pod, or even edit the YAML for that pod.
Pod options inside Lens
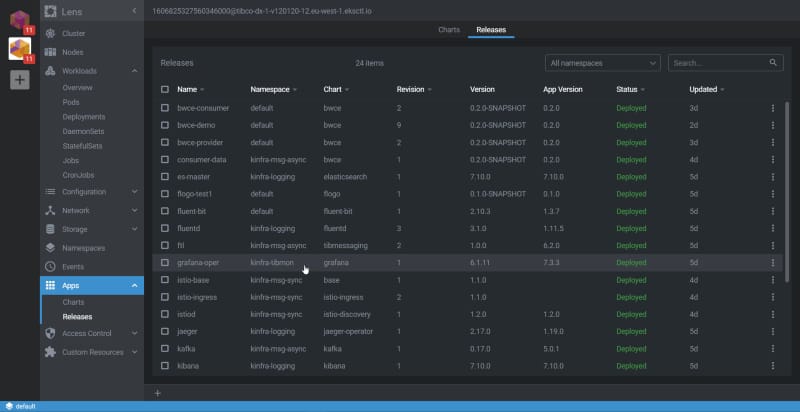
But Lens goes beyond the usual Kubernetes tasks because it also has a Helm integration, so you can check the releases that you have there, the version of the status, and so on:
Helm integration option in Lens
The experience of managing everything feels perfect. You are more productive as well. Even those who love the CLI and terminals need to admit that to do regular tasks, the Graphical approach and the mouse are faster than the keyboard — even for the defenders of the mechanical keyboard like myself.
So, I encourage you to download Lens and start using it right now. To do so, go to their main web page and download it:
In previous posts, we discussed how the storage layer worked for Prometheus and how effective it was. But in the current times, we are of cloud computing we know that each technical optimization is also a cost optimization as well and that is why we need to be very diligent about any option that we use regarding optimization.
We know that usually when we monitor using Prometheus we have so many exporters available at our disposal and also that each of them exposes a lot of very relevant metrics that we need to track everything we need to. But also, we should be aware that there are also metrics that we don’t need at this moment or we don’t plan to use it. So, if we are not planning to use, why do we want to waste disk space storing them?
So, let’s start taking a look at one of the exporters we have in our system. In my case, I would like to use a BusinessWorks Container Application that exposes metrics about its utilization. If you check their metrics endpoint you could see something like this:
# HELP jvm_info JVM version info
# TYPE jvm_info gauge
jvm_info{version="1.8.0_221-b27",vendor="Oracle Corporation",runtime="Java(TM) SE Runtime Environment",} 1.0
# HELP jvm_memory_bytes_used Used bytes of a given JVM memory area.
# TYPE jvm_memory_bytes_used gauge
jvm_memory_bytes_used{area="heap",} 1.0318492E8
jvm_memory_bytes_used{area="nonheap",} 1.52094712E8
# HELP jvm_memory_bytes_committed Committed (bytes) of a given JVM memory area.
# TYPE jvm_memory_bytes_committed gauge
jvm_memory_bytes_committed{area="heap",} 1.35266304E8
jvm_memory_bytes_committed{area="nonheap",} 1.71302912E8
# HELP jvm_memory_bytes_max Max (bytes) of a given JVM memory area.
# TYPE jvm_memory_bytes_max gauge
jvm_memory_bytes_max{area="heap",} 1.073741824E9
jvm_memory_bytes_max{area="nonheap",} -1.0
# HELP jvm_memory_bytes_init Initial bytes of a given JVM memory area.
# TYPE jvm_memory_bytes_init gauge
jvm_memory_bytes_init{area="heap",} 1.34217728E8
jvm_memory_bytes_init{area="nonheap",} 2555904.0
# HELP jvm_memory_pool_bytes_used Used bytes of a given JVM memory pool.
# TYPE jvm_memory_pool_bytes_used gauge
jvm_memory_pool_bytes_used{pool="Code Cache",} 3.3337536E7
jvm_memory_pool_bytes_used{pool="Metaspace",} 1.04914136E8
jvm_memory_pool_bytes_used{pool="Compressed Class Space",} 1.384304E7
jvm_memory_pool_bytes_used{pool="G1 Eden Space",} 3.3554432E7
jvm_memory_pool_bytes_used{pool="G1 Survivor Space",} 1048576.0
jvm_memory_pool_bytes_used{pool="G1 Old Gen",} 6.8581912E7
# HELP jvm_memory_pool_bytes_committed Committed bytes of a given JVM memory pool.
# TYPE jvm_memory_pool_bytes_committed gauge
jvm_memory_pool_bytes_committed{pool="Code Cache",} 3.3619968E7
jvm_memory_pool_bytes_committed{pool="Metaspace",} 1.19697408E8
jvm_memory_pool_bytes_committed{pool="Compressed Class Space",} 1.7985536E7
jvm_memory_pool_bytes_committed{pool="G1 Eden Space",} 4.6137344E7
jvm_memory_pool_bytes_committed{pool="G1 Survivor Space",} 1048576.0
jvm_memory_pool_bytes_committed{pool="G1 Old Gen",} 8.8080384E7
# HELP jvm_memory_pool_bytes_max Max bytes of a given JVM memory pool.
# TYPE jvm_memory_pool_bytes_max gauge
jvm_memory_pool_bytes_max{pool="Code Cache",} 2.5165824E8
jvm_memory_pool_bytes_max{pool="Metaspace",} -1.0
jvm_memory_pool_bytes_max{pool="Compressed Class Space",} 1.073741824E9
jvm_memory_pool_bytes_max{pool="G1 Eden Space",} -1.0
jvm_memory_pool_bytes_max{pool="G1 Survivor Space",} -1.0
jvm_memory_pool_bytes_max{pool="G1 Old Gen",} 1.073741824E9
# HELP jvm_memory_pool_bytes_init Initial bytes of a given JVM memory pool.
# TYPE jvm_memory_pool_bytes_init gauge
jvm_memory_pool_bytes_init{pool="Code Cache",} 2555904.0
jvm_memory_pool_bytes_init{pool="Metaspace",} 0.0
jvm_memory_pool_bytes_init{pool="Compressed Class Space",} 0.0
jvm_memory_pool_bytes_init{pool="G1 Eden Space",} 7340032.0
jvm_memory_pool_bytes_init{pool="G1 Survivor Space",} 0.0
jvm_memory_pool_bytes_init{pool="G1 Old Gen",} 1.26877696E8
# HELP jvm_buffer_pool_used_bytes Used bytes of a given JVM buffer pool.
# TYPE jvm_buffer_pool_used_bytes gauge
jvm_buffer_pool_used_bytes{pool="direct",} 148590.0
jvm_buffer_pool_used_bytes{pool="mapped",} 0.0
# HELP jvm_buffer_pool_capacity_bytes Bytes capacity of a given JVM buffer pool.
# TYPE jvm_buffer_pool_capacity_bytes gauge
jvm_buffer_pool_capacity_bytes{pool="direct",} 148590.0
jvm_buffer_pool_capacity_bytes{pool="mapped",} 0.0
# HELP jvm_buffer_pool_used_buffers Used buffers of a given JVM buffer pool.
# TYPE jvm_buffer_pool_used_buffers gauge
jvm_buffer_pool_used_buffers{pool="direct",} 19.0
jvm_buffer_pool_used_buffers{pool="mapped",} 0.0
# HELP jvm_classes_loaded The number of classes that are currently loaded in the JVM
# TYPE jvm_classes_loaded gauge
jvm_classes_loaded 16993.0
# HELP jvm_classes_loaded_total The total number of classes that have been loaded since the JVM has started execution
# TYPE jvm_classes_loaded_total counter
jvm_classes_loaded_total 17041.0
# HELP jvm_classes_unloaded_total The total number of classes that have been unloaded since the JVM has started execution
# TYPE jvm_classes_unloaded_total counter
jvm_classes_unloaded_total 48.0
# HELP bwce_activity_stats_list BWCE Activity Statictics list
# TYPE bwce_activity_stats_list gauge
# HELP bwce_activity_counter_list BWCE Activity related Counters list
# TYPE bwce_activity_counter_list gauge
# HELP all_activity_events_count BWCE All Activity Events count by State
# TYPE all_activity_events_count counter
all_activity_events_count{StateName="CANCELLED",} 0.0
all_activity_events_count{StateName="COMPLETED",} 0.0
all_activity_events_count{StateName="STARTED",} 0.0
all_activity_events_count{StateName="FAULTED",} 0.0
# HELP activity_events_count BWCE All Activity Events count by Process, Activity State
# TYPE activity_events_count counter
# HELP activity_total_evaltime_count BWCE Activity EvalTime  by Process and Activity
# TYPE activity_total_evaltime_count counter
# HELP activity_total_duration_count BWCE Activity DurationTime by Process and Activity
# TYPE activity_total_duration_count counter
# HELP bwpartner_instance:total_request Total Request for the partner invocation which mapped from the activities
# TYPE bwpartner_instance:total_request counter
# HELP bwpartner_instance:total_duration_ms Total Duration for the partner invocation which mapped from the activities (execution or latency)
# TYPE bwpartner_instance:total_duration_ms counter
# HELP bwce_process_stats BWCE Process Statistics list
# TYPE bwce_process_stats gauge
# HELP bwce_process_counter_list BWCE Process related Counters list
# TYPE bwce_process_counter_list gauge
# HELP all_process_events_count BWCE All Process Events count by State
# TYPE all_process_events_count counter
all_process_events_count{StateName="CANCELLED",} 0.0
all_process_events_count{StateName="COMPLETED",} 0.0
all_process_events_count{StateName="STARTED",} 0.0
all_process_events_count{StateName="FAULTED",} 0.0
# HELP process_events_count BWCE Process Events count by Operation
# TYPE process_events_count counter
# HELP process_duration_seconds_total BWCE Process Events duration by Operation in seconds
# TYPE process_duration_seconds_total counter
# HELP process_duration_milliseconds_total BWCE Process Events duration by Operation in milliseconds
# TYPE process_duration_milliseconds_total counter
# HELP bwdefinitions:partner BWCE Process Events count by Operation
# TYPE bwdefinitions:partner counter
bwdefinitions:partner{ProcessName="t1.module.item.getTransactionData",ActivityName="FTLPublisher",ServiceName="GetCustomer360",OperationName="GetDataOperation",PartnerService="TransactionService",PartnerOperation="GetTransactionsOperation",Location="internal",PartnerMiddleware="MW",} 1.0
bwdefinitions:partner{ProcessName=" t1.module.item.auditProcess",ActivityName="KafkaSendMessage",ServiceName="GetCustomer360",OperationName="GetDataOperation",PartnerService="AuditService",PartnerOperation="AuditOperation",Location="internal",PartnerMiddleware="MW",} 1.0
bwdefinitions:partner{ProcessName="t1.module.item.getCustomerData",ActivityName="JMSRequestReply",ServiceName="GetCustomer360",OperationName="GetDataOperation",PartnerService="CustomerService",PartnerOperation="GetCustomerDetailsOperation",Location="internal",PartnerMiddleware="MW",} 1.0
# HELP bwdefinitions:binding BW Design Time Repository - binding/transport definition
# TYPE bwdefinitions:binding counter
bwdefinitions:binding{ServiceName="GetCustomer360",OperationName="GetDataOperation",ServiceInterface="GetCustomer360:GetDataOperation",Binding="/customer",Transport="HTTP",} 1.0
# HELP bwdefinitions:service BW Design Time Repository - Service definition
# TYPE bwdefinitions:service counter
bwdefinitions:service{ProcessName="t1.module.sub.item.getCustomerData",ServiceName="GetCustomer360",OperationName="GetDataOperation",ServiceInstance="GetCustomer360:GetDataOperation",} 1.0
bwdefinitions:service{ProcessName="t1.module.sub.item.auditProcess",ServiceName="GetCustomer360",OperationName="GetDataOperation",ServiceInstance="GetCustomer360:GetDataOperation",} 1.0
bwdefinitions:service{ProcessName="t1.module.sub.orchestratorSubFlow",ServiceName="GetCustomer360",OperationName="GetDataOperation",ServiceInstance="GetCustomer360:GetDataOperation",} 1.0
bwdefinitions:service{ProcessName="t1.module.Process",ServiceName="GetCustomer360",OperationName="GetDataOperation",ServiceInstance="GetCustomer360:GetDataOperation",} 1.0
# HELP bwdefinitions:gateway BW Design Time Repository - Gateway definition
# TYPE bwdefinitions:gateway counter
bwdefinitions:gateway{ServiceName="GetCustomer360",OperationName="GetDataOperation",ServiceInstance="GetCustomer360:GetDataOperation",Endpoint="bwce-demo-mon-orchestrator-bwce",InteractionType="ISTIO",} 1.0
# HELP process_cpu_seconds_total Total user and system CPU time spent in seconds.
# TYPE process_cpu_seconds_total counter
process_cpu_seconds_total 1956.86
# HELP process_start_time_seconds Start time of the process since unix epoch in seconds.
# TYPE process_start_time_seconds gauge
process_start_time_seconds 1.604712447107E9
# HELP process_open_fds Number of open file descriptors.
# TYPE process_open_fds gauge
process_open_fds 763.0
# HELP process_max_fds Maximum number of open file descriptors.
# TYPE process_max_fds gauge
process_max_fds 1048576.0
# HELP process_virtual_memory_bytes Virtual memory size in bytes.
# TYPE process_virtual_memory_bytes gauge
process_virtual_memory_bytes 3.046207488E9
# HELP process_resident_memory_bytes Resident memory size in bytes.
# TYPE process_resident_memory_bytes gauge
process_resident_memory_bytes 4.2151936E8
# HELP jvm_gc_collection_seconds Time spent in a given JVM garbage collector in seconds.
# TYPE jvm_gc_collection_seconds summary
jvm_gc_collection_seconds_count{gc="G1 Young Generation",} 540.0
jvm_gc_collection_seconds_sum{gc="G1 Young Generation",} 4.754
jvm_gc_collection_seconds_count{gc="G1 Old Generation",} 2.0
jvm_gc_collection_seconds_sum{gc="G1 Old Generation",} 0.563
# HELP jvm_threads_current Current thread count of a JVM
# TYPE jvm_threads_current gauge
jvm_threads_current 98.0
# HELP jvm_threads_daemon Daemon thread count of a JVM
# TYPE jvm_threads_daemon gauge
jvm_threads_daemon 43.0
# HELP jvm_threads_peak Peak thread count of a JVM
# TYPE jvm_threads_peak gauge
jvm_threads_peak 98.0
# HELP jvm_threads_started_total Started thread count of a JVM
# TYPE jvm_threads_started_total counter
jvm_threads_started_total 109.0
# HELP jvm_threads_deadlocked Cycles of JVM-threads that are in deadlock waiting to acquire object monitors or ownable synchronizers
# TYPE jvm_threads_deadlocked gauge
jvm_threads_deadlocked 0.0
# HELP jvm_threads_deadlocked_monitor Cycles of JVM-threads that are in deadlock waiting to acquire object monitors
# TYPE jvm_threads_deadlocked_monitor gauge
jvm_threads_deadlocked_monitor 0.0
As you can see a lot of metrics but I have to be honest I am not using most of them in my dashboards and to generate my alerts. I can use the metrics regarding the application performance for each of the BusinessWorks process and its activities, also the JVM memory performance and number of threads but things like how the JVM GC is working for each of the layers of the JVM (G1 Young Generation, G1 Old Generation) I’m not using them at all.
So, If I show the same metric endpoint highlighting the things that I am not using it would be something like this:
# HELP jvm_info JVM version info
# TYPE jvm_info gauge
jvm_info{version="1.8.0_221-b27",vendor="Oracle Corporation",runtime="Java(TM) SE Runtime Environment",} 1.0
# HELP jvm_memory_bytes_used Used bytes of a given JVM memory area.
# TYPE jvm_memory_bytes_used gauge
jvm_memory_bytes_used{area="heap",} 1.0318492E8
jvm_memory_bytes_used{area="nonheap",} 1.52094712E8
# HELP jvm_memory_bytes_committed Committed (bytes) of a given JVM memory area.
# TYPE jvm_memory_bytes_committed gauge
jvm_memory_bytes_committed{area="heap",} 1.35266304E8
jvm_memory_bytes_committed{area="nonheap",} 1.71302912E8
# HELP jvm_memory_bytes_max Max (bytes) of a given JVM memory area.
# TYPE jvm_memory_bytes_max gauge
jvm_memory_bytes_max{area="heap",} 1.073741824E9
jvm_memory_bytes_max{area="nonheap",} -1.0
# HELP jvm_memory_bytes_init Initial bytes of a given JVM memory area.
# TYPE jvm_memory_bytes_init gauge
jvm_memory_bytes_init{area="heap",} 1.34217728E8
jvm_memory_bytes_init{area="nonheap",} 2555904.0
# HELP jvm_memory_pool_bytes_used Used bytes of a given JVM memory pool.
# TYPE jvm_memory_pool_bytes_used gauge
jvm_memory_pool_bytes_used{pool="Code Cache",} 3.3337536E7
jvm_memory_pool_bytes_used{pool="Metaspace",} 1.04914136E8
jvm_memory_pool_bytes_used{pool="Compressed Class Space",} 1.384304E7
jvm_memory_pool_bytes_used{pool="G1 Eden Space",} 3.3554432E7
jvm_memory_pool_bytes_used{pool="G1 Survivor Space",} 1048576.0
jvm_memory_pool_bytes_used{pool="G1 Old Gen",} 6.8581912E7
# HELP jvm_memory_pool_bytes_committed Committed bytes of a given JVM memory pool.
# TYPE jvm_memory_pool_bytes_committed gauge
jvm_memory_pool_bytes_committed{pool="Code Cache",} 3.3619968E7
jvm_memory_pool_bytes_committed{pool="Metaspace",} 1.19697408E8
jvm_memory_pool_bytes_committed{pool="Compressed Class Space",} 1.7985536E7
jvm_memory_pool_bytes_committed{pool="G1 Eden Space",} 4.6137344E7
jvm_memory_pool_bytes_committed{pool="G1 Survivor Space",} 1048576.0
jvm_memory_pool_bytes_committed{pool="G1 Old Gen",} 8.8080384E7
# HELP jvm_memory_pool_bytes_max Max bytes of a given JVM memory pool.
# TYPE jvm_memory_pool_bytes_max gauge
jvm_memory_pool_bytes_max{pool="Code Cache",} 2.5165824E8
jvm_memory_pool_bytes_max{pool="Metaspace",} -1.0
jvm_memory_pool_bytes_max{pool="Compressed Class Space",} 1.073741824E9
jvm_memory_pool_bytes_max{pool="G1 Eden Space",} -1.0
jvm_memory_pool_bytes_max{pool="G1 Survivor Space",} -1.0
jvm_memory_pool_bytes_max{pool="G1 Old Gen",} 1.073741824E9
# HELP jvm_memory_pool_bytes_init Initial bytes of a given JVM memory pool.
# TYPE jvm_memory_pool_bytes_init gauge
jvm_memory_pool_bytes_init{pool="Code Cache",} 2555904.0
jvm_memory_pool_bytes_init{pool="Metaspace",} 0.0
jvm_memory_pool_bytes_init{pool="Compressed Class Space",} 0.0
jvm_memory_pool_bytes_init{pool="G1 Eden Space",} 7340032.0
jvm_memory_pool_bytes_init{pool="G1 Survivor Space",} 0.0
jvm_memory_pool_bytes_init{pool="G1 Old Gen",} 1.26877696E8
# HELP jvm_buffer_pool_used_bytes Used bytes of a given JVM buffer pool.
# TYPE jvm_buffer_pool_used_bytes gauge
jvm_buffer_pool_used_bytes{pool="direct",} 148590.0
jvm_buffer_pool_used_bytes{pool="mapped",} 0.0
# HELP jvm_buffer_pool_capacity_bytes Bytes capacity of a given JVM buffer pool.
# TYPE jvm_buffer_pool_capacity_bytes gauge
jvm_buffer_pool_capacity_bytes{pool="direct",} 148590.0
jvm_buffer_pool_capacity_bytes{pool="mapped",} 0.0
# HELP jvm_buffer_pool_used_buffers Used buffers of a given JVM buffer pool.
# TYPE jvm_buffer_pool_used_buffers gauge
jvm_buffer_pool_used_buffers{pool="direct",} 19.0
jvm_buffer_pool_used_buffers{pool="mapped",} 0.0
# HELP jvm_classes_loaded The number of classes that are currently loaded in the JVM
# TYPE jvm_classes_loaded gauge
jvm_classes_loaded 16993.0
# HELP jvm_classes_loaded_total The total number of classes that have been loaded since the JVM has started execution
# TYPE jvm_classes_loaded_total counter
jvm_classes_loaded_total 17041.0
# HELP jvm_classes_unloaded_total The total number of classes that have been unloaded since the JVM has started execution
# TYPE jvm_classes_unloaded_total counter
jvm_classes_unloaded_total 48.0
# HELP bwce_activity_stats_list BWCE Activity Statictics list
# TYPE bwce_activity_stats_list gauge
# HELP bwce_activity_counter_list BWCE Activity related Counters list
# TYPE bwce_activity_counter_list gauge
# HELP all_activity_events_count BWCE All Activity Events count by State
# TYPE all_activity_events_count counter
all_activity_events_count{StateName="CANCELLED",} 0.0
all_activity_events_count{StateName="COMPLETED",} 0.0
all_activity_events_count{StateName="STARTED",} 0.0
all_activity_events_count{StateName="FAULTED",} 0.0
# HELP activity_events_count BWCE All Activity Events count by Process, Activity State
# TYPE activity_events_count counter
# HELP activity_total_evaltime_count BWCE Activity EvalTime  by Process and Activity
# TYPE activity_total_evaltime_count counter
# HELP activity_total_duration_count BWCE Activity DurationTime by Process and Activity
# TYPE activity_total_duration_count counter
# HELP bwpartner_instance:total_request Total Request for the partner invocation which mapped from the activities
# TYPE bwpartner_instance:total_request counter
# HELP bwpartner_instance:total_duration_ms Total Duration for the partner invocation which mapped from the activities (execution or latency)
# TYPE bwpartner_instance:total_duration_ms counter
# HELP bwce_process_stats BWCE Process Statistics list
# TYPE bwce_process_stats gauge
# HELP bwce_process_counter_list BWCE Process related Counters list
# TYPE bwce_process_counter_list gauge
# HELP all_process_events_count BWCE All Process Events count by State
# TYPE all_process_events_count counter
all_process_events_count{StateName="CANCELLED",} 0.0
all_process_events_count{StateName="COMPLETED",} 0.0
all_process_events_count{StateName="STARTED",} 0.0
all_process_events_count{StateName="FAULTED",} 0.0
# HELP process_events_count BWCE Process Events count by Operation
# TYPE process_events_count counter
# HELP process_duration_seconds_total BWCE Process Events duration by Operation in seconds
# TYPE process_duration_seconds_total counter
# HELP process_duration_milliseconds_total BWCE Process Events duration by Operation in milliseconds
# TYPE process_duration_milliseconds_total counter
# HELP bwdefinitions:partner BWCE Process Events count by Operation
# TYPE bwdefinitions:partner counter
bwdefinitions:partner{ProcessName="t1.module.item.getTransactionData",ActivityName="FTLPublisher",ServiceName="GetCustomer360",OperationName="GetDataOperation",PartnerService="TransactionService",PartnerOperation="GetTransactionsOperation",Location="internal",PartnerMiddleware="MW",} 1.0
bwdefinitions:partner{ProcessName=" t1.module.item.auditProcess",ActivityName="KafkaSendMessage",ServiceName="GetCustomer360",OperationName="GetDataOperation",PartnerService="AuditService",PartnerOperation="AuditOperation",Location="internal",PartnerMiddleware="MW",} 1.0
bwdefinitions:partner{ProcessName="t1.module.item.getCustomerData",ActivityName="JMSRequestReply",ServiceName="GetCustomer360",OperationName="GetDataOperation",PartnerService="CustomerService",PartnerOperation="GetCustomerDetailsOperation",Location="internal",PartnerMiddleware="MW",} 1.0
# HELP bwdefinitions:binding BW Design Time Repository - binding/transport definition
# TYPE bwdefinitions:binding counter
bwdefinitions:binding{ServiceName="GetCustomer360",OperationName="GetDataOperation",ServiceInterface="GetCustomer360:GetDataOperation",Binding="/customer",Transport="HTTP",} 1.0
# HELP bwdefinitions:service BW Design Time Repository - Service definition
# TYPE bwdefinitions:service counter
bwdefinitions:service{ProcessName="t1.module.sub.item.getCustomerData",ServiceName="GetCustomer360",OperationName="GetDataOperation",ServiceInstance="GetCustomer360:GetDataOperation",} 1.0
bwdefinitions:service{ProcessName="t1.module.sub.item.auditProcess",ServiceName="GetCustomer360",OperationName="GetDataOperation",ServiceInstance="GetCustomer360:GetDataOperation",} 1.0
bwdefinitions:service{ProcessName="t1.module.sub.orchestratorSubFlow",ServiceName="GetCustomer360",OperationName="GetDataOperation",ServiceInstance="GetCustomer360:GetDataOperation",} 1.0
bwdefinitions:service{ProcessName="t1.module.Process",ServiceName="GetCustomer360",OperationName="GetDataOperation",ServiceInstance="GetCustomer360:GetDataOperation",} 1.0
# HELP bwdefinitions:gateway BW Design Time Repository - Gateway definition
# TYPE bwdefinitions:gateway counter
bwdefinitions:gateway{ServiceName="GetCustomer360",OperationName="GetDataOperation",ServiceInstance="GetCustomer360:GetDataOperation",Endpoint="bwce-demo-mon-orchestrator-bwce",InteractionType="ISTIO",} 1.0
# HELP process_cpu_seconds_total Total user and system CPU time spent in seconds.
# TYPE process_cpu_seconds_total counter
process_cpu_seconds_total 1956.86
# HELP process_start_time_seconds Start time of the process since unix epoch in seconds.
# TYPE process_start_time_seconds gauge
process_start_time_seconds 1.604712447107E9
# HELP process_open_fds Number of open file descriptors.
# TYPE process_open_fds gauge
process_open_fds 763.0
# HELP process_max_fds Maximum number of open file descriptors.
# TYPE process_max_fds gauge
process_max_fds 1048576.0
# HELP process_virtual_memory_bytes Virtual memory size in bytes.
# TYPE process_virtual_memory_bytes gauge
process_virtual_memory_bytes 3.046207488E9
# HELP process_resident_memory_bytes Resident memory size in bytes.
# TYPE process_resident_memory_bytes gauge
process_resident_memory_bytes 4.2151936E8
# HELP jvm_gc_collection_seconds Time spent in a given JVM garbage collector in seconds.
# TYPE jvm_gc_collection_seconds summary
jvm_gc_collection_seconds_count{gc="G1 Young Generation",} 540.0
jvm_gc_collection_seconds_sum{gc="G1 Young Generation",} 4.754
jvm_gc_collection_seconds_count{gc="G1 Old Generation",} 2.0
jvm_gc_collection_seconds_sum{gc="G1 Old Generation",} 0.563
# HELP jvm_threads_current Current thread count of a JVM
# TYPE jvm_threads_current gauge
jvm_threads_current 98.0
# HELP jvm_threads_daemon Daemon thread count of a JVM
# TYPE jvm_threads_daemon gauge
jvm_threads_daemon 43.0
# HELP jvm_threads_peak Peak thread count of a JVM
# TYPE jvm_threads_peak gauge
jvm_threads_peak 98.0
# HELP jvm_threads_started_total Started thread count of a JVM
# TYPE jvm_threads_started_total counter
jvm_threads_started_total 109.0
# HELP jvm_threads_deadlocked Cycles of JVM-threads that are in deadlock waiting to acquire object monitors or ownable synchronizers
# TYPE jvm_threads_deadlocked gauge
jvm_threads_deadlocked 0.0
# HELP jvm_threads_deadlocked_monitor Cycles of JVM-threads that are in deadlock waiting to acquire object monitors
# TYPE jvm_threads_deadlocked_monitor gauge
jvm_threads_deadlocked_monitor 0.0
So, it can be a 50% of the metric endpoint response the part that I’m not using, so, why I am using disk space that I am paying for to storing it? And this is just for a “critical exporter”, one that I try to use as much information as possible, but think about how many exporters do you have and how much information you use for each of them.
Ok, so now the purpose and the motivation of this post are clear, but what we can do about it?
Discovering the REST API
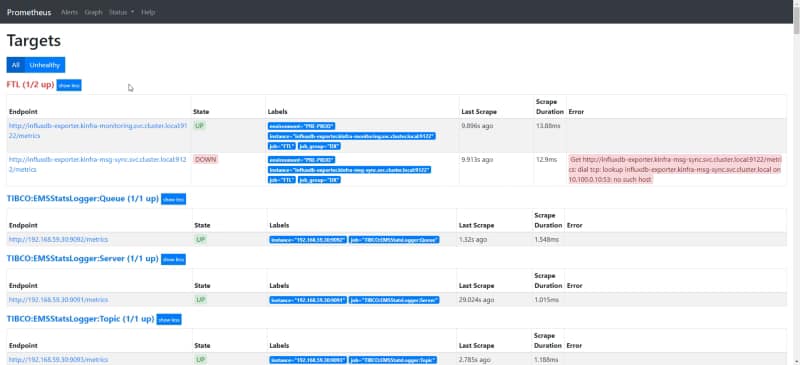
Prometheus has an awesome REST API to expose all the information that you can wish about. If you have ever use the Graphical Interface for Prometheus (shown below) you are using the REST API because this is why is behind it.
Target view of the Prometheus Graphical Interface
We have all the documentation regarding the REST API in the Prometheus official documentation:
But what is this API providing us in terms of the time-series database TSDB that Prometheus is using?
TSDB Admin APIs
We have a specific API to manage the performance of the TSDB database but in order to be able to use it, we need to enable the Admin API. And that is done by providing the following flag where we are launching the Prometheus server --web.enable-admin-api.
If we are using the Prometheus Operator Helm Chart to deploy this we need to use the following item in our values.yaml
## EnableAdminAPI enables Prometheus the administrative HTTP API which includes functionality such as deleting time series.
## This is disabled by default.
## ref: https://prometheus.io/docs/prometheus/latest/querying/api/#tsdb-admin-apis
##    enableAdminAPI: true
We have a lot of options enable when we enable this administrative API but today we are going to focus on a single REST operation that is the “stats”. This is the only method related to TSDB that it doesn’t require to enable the Admin API. This operation, as we can read in the Prometheus documentation, returns the following items:
headStats: This provides the following data about the head block of the TSDB:
numSeries: The number of series.
chunkCount: The number of chunks.
minTime: The current minimum timestamp in milliseconds.
maxTime: The current maximum timestamp in milliseconds.
seriesCountByMetricName: This will provide a list of metrics names and their series count.
labelValueCountByLabelName: This will provide a list of the label names and their value count.
memoryInBytesByLabelName This will provide a list of the label names and memory used in bytes. Memory usage is calculated by adding the length of all values for a given label name.
seriesCountByLabelPair This will provide a list of label value pairs and their series count.
To access to that API we need to hit the following endpoint:
GET /api/v1/status/tsdb
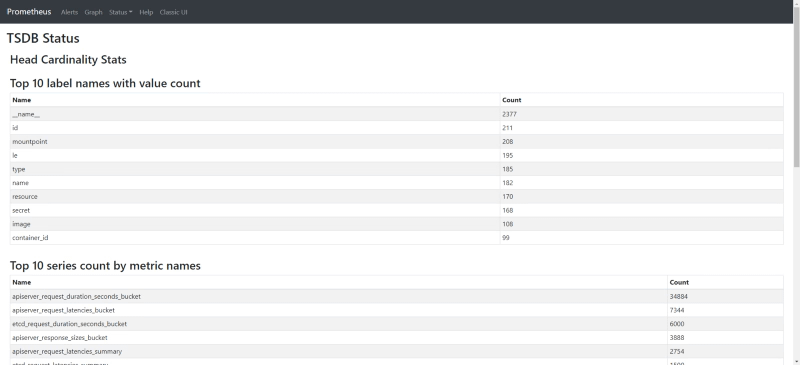
So, when I am doing that in my Prometheus deployment I get something similar to this:
We can also check the same information if we use the new and experimental React User Interface on the following endpoint:
/new/tsdb-status
Graphical Visualization of top 10 series count by metric name in the new Prometheus UI
So, with that, you will get the Top 10 series and labels that are inside your time-series database, so in case, some of them are not useful you can just get rid of them using the normal approaches to drop a series or a label. This is great, but what if all the ones shown here are relevant, what can we do about it?
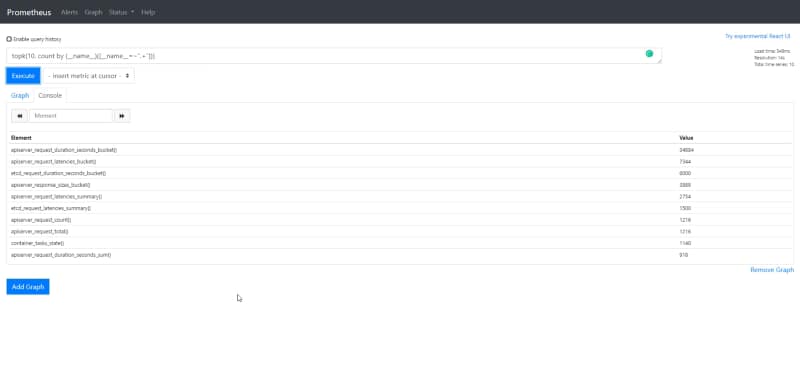
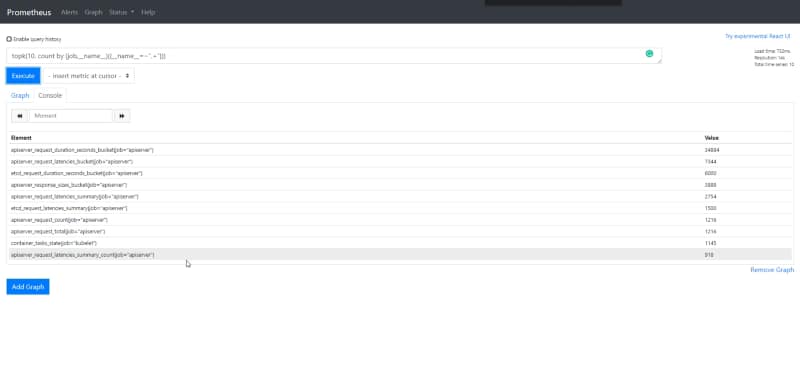
Mmmm, maybe we can use PromQL to monitor this (dogfodding approach). So if we would like to extract the same information but using PromQL we can do it with the following query:
topk(10, count by (__name__)({__name__=~".+"}))
Top 10 of metric series generated and stored in the time series database
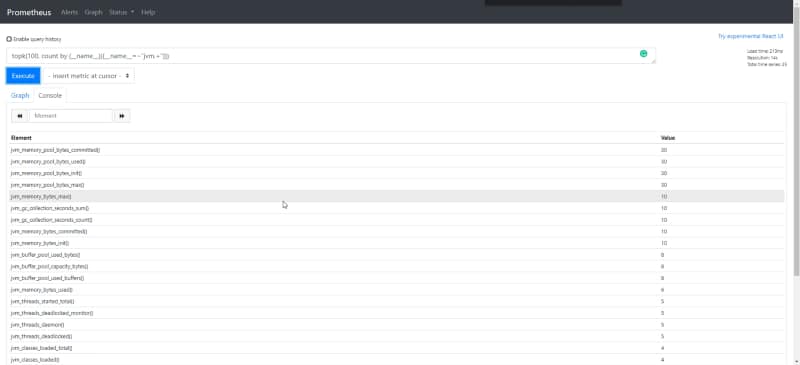
And now we have all the power at my hands. For example, let’s take a look not at the 10 more relevant but the 100 more relevants or any other filter that we need to apply. For example, let’s see the metrics regarding with the JVM that we discussed at the beginning. And we will do that with the following PromQL query:
topk(100, count by (__name__)({__name__=~"jvm.+"}))
Top 100 of metric series regarding to JVM metrics
So we can see that we have at least 150 series regarding to metrics that I am not using at all. But let’s do it even better, let’s take a look at the same but group by job names:
topk(10, count by (job,__name__)({__name__=~".+"}))
Result of checking the top 10 metric series count with the job that is generating them
Prometheus is one of the key systems in nowadays cloud architectures. The second graduate project from the Cloud Native Computing Foundation (CNCF) after Kubernetes itself, and is the monitoring solution for excellence in most of the workloads running on Kubernetes.
If you already have used Prometheus for some time, you know that it relies on a Time series database so Prometheus storage is one of the key elements. Based on their own words from the Prometheus official page:
Storage | Prometheus
An open-source monitoring system with a dimensional data model, flexible query language, efficient time series database and modern alerting approach.
Every time series is uniquely identified by its metric name and optional key-value pairs called labels, and that series is similar to the tables in a relational model. And inside each of those series, we have samples that are similar to the tuples. And each of the samples contains a float value and a milliseconds-precision timestamp.
Default on-disk approach
By default, Prometheus uses a local-storage approach storing all those samples on disk. This data is distributed in different files and folders to group different chunks of data.
So, we have folders to create those groups, and by default, they are a two-hour block and can contain one or more files depending on the amount of data ingested in that period of time as each folder contains all the samples for that specific timeline.
Additionally, each folder also has some kind of metadata files that help locate each of the data files’ metrics.
A file is persistent in a complete manner when the block is over, and before that, it keeps in memory and uses a write-ahead log technical to recover the data in case of a crash of the Prometheus server.
So, at a high-level view, the directory structure of a Prometheus server’s data directory will look something like this:
Remote Storage Integration
Default on-disk storage is good and has some limitations in terms of scalability and durability, even considering the performance improvement of the latest version of the TSDB. So, if we’d like to explore other options to store this data, Prometheus provides a way to integrate with remote storage locations.
It provides an API that allows writing samples that are being ingested into a remote URL and, at the same time, be able to read back sample data for that remote URL as shown in the picture below:
As always in anything related to Prometheus, the number of adapters created using this pattern is huge, and it can be seen in the following link in detail:
Integrations | Prometheus
An open-source monitoring system with a dimensional data model, flexible query language, efficient time series database and modern alerting approach.
Summary
Knowing how prometheus storage works is critical to understand how we can optimize their usage to improve the performance of our monitoring solution and provide a cost-efficient deployment.
In the following posts, we’re going to cover how we can optimize the usage of this storage layer, making sure that only the metrics and samples that are important to use are being stored, and also how to analyze which metrics are the ones used most of the time-series database to be able to take good decision about which metrics should be dropped and which ones should be kept.
Security is the most relevant topic in modern architecture. It needs to be handled from all different perspectives. Having a single team auditing the platforms and the developments that we built is not enough.
The introduction of DevSecOps as the new normal, including the security teams and policies being part of the development process to avoid security becoming a blocker of innovation and make sure that the artifacts we deploy are secured, have made this clear.
Docker image scanning is one of the most important topics we can cover regarding the container images to know that all the internal components that are part of the image are safe from vulnerabilities. We usually rely on some systems to do so.
I wrote an article regarding the usage of one of the most relevant options (Harbor) from the open source world to do this job.
And this is also being done by different Docker repositories from cloud providers like Amazon ECR as of this year. But why do we need to wait until we push the images to an external Docker registry? Why can’t we do it in our local environment?
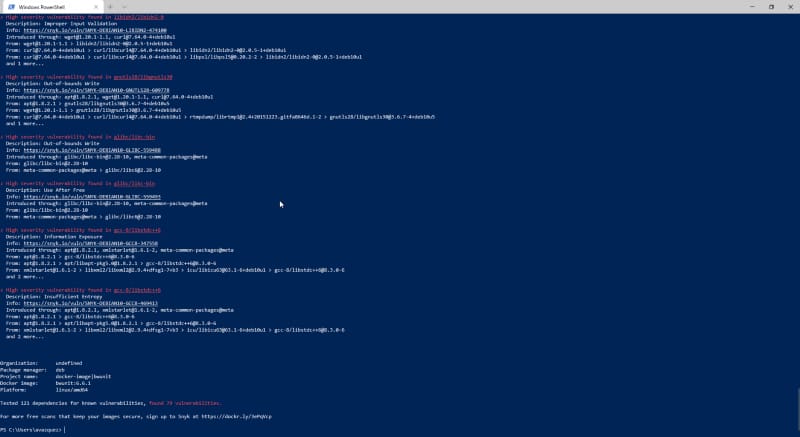
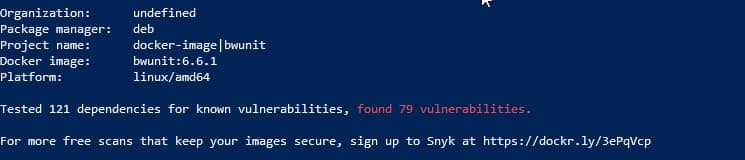
Now we can. Version 2.5.0.1 of the Docker engine also includes the Snyk components needed to inspect the Docker images directly from the command line:
So, let’s start. Let’s open a new terminal and type the following command:
docker scan <image-name>
As soon as we type this, the command will tell us that this scanning process will use Snyk to do that and we need to authorize access to those services to do the scanning process.
After that, we get a list of all the vulnerabilities detected, as you can see in the picture below:
Vulnerability scanning using your local Docker client
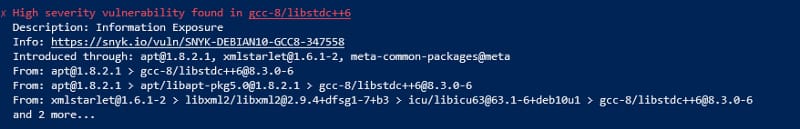
For each of the vulnerabilities, you can see the following data:
Detailed information provided for each of the vulnerabilities detected
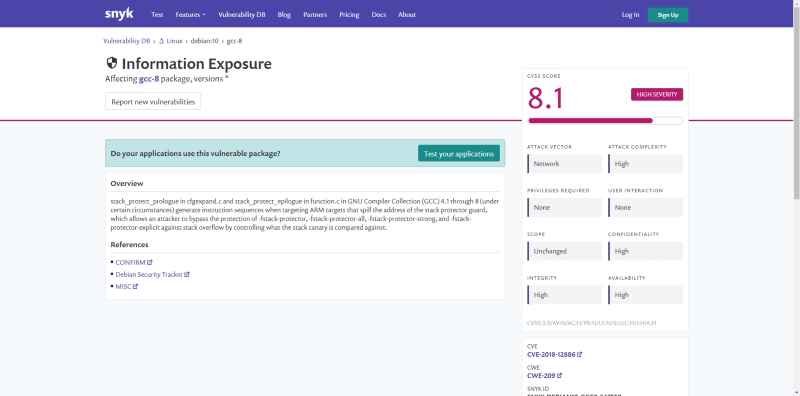
We get the library with the vulnerability, the severity level, and a short description of it. If you need more details, you can also check the provided URL that is linked to a description page for that vulnerability:
Vulnerability detailed page from snyk
Finally, it also provides the sources introducing this library in your image so this can be solved quickly.
It provides a high-level view of the whole image too, as you can see here:
Overview of your Docker images with all the vulnerabilities detected
So, now you don’t have any excuse to not have all your images safe and secure before pushing to your local repository. Let’s do it!
Containerization is the new normal. We are all aware of that. All the new versions of the corporate software and all the open-source projects are including the options to use a docker image to run their software.
Probably you already have been doing your tests or even running in production workloads based on docker images that you have built yourself. If that is the case, you probably know one of the big challenges when you’re doing this kind of task: How to optimize the size of the image you generate?
One of the main reasons the docker image can be so big is because they are built following a layered concept. And that means that each of the images is being created as the addition of layers, each associated with the different commands you have in your Dockerfile.
Graphical explanation of how a Docker image is compounded.
Use dive to analyze the size of your images
dive is an open-source project that provides a detailed view of the composition of your docker images. It works as a command-line interface application that has a great view of the content of the layers, as you can see in the picture below:
Dive execution of a BusinessWorks Container Edition image
The tool follows an n-curses interface (if you are old enough to remember how tools were before Graphical User Interfaces was a thing; it should look familiar) and has these main features:
This tool will provide the list of layers in the top-left of the screen and the size associated with each of them.
Provides general stats about image efficiency (a percentage value), a potential view of the wasted size, and the image’s total size.
For each of the layers selected, you get a view on the file system for this view with the data of each folder’s size.
Also, get a view of the bigger elements and the number of replication of these objects.
Now, you have a tool that will help you first to know how your image is built and get performance data of each of the tweaks that you do to improve that size. So, let’s start with the tricks.
1.- Clean your image!
This first is quite obvious, but that doesn’t mean that it is not important. Usually, when you create a Docker image, you follow the same pattern:
You declare a base image to leverage on.
You add resources to do some work.
You do some work.
Usually, we forget an additional step: To clean the added resources when they are not needed anymore! So, it is important to be sure that we remove each of the files that we don’t need anymore.
This also applies to other components like the apt cache when we are installing a new package that we need or any temporary folder that we need to perform an installation or some work to build the image.
2.- Be careful about how you create your Dockerfile
As we already mentioned, each of the commands that we declare in our Dockerfile generates a new layer. So, it is important to be very careful with the lines that we have in the Dockerfile. Even if this is a tradeoff regarding the readability of the Dockerfile, it is important to try to merge commands in the same RUN primitive to make sure we are not creating additional layers.
Sample for a Dockerfile with merged commands
You can also use Docker linters like Hadolint that will help you with this and other anti-patterns that you should avoid when you are creating a Dockerfile.
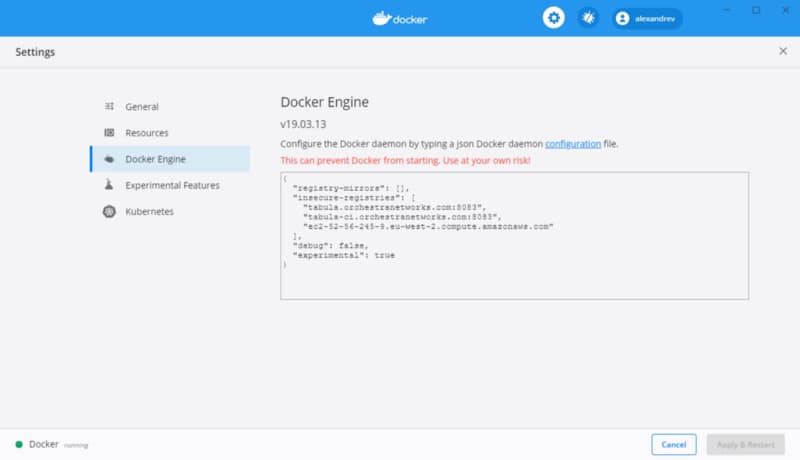
3.- Go for docker build — squash
The latest versions of the Docker engine provide a new option when you build your images to create with the minimized size squashing of the intermediate layers that can be created as part of the Dockerfile creation process.
That works, providing a new flag when you are doing the build of your image. So, instead of doing this:
To be able to use this option, you should enable the experimental features on your Docker Engine. To do that, you need to enable that in your daemon.json file and restart the engine. If you are using Docker for Windows or Docker for Mac, you can do it using the user interface as shown below:
Summary
These tweaks will help you make your Docker images thinner and much more pleasant the process of pulling and pushing and, at the same time, even saving some money regarding the storage of the images in the repository of your choice. And not only for you but for many others that can leverage the work that you are doing. So think about yourself but also think about the community.
In the previous post of these series regarding how to set up a Hybrid EKS cluster making use of both traditional EC2 machines but also serverless options using Fargate, we were able to create the EKS cluster with both deployment fashion available. If you didn’t take a look at it yet, do it now!
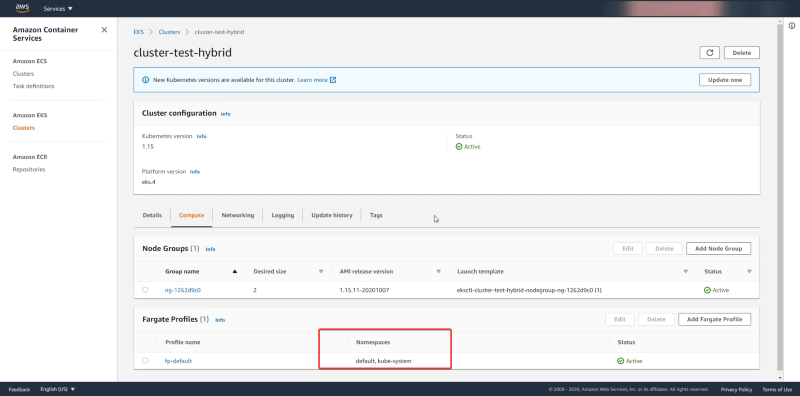
At that point, we have an empty cluster with everything ready to deploy new workloads, but we still need to configure a few things before doing the deployment. First thing is to decide which workloads are going to be deployed using the serverless option and which ones will use the traditional EC2 option.
By default, all the workloads deployed on the namespaces default and kube-system as you can see in the picture below form the AWS Console:
So that means that all workloads from the default namespace and the kube-system namespace will be deployed in a serverless fashion. If that’s what you’d like perfect. But sometimes you’d like to start with a delimited set of namespaces where you’d like to use the serverless option and rely on the traditional deployment.
We can check that same information using eksctl and to do that we need to type the following command:
eksctl get fargateprofile --cluster cluster-test-hybrid -o yaml
The output of that command should be something similar of the information that we can see in the AWS Console:
NOTE: If you don’t remember the name of your cluster you just need to type the command eksctl get clusters
So, this is what we’re going to do and to do that the first thing we need to do is to create a new namespace named “serverless” that is going to hold our serverless deployment and to do that we use a kubectl command as follows:
kubectl create namespace serverless
And now, we just need to create a new fargate profile that is going to replace the one that we have at the moment and to do that we need to make use again of eksctl to handle that job:
NOTE: We also can use not only namespace to limit the scope of our serverless deployment but also tags, so we can have in the same namespace workloads that are deployed using traditional deployment and others using serverless fashion. That will give us all the posibilities to design your cluster as you wish. To do that we will append the argument labels in a key=value fashion.
And we will get an output similar to this:
[ℹ] creating Fargate profile “fp-serverless-profile” on EKS cluster “cluster-test-hybrid”
[ℹ] created Fargate profile “fp-serverless-profile” on EKS cluster “cluster-test-hybrid”
If now we check the number of profiles that we have available we should get two profiles handling three namespaces (the ones that are managed by the default profile — default and kube-system — and the one — serverless — handled by the one we just created now)
We just will use the following command to delete the default profile:
And the output of that command should be similar to this one:
[ℹ] deleted Fargate profile “fp-default” on EKS cluster “cluster-test-hybrid”
And after that, we have now ready our cluster with limited scope for serverless deployments. In the next post of the series, we will just deploy workloads on both fashions to see the difference between them. So, don’t miss the updates regarding this series making sure that you follow my posts, and if you’d like the article, or you have some doubts or comments, please leave your feedback using the comments below!