Observability in Polyglot Microservice Architectures: Tracing Without Friction

Observability in Polyglot Microservice Architectures: Tracing Without Friction

Learn how to manage observability requirements as part of your microservice ecosystem

“May you live in interesting times” is the English translation of the Chinese curse, and this couldn’t be more true as a description of the times that we’re living regarding our application architecture and application development.

All the changes from the cloud-native approach, including all the new technologies that come with it like containers, microservices, API, DevOps, and so on has transformed the situation entirely for any architecture, developer, or system administration.

It’s something similar if you went to bed in 2003, and you wake up in 2020 all the changes, all the new philosophies, but also all the unique challenges that come with the changes and new capabilities are things that we need to deal with today.

I think we all can agree the present is polyglot in terms of application development. Today is not expected for any big company or enterprise to find an available technology, an available language to support all their in-house products. Today we all follow and agree on the “the right tool for the right job principle” to try to create our toolset of technologies that we are going to use to solve different use cases or patterns that you need to face.

But that agreement and movement also come with its challenge regarding things that we usually don’t think about like Tracing and Observability in general.

When we use a single technology, everything is more straightforward. To define a common strategy to trace your end to end flows is easy; you only need to embed the logic into your common development framework or library all your developments are using. Probably define a typical header architecture with all the data that you need to be able to effectively trace all the requests and define a standard protocol to send all those traces to a standard system that can store and correlate all of them and explain the end to end flow. But try to move that to a polyglot ecosystem: Should I write my framework or library for each language or technology I’d need to use, or I can also use in the future? Does that make sense?

But not only that, should I slow the adoption of a new technology that can quickly help the business because I need to provide from a shared team this kind of standard components? That is the best case that I have enough people that know how the internals of my framework work and have the skills in all the languages that we’re adopting to be able to do it quickly and in an efficient way. It seems unlikely, right?

So, to new challenges also new solutions. I’m already have been talking about Service Mesh regarding the capabilities that provide from a communication perspective, and if you don’t remember you can take a look at those posts:

But it also provides capabilities from other perspectives and Tracing, and Observability is one of them. Because when we cannot include those features in any technology, we need to use, we can do it in a general technology that is supported by all of them, and that’s the case with Service Mesh.

As Service Mesh is the standard way to communicate synchronously, your microservices in an east-west communication fashion covering the service-to-service communication. So, if you’re able to include in that component also the tracing capability, you can have an end-to-end tracing without needed to implement anything in each of the different technologies that you can use to implement the logic that you need, so, you’ve been changing from Figure A to Figure B in the picture below:

Observability in Polyglot Microservice Architectures: Tracing Without Friction
In-App Tracing logic implementation vs. Service Mesh Tracing Support

And that what most of the Service Mesh technologies are doing. For example, Istio, as one of the default choices when it comes to Service Mesh, includes an implementation of the OpenTracing standard that allows integration with any tool that supports the standard to be able to collect all the tracing information for any technology that is used to communicate across the mesh.

So, that mind-change allows us to easily integrates different technologies without needed any exceptional support of those standards for any specific technology. Does that mean that the implementation of those standards for those technologies is not required? Not at all, that is still relevant, because the ones that also support those standards can provide even more insights. After all, the Service Mesh only knows part of the information that is the flow that’s happening outside of each technology. It’s something similar to a black-box approach. But also adding the support for each technology to the same standard provides an additional white-box approach as you can see graphically in the image below:

Observability in Polyglot Microservice Architectures: Tracing Without Friction
Merging White Box Tracing Data and Black Box Tracing Data

We already talked about the compliance of some technologies with the OpenTracing standard like TIBCO BusinessWorks Container Edition that you can remember it here:

So, also, the support from these technologies of the industry standards is needed and even a competitive advantage because without needing to develop your tracing framework, you’re able to achieve a Complete Tracing Data approach additional to that is already provided by the Service Mesh level itself.

Rename Prometheus Metrics Using metric_relabel_configs (Change Metric Names Safely)

Rename Prometheus Metrics Using metric_relabel_configs (Change Metric Names Safely)

Find a way to re-define and re-organize the name of your Prometheus metrics to meet your requirements

Prometheus has become the new standard when we’re talking about monitoring our new modern application architecture, and we need to make sure we know all about its options to make sure we can get the best out of it. I’ve been using it for some time until I realized about a feature that I was desperate to know how to do, but I couldn’t find anywhere clearly define. So as I didn’t found it easily, I thought about writing a small article to show you how to do it without needed to spend the same time as I did.

We have plenty of information about how to configure Prometheus and use some of the usual configuration plugins, as we can see on its official webpage [1]. Even I already write about some configuration and using it for several purposes, as you can see also in other posts [2][3][4].

One of these configuration plugins is about relabeling, and this is a great thing. We have that each of the exporters can have its labels and meaning for those, and when you try to manage different technologies or components makes complex that all of them match together even if all of them follow the naming convention that Prometheus has [5].

But I had this situation, and I’m sure you have gone or will go towards that as well, that I have similar metrics for different technologies that for me are the same, and I need to keep them with the same name, but as they belong to other technologies they are not. So I need to find a way to rename the metric, and the great thing is that you can do that.

To do that, you just need to do a metric_relabel configuration. This configuration applies to relabel (as the name already indicates) labels of your prometheus metrics in this case before being ingested but also allow us to use some notable terms to do different things, and one of these notable terms is __name__. __name__ is a particular label that will enable you to rename your prometheus metrics before being ingested in the Prometheus Timeseries Database. And after that point, this will be as it will have that name since the beginning.

How to use that is relatively easy, is as any other relabel process, and I’d like to show you a sample about how to do it.

- source_labels: [__name__]
regex:  'jvm_threads_current'
target_label: __name__
replacement: 'process_thread_count'

Here it is a simple sample to show how we can rename a metric name jvm_threads_current to count the threads inside the JVM machine to do it more generic to be able to include the threads for the process in a process_thread_count prometheus metrics that we can use now as it was the original name.


References

[1] Prometheus: Configuration https://prometheus.io/docs/prometheus/latest/configuration/configuration/

[2] https://medium.com/@alexandrev/prometheus-monitoring-in-tibco-cloud-integration-96a6811416ce

[3] https://medium.com/@alexandrev/prometheus-monitoring-for-microservices-using-tibco-772018d093c4

[4] https://medium.com/@alexandrev/kubernetes-service-discovery-for-prometheus-fcab74237db6

[5] Prometheus: Metric and Label Naming https://prometheus.io/docs/practices/naming/

📚 Want to dive deeper into Kubernetes? This article is part of our comprehensive Kubernetes Architecture Patterns guide, where you’ll find all fundamental and advanced concepts explained step by step.

Prometheus Monitoring in TIBCO Cloud Integration

Prometheus Monitoring in TIBCO Cloud Integration

In previous posts, I’ve explained how to integrate TIBCO BusinessWorks 6.x / BusinessWorks Container Edition (BWCE) applications with Prometheus, one of the most popular monitoring systems for cloud layers. Prometheus is one of the most widely used solutions to monitor your microservices inside a Kubernetes cluster. In this post, I will explain steps to leverage Prometheus for integrating with applications running on TIBCO Cloud Integration (TCI).

TCI is TIBCO’s iPaaS and primarily hides the application management complexity of an app from users. You need your packaged application (a.k.a EAR) and manifest.json — both generated by the product to simply deploy the application.

Isn’t it magical? Yes, it is! As explained in my previous post related to Prometheus integration with BWCE, which allows you to customize your base images, TCI allows integration with Prometheus in a slightly different manner. Let’s walk through the steps.

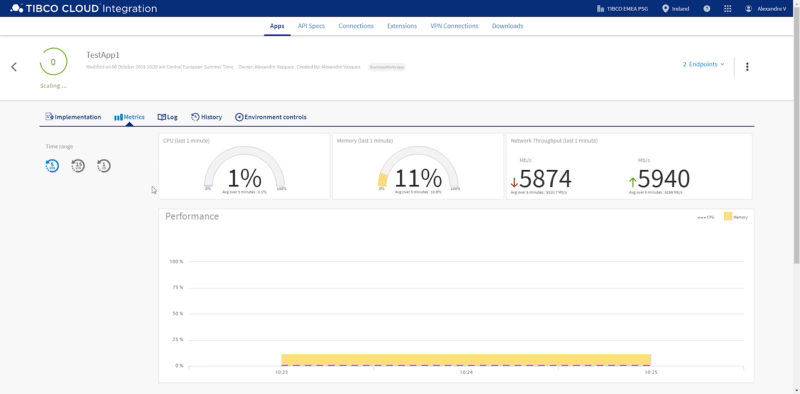
TCI has its own embedded monitoring tools (shown below) to provide insights into Memory and CPU utilization, plus network throughput, which is very useful.

While the monitoring metrics provided out-of-the-box by TCI are sufficient for most scenarios, there are hybrid connectivity use-cases (application running on-prem and microservices running on your own cluster that could be on a private or public cloud) that might require a unified single-pane view of monitoring.

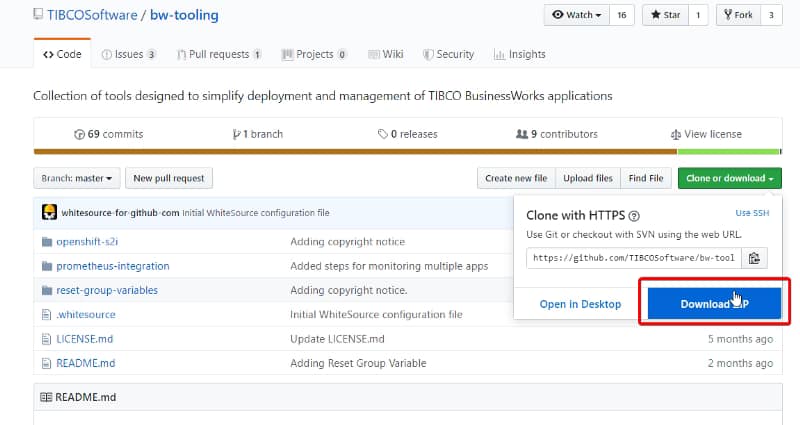
Step one is to import the Prometheus plugin from the current GitHub location into your BusinessStudio workspace. To do that, you just need to clone the GitHub Repository available here: https://github.com/TIBCOSoftware/bw-tooling OR https://github.com/alexandrev/bw-tooling

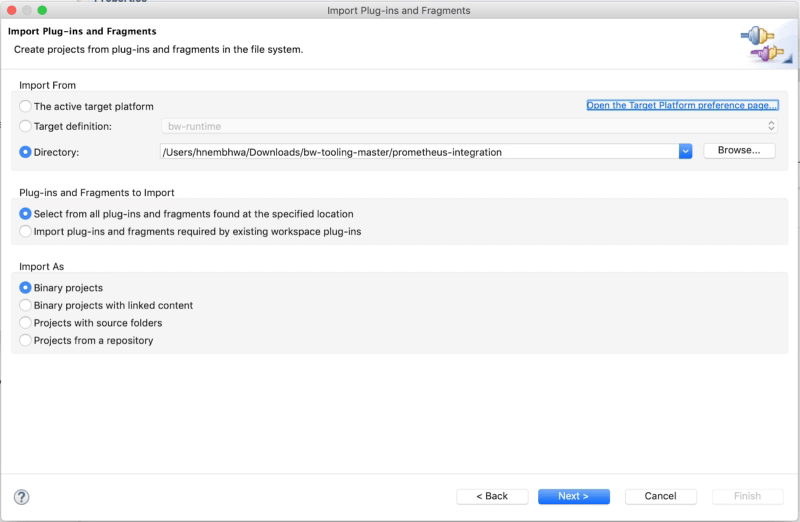
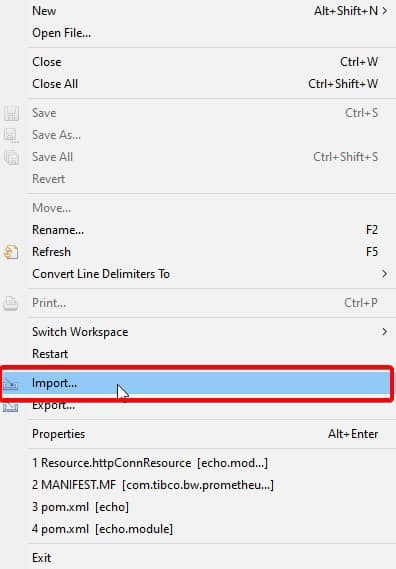
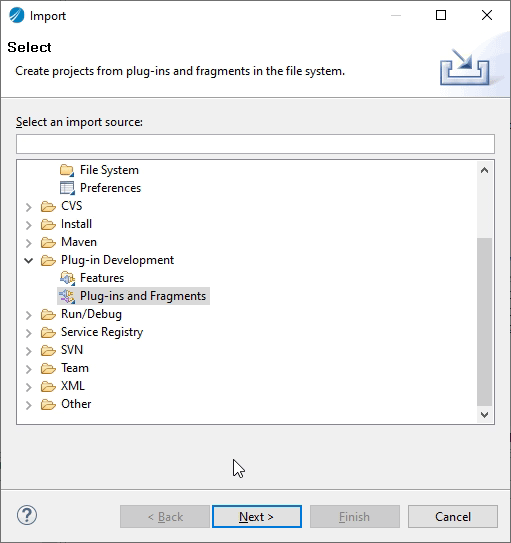
Import the Prometheus plugin by choosing Import → Plug-ins and Fragments option and specifying the directory downloaded from the above mentioned GitHub location. (shown below)

Prometheus Monitoring in TIBCO Cloud Integration

Step two involves adding the Prometheus module previously imported to the specific application as shown below:

Prometheus Monitoring in TIBCO Cloud Integration

Step three is just to build the EAR file along with manifest.json.

NOTE: If the EAR doesn’t get generated once you add the Prometheus plugin, please follow the below steps:

  • Export the project with the Prometheus module to a zip file.
  • Remove the Prometheus project from the workspace.
  • Import the project from the zip file generated before.

Before you deploy the BW application on TCI, we need to enable an additional port on TCI to scrape the Prometheus metrics.

Step four Updating manifest.json file.

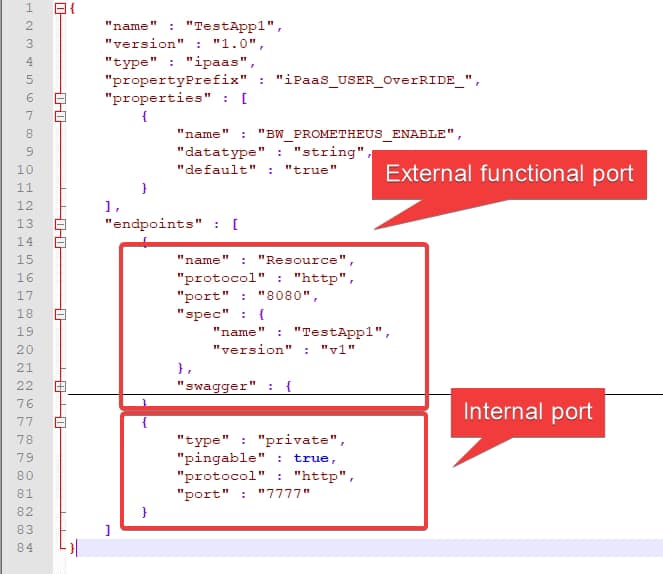
By default, a TCI app using the manifest.json file only exposes one port to be consumed from outside (related to functional services) and the other to be used internally for health checks.

Prometheus Monitoring in TIBCO Cloud Integration

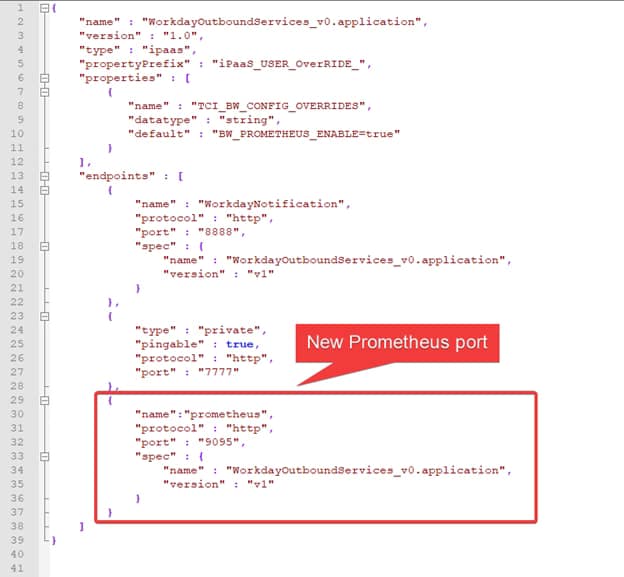
For Prometheus integration with TCI, we need an additional port listening on 9095, so Prometheus server can access the metrics endpoints to scrape the required metrics for our TCI application.

Note: This document does not cover the details on setting the Prometheus server (it is NOT needed for this PoC) but you can find the relevant information on https://prometheus.io/docs/prometheus/latest/installation/

We need to slightly modify the generated manifest.json file (of BW app) to expose an additional port, 9095 (shown below) .

Prometheus Monitoring in TIBCO Cloud Integration

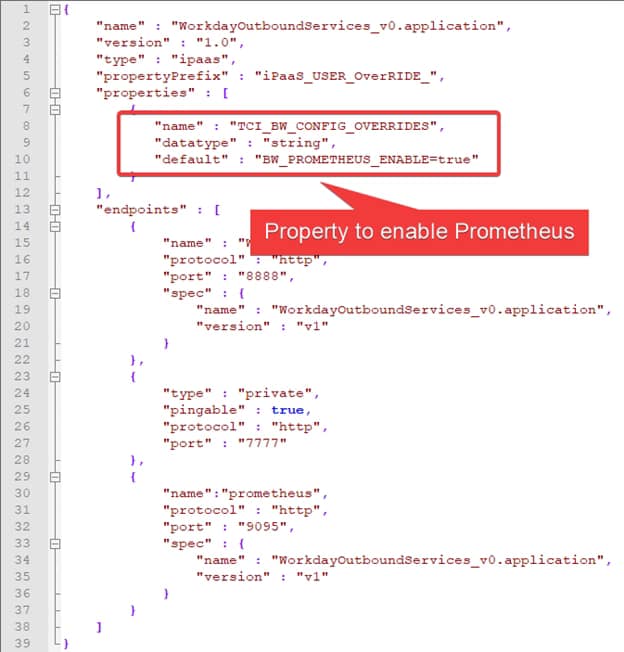
Also, to tell TCI that we want to enable Prometheus endpoint we need to set a property in the manifest.json file. The property is TCI_BW_CONFIG_OVERRIDES and provide the following value: BW_PROMETHEUS_ENABLE=true, as shown below:

Prometheus Monitoring in TIBCO Cloud Integration

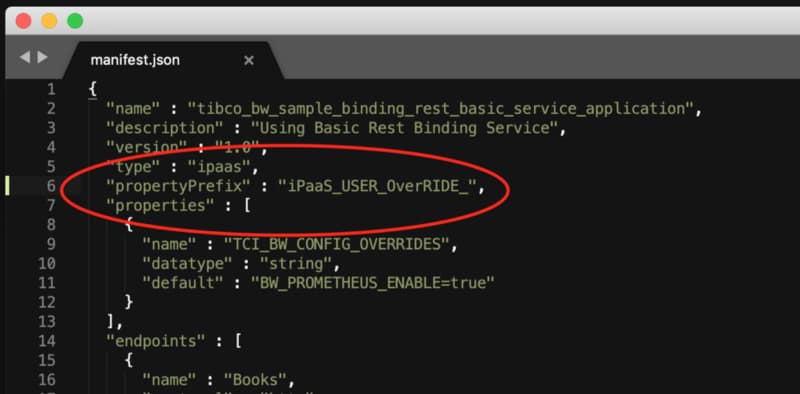
We also need to add an additional line (propertyPrefix) in the manifest.json file as shown below.

Prometheus Monitoring in TIBCO Cloud Integration

Now, we are ready to deploy the BW app on TCI and once it is deployed we can see there are two endpoints

Prometheus Monitoring in TIBCO Cloud Integration

If we expand the Endpoints options on the right (shown above), you can see that one of them is named “prometheus” and that’s our Prometheus metrics endpoint:

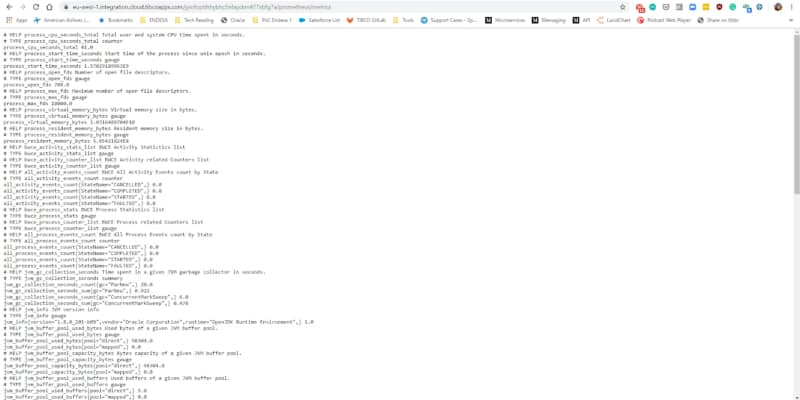
Just copy the prometheus URL and append it with /metrics (URL in the below snapshot) — this will display the Prometheus metrics for the specific BW app deployed on TCI.

Note: appending with /metrics is not compulsory, the as-is URL for Prometheus endpoint will also work.

Prometheus Monitoring in TIBCO Cloud Integration

In the list you will find the following kind of metrics to be able to create the most incredible dashboards and analysis based on that kind of information:

  • JVM metrics around memory used, GC performance and thread pools counts
  • CPU usage by the application
  • Process and Activity execution counts by Status (Started, Completed, Failed, Scheduled..)
  • Duration by Activity and Process.

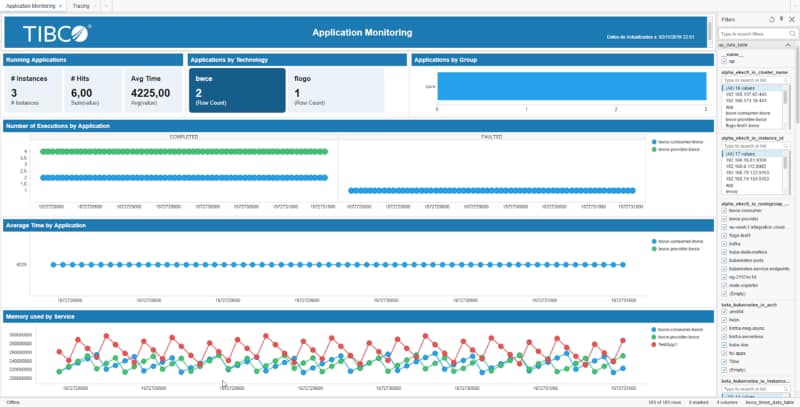
With all this available the information you can create dashboards similar to the one shown below, in this case using Spotfire as the Dashboard tool:

Prometheus Monitoring in TIBCO Cloud Integration

But you can also integrate those metrics with Grafana or any other tool that could read data from Prometheus time-series database.

Prometheus Monitoring in TIBCO Cloud Integration

Detect Performance Bottlenecks in TIBCO BusinessWorks Container Edition Using Statistics

Detect Performance Bottlenecks in TIBCO BusinessWorks Container Edition Using Statistics

Usually, when you’re developing or running your container application you will get to a moment when something goes wrong. But not in a way you can solve with your logging system and with testing.

A moment when there is some bottleneck, something that is not performing as well as you want, and you’d like to take a look inside. And that’s what we’re going to do. We’re going to watch inside.

Because our BusinessWorks Container Edition provides so great features to do it that you need to use it into your favor because you’re going to thank me for the rest of your life. So, I don’t want to spend one more minute about this. I’d like to start telling you right now.

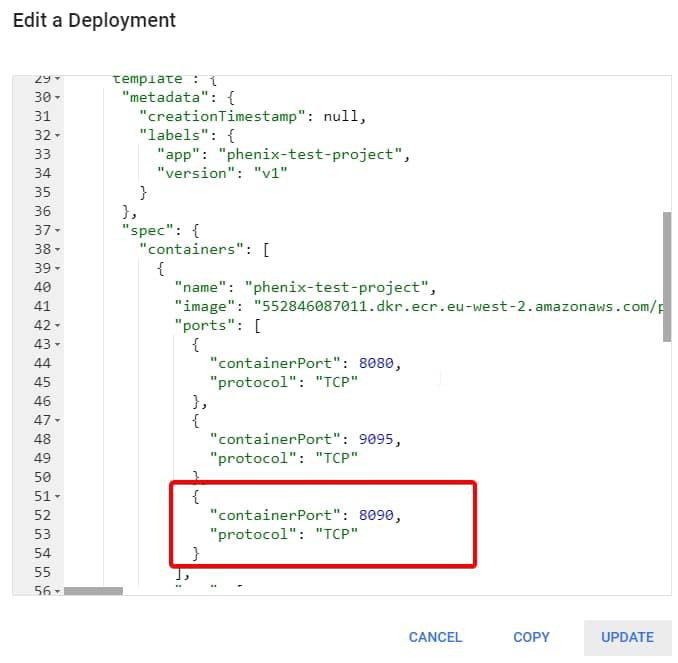
The first thing we need to do, we need to go inside the OSGi console from the container. So, the first thing we do is to expose the 8090 port as you can see in the picture below

Detect Performance Bottlenecks in TIBCO BusinessWorks Container Edition Using Statistics

Now, we can expose that port to your host, using the port-forward command

kubectl port-forward deploy/phenix-test-project-v1 8090:8090

And then we can execute an HTTP Request to execute any info using commands like this:

curl -v http://localhost:8090/bw/framework.json/osgi?command=<command>

And we’re are going to execute first the activation of the process statistics like this:

curl -v http://localhost:8090/bw/framework.json/osgi?command=startpsc
Detect Performance Bottlenecks in TIBCO BusinessWorks Container Edition Using Statistics

And as you can see it says that statistics has been enabled for echo application, so using that application name we’re going to gather the statistics at the level

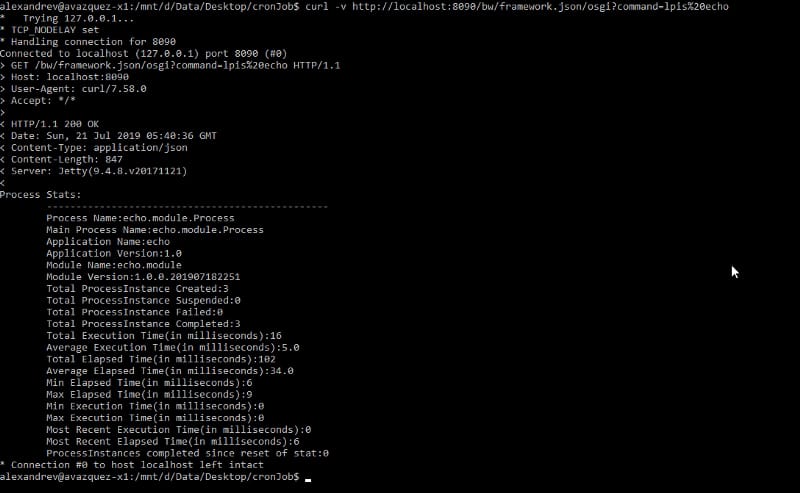
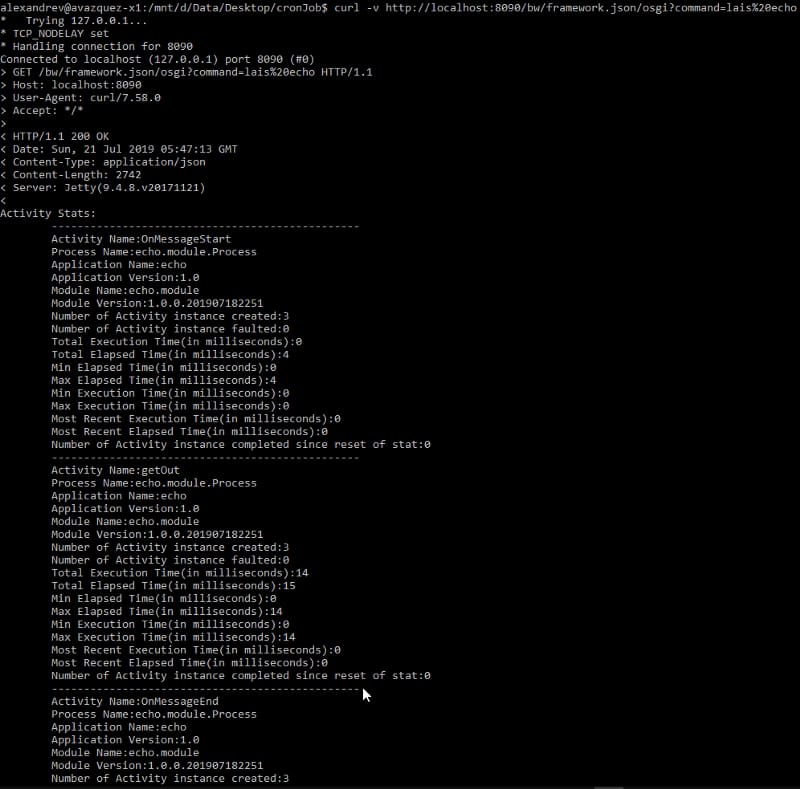
curl -v http://localhost:8090/bw/framework.json/osgi?command=lpis%20echo
Detect Performance Bottlenecks in TIBCO BusinessWorks Container Edition Using Statistics

And you can see the statistics at the process level where you can see the following metrics:

  • Process metadata (name, parent process and version)
  • Total instance by status (create, suspended, failed and executed)
  • Execution time (total, average, min, max, most recent)
  • Elapsed time (total, average, min, max, most recent)

And we can get the statistics at the activity level:

Detect Performance Bottlenecks in TIBCO BusinessWorks Container Edition Using Statistics

And with that, you can detect any bottleneck you’re facing into your application and also be sure which activity or which process is responsible for it. So you can solve it in a quick way.

Have fun and use the tools at your disposal!

Kubernetes Service Discovery for Prometheus: Dynamic Scraping the Right Way

Kubernetes Service Discovery for Prometheus: Dynamic Scraping the Right Way

In previous posts, we described how to set up Prometheus to work with your TIBCO BusinessWorks Container Edition apps, and you can read more about it here.

In that post, we described that there were several ways to update Prometheus about the services that ready to monitor. And we choose the most simple at that moment that was the static_config configuration which means:

Don’t worry Prometheus, I’ll let you know the IP you need to monitor and you don’t need to worry about anything else.

And this is useful for a quick test in a local environment when you want to test quickly your Prometheus set up or you want to work in the Grafana part to design the best possible dashboard to handle your need.

But, this is not too useful for a real production environment, even more, when we’re talking about a Kubernetes cluster when services are going up & down continuously over time. So, to solve this situation Prometheus allows us to define a different kind of ways to perform this “service discovery” approach. In the official documentation for Prometheus, we can read a lot about the different service discovery techniques but at a high level these are the main service discovery techniques available:

  • azure_sd_configs: Azure Service Discovery
  • consul_sd_configs: Consul Service Discovery
  • dns_sd_configs: DNS Service Discovery
  • ec2_sd_configs: EC2 Service Discovery
  • openstack_sd_configs: OpenStack Service Discovery
  • file_sd_configs: File Service Discovery
  • gce_sd_configs: GCE Service Discovery
  • kubernetes_sd_configs: Kubernetes Service Discovery
  • marathon_sd_configs: Marathon Service Discovery
  • nerve_sd_configs: AirBnB’s Nerve Service Discovery
  • serverset_sd_configs: Zookeeper Serverset Service Discovery
  • triton_sd_configs: Triton Service Discovery
  • static_config: Static IP/DNS for the configuration. No Service Discovery.

And even, it all these options are not enough for you and need something more specific you have an API available to extend the Prometheus capabilities and create your own Service Discovery technique. You can find more info about it here:

But this is not our case, for us, the Kubernetes Service Discovery is the right choice for our approach. So, we’re going to change the static configuration we had in the previous post:

- job_name: 'bwdockermonitoring'
  honor_labels: true
  static_configs:
    - targets: ['phenix-test-project-svc.default.svc.cluster.local:9095']
      labels:
        group: 'prod'

For this Kubernetes configuration

- job_name: 'bwce-metrics'
  scrape_interval: 5s
  metrics_path: /metrics/
  scheme: http
  kubernetes_sd_configs:
  - role: endpoints
    namespaces:
      names:
      - default
  relabel_configs:
  - source_labels: [__meta_kubernetes_service_label_app]
    separator: ;
    regex: (.*)
    replacement: $1
    action: keep
  - source_labels: [__meta_kubernetes_endpoint_port_name]
    separator: ;
    regex: prom
    replacement: $1
    action: keep
  - source_labels: [__meta_kubernetes_namespace]
    separator: ;
    regex: (.*)
    target_label: namespace
    replacement: $1
    action: replace
  - source_labels: [__meta_kubernetes_pod_name]
    separator: ;
    regex: (.*)
    target_label: pod
    replacement: $1
    action: replace
  - source_labels: [__meta_kubernetes_service_name]
    separator: ;
    regex: (.*)
    target_label: service
    replacement: $1
    action: replace
  - source_labels: [__meta_kubernetes_service_name]
    separator: ;
    regex: (.*)
    target_label: job
    replacement: 1
    action: replace
  - separator: ;
    regex: (.*)
    target_label: endpoint
    replacement: $1
    action: replace

As you can see this is quite more complex than the previous configuration but it is not as complex as you can think at first glance, let’s review it by different parts.

- role: endpoints
    namespaces:
      names:
      - default

It says that we’re going to use role for endpoints that are created under the default namespace and we’re going to specify the changes we need to do to find the metrics endpoints for Prometheus.

scrape_interval: 5s
 metrics_path: /metrics/
 scheme: http

This says that we’re going to execute the scrape process in a 5 seconds interval, using http on the path /metrics/

And then, we have a relabel_config section:

- source_labels: [__meta_kubernetes_service_label_app]
    separator: ;
    regex: (.*)
    replacement: $1
    action: keep
  - source_labels: [__meta_kubernetes_endpoint_port_name]
    separator: ;
    regex: prom
    replacement: $1
    action: keep

That means that we’d like to keep that label for prometheus:

- source_labels: [__meta_kubernetes_namespace]
    separator: ;
    regex: (.*)
    target_label: namespace
    replacement: $1
    action: replace
  - source_labels: [__meta_kubernetes_pod_name]
    separator: ;
    regex: (.*)
    target_label: pod
    replacement: $1
    action: replace
  - source_labels: [__meta_kubernetes_service_name]
    separator: ;
    regex: (.*)
    target_label: service
    replacement: $1
    action: replace
  - source_labels: [__meta_kubernetes_service_name]
    separator: ;
    regex: (.*)
    target_label: job
    replacement: 1
    action: replace
  - separator: ;
    regex: (.*)
    target_label: endpoint
    replacement: $1
    action: replace

That means that we want to do a replace of the label value and we can do several things:

  • Rename the label name using the target_label to set the name of the final label that we’re going to create based on the source_labels.
  • Replace the value using the regex parameter to define the regular expression for the original value and the replacement parameter that is going to express the changes that we want to do to this value.

So, now after applying this configuration when we deploy a new application in our Kubernetes cluster, like the project that we can see here:

Automatically we’re going to see an additional target on our job-name configuration “bwce-metrics”

📚 Want to dive deeper into Kubernetes? This article is part of our comprehensive Kubernetes Architecture Patterns guide, where you’ll find all fundamental and advanced concepts explained step by step.

Prometheus TIBCO Monitoring for Containers: Quick and Simple in 5 Minutes!

Prometheus TIBCO Monitoring for Containers: Quick and Simple in 5 Minutes!

Prometheus is becoming the new standard for Kubernetes monitoring and today we are going to cover how we can do Prometheus TIBCO monitoring in Kubernetes.

This article is part of my comprehensive TIBCO Integration Platform Guide where you can find more patterns and best practices for TIBCO integration platforms.

We’re living in a world with constant changes and this is even more true in the Enterprise Application world. I’ll not spend much time talking about things you already know, but just say that the microservices architecture approach and the PaaS solutions have been a game-changer for all enterprise integration technologies.

This time I’d like to talk about monitoring and the integration capabilities we have of using Prometheus to monitor our microservices developed under TIBCO technology. I don’t like to spend too much time either talking about what Prometheus is, as you probably already know, but in a summary, this is an open-source distributed monitoring platform that has been the second project released by the Cloud Native Computing Foundation (after Kubernetes itself) and that has been established as a de-facto industry standard for monitoring K8S clusters (alongside with other options in the market like InfluxDB and so on).

Prometheus has a lot of great features, but one of them is that it has connectors for almost everything and that’s very important today because it is so complicated/unwanted/unusual to define a platform with a single product for the PaaS layer. So today, I want to show you how to monitor your TIBCO BusinessWorks Container Edition applications using Prometheus.

Most of the info I’m going to share is available in the bw-tooling GitHub repo, so you can get to there if you need to validate any specific statement.

Ok, are we ready? Let’s start!!

I’m going to assume that we already have a Kubernetes cluster in place and Prometheus installed as well. So, the first step is to enhance the BusinessWorks Container Edition base image to include the Prometheus capabilities integration. To do that we need to go to the GitHub repo page and follow these instructions:

  • Download & unzip the prometheus-integration.zip folder.
  • Open TIBCO BusinessWorks Studio and point it to a new workspace.
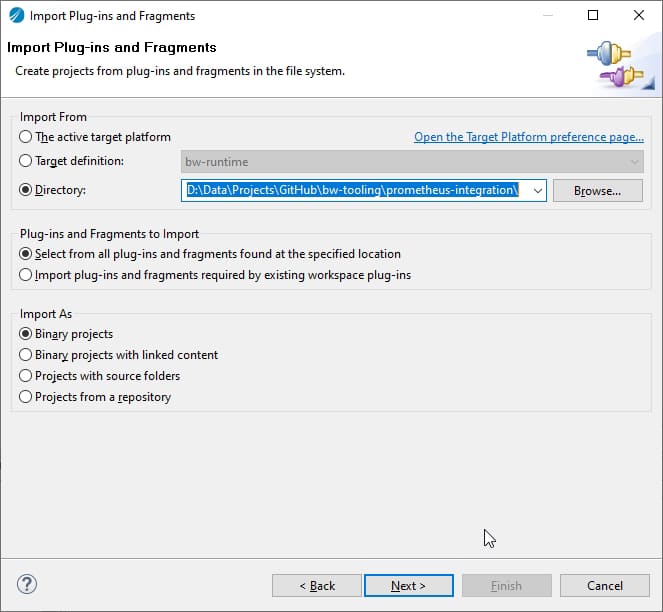
  • Right-click in Project Explorer → Import… → select Plug-ins and Fragments → select Import from the directory radio button
Prometheus TIBCO Monitoring for Containers: Quick and Simple in 5 Minutes!
  • Browse it to prometheus-integration folder (unzipped in step 1)
Prometheus TIBCO Monitoring for Containers: Quick and Simple in 5 Minutes!
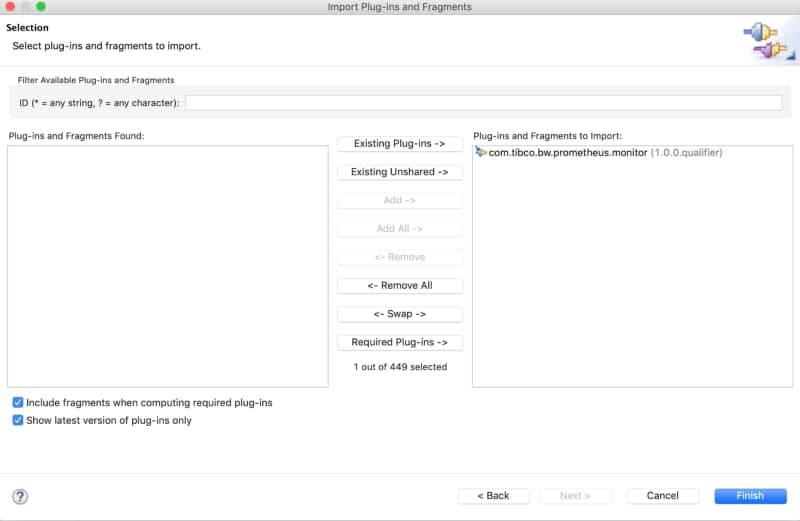
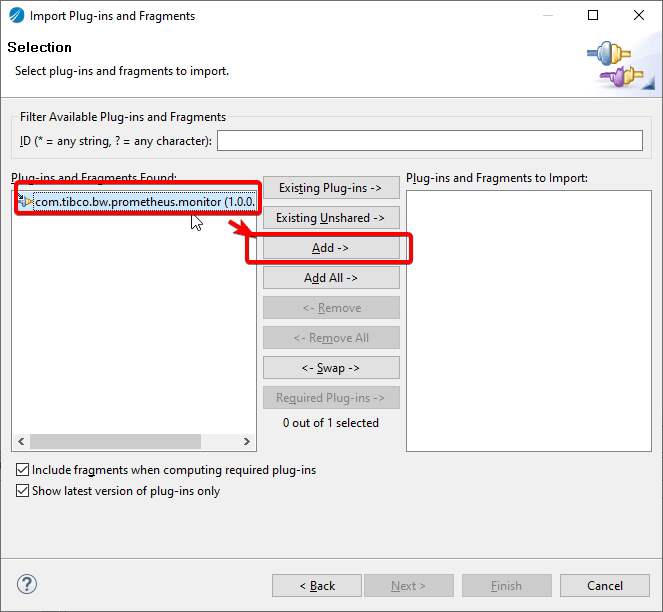
  • Now click Next → Select Prometheus plugin → click Add button → click Finish. This will import the plugin in the studio.
Prometheus TIBCO Monitoring for Containers: Quick and Simple in 5 Minutes!
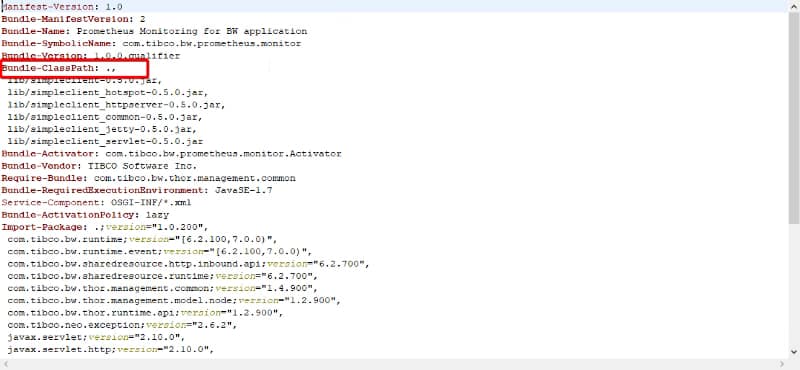
  • Now, to create JAR of this plugin so first, we need to make sure to update com.tibco.bw.prometheus.monitor with ‘.’ (dot) in Bundle-Classpath field as given below in META-INF/MANIFEST.MF file.
Prometheus TIBCO Monitoring for Containers: Quick and Simple in 5 Minutes!
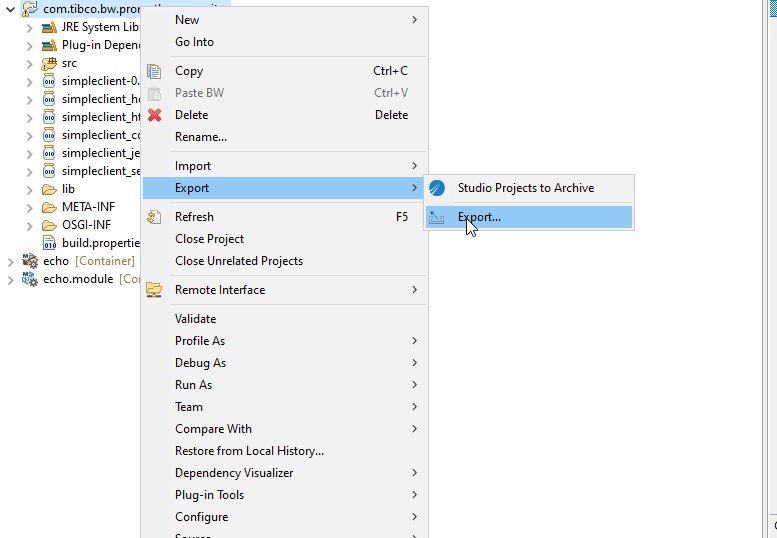
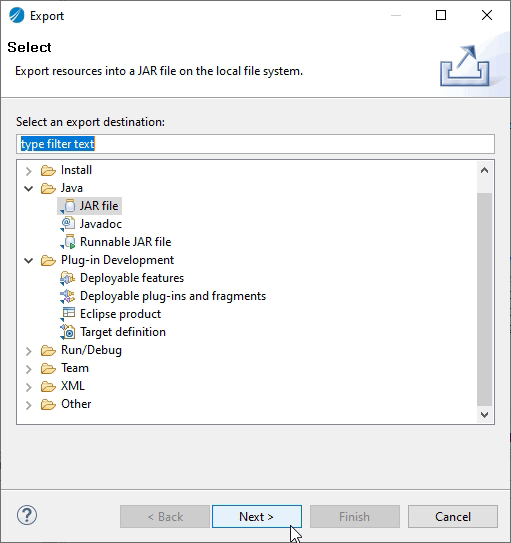
  • Right-click on Plugin → Export → Export…
Prometheus TIBCO Monitoring for Containers: Quick and Simple in 5 Minutes!
  • Select type as JAR file click Next
Prometheus TIBCO Monitoring for Containers: Quick and Simple in 5 Minutes!
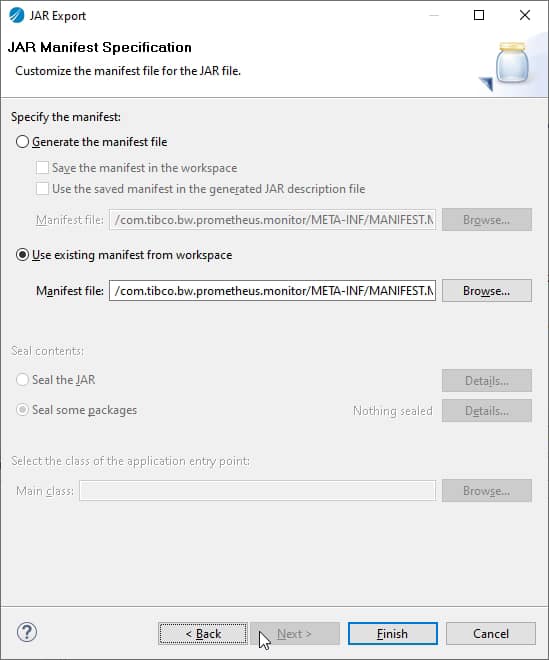
  • Now Click Next → Next → select radio button to use existing MANIFEST.MF file and browse the manifest file
Prometheus TIBCO Monitoring for Containers: Quick and Simple in 5 Minutes!
  • Click Finish. This will generate prometheus-integration.jar

Now, with the JAR already created what we need to do is include it in your own base image. To do that we place the JAR file in the <TIBCO_HOME>/bwce/2.4/docker/resources/addons/jar

Prometheus TIBCO Monitoring for Containers: Quick and Simple in 5 Minutes!

And we launch the building image command again from the <TIBCO_HOME>/bwce/2.4/docker folder to update the image using the following command (use the version you’re using at the moment)

docker build -t bwce_base:2.4.4 .

So, now we have an image with Prometheus support! Great! We’re close to the finish, we just create an image for our Container Application, in my case, this is going to be a very simple echo service that you can see here.

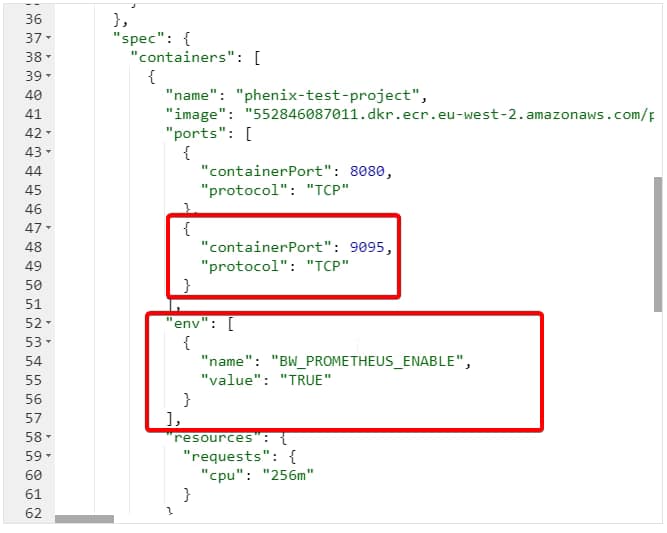
And we only need to keep these things in particular when we deploy to our Kubernetes cluster:

  • We should set an environment variable with the BW_PROMETHEUS_ENABLE to “TRUE”
  • We should expose the port 9095 from the container to be used by Prometheus to integrate.
Prometheus TIBCO Monitoring for Containers: Quick and Simple in 5 Minutes!

Now, we only need to provide this endpoint to the Prometheus scrapper system. There are several ways to do that, but we’re going to focus on the simple one.

We need to change the prometheus.yml to add the following job data:

- job_name: 'bwdockermonitoring'
  honor_labels: true
  static_configs:
    - targets: ['phenix-test-project-svc.default.svc.cluster.local:9095']
      labels:
        group: 'prod'

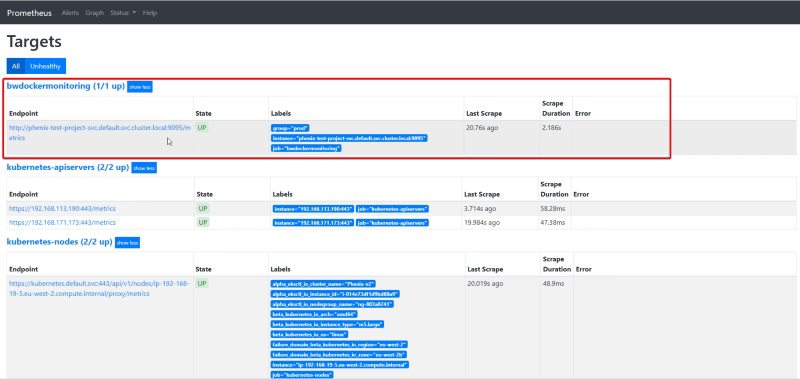
And after restarting Prometheus we have all the data indexed in the Prometheus database to be used for any dashboard system.

Prometheus TIBCO Monitoring for Containers: Quick and Simple in 5 Minutes!

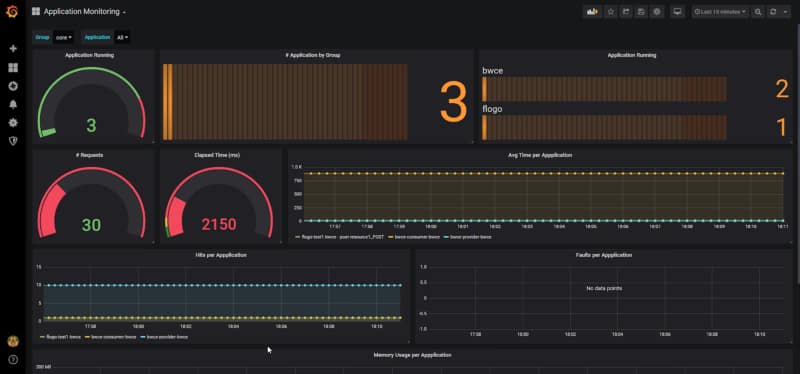
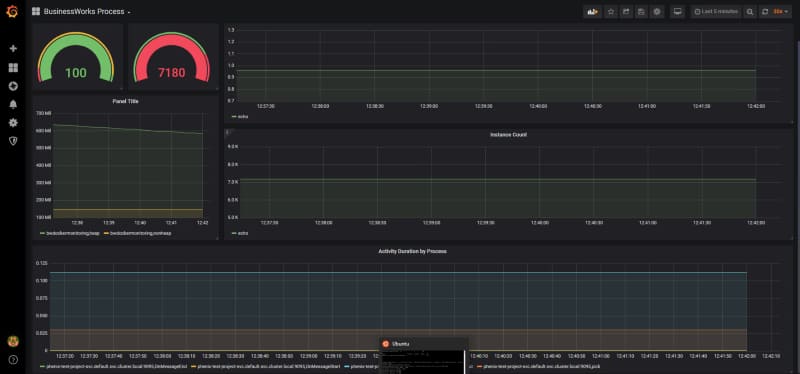
In this case, I’m going to use Grafana to do quick dashboard.

Prometheus TIBCO Monitoring for Containers: Quick and Simple in 5 Minutes!

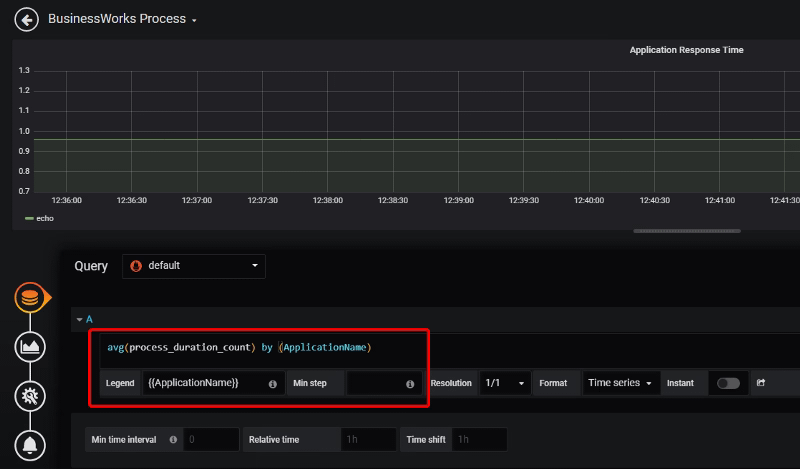
Each of these graph components is configured based on the metrics that are being scraped by Prometheus TIBCO exporter.

Prometheus TIBCO Monitoring for Containers: Quick and Simple in 5 Minutes!

OpenTracing in TIBCO BusinessWorks Container Edition: Tracing with Jaeger Explained

OpenTracing in TIBCO BusinessWorks Container Edition: Tracing with Jaeger Explained

The past month during the KubeCon 2019 Europe in Barcelona OpenTracing announces its merge with OpenCensus project to create a new standard named OpenTelemetry that is going to be live in September 2019.

So, I think that would be awesome to take a look at the capabilities regarding OpenTracing we have available in TIBCO BusinessWorks Container Edition

Today’s world is too complex in terms of how our architectures are defined and managed. New concepts in the last years like containers, microservices, service mesh, give us the option to reach a new level of flexibility, performance, and productivity but also comes with a cost of management we need to deal with.

Years ago architectures were simpler, service was a concept that was starting out, but even then a few issues begin to arise regarding monitoring, tracing, logging and so on. So, in those days everything was solved with a Development Framework that all our services were going to include because all of our services were developed by the same team, same technology, and in that framework, we can make sure things were handled properly.

Now, we rely on standards to do this kind of things, and for example, for Tracing, we rely on OpenTracing. I don’t want to spend time talking about what OpenTracing is where they have a full medium account talking themselves much better than I could ever do, so please take some minutes to read about it.

The only statement I want to do here is the following one:

Tracing is not Logging, and please be sure you understand that.

Tracing is about sampling, it’s like how flows are performing and if everything is worked but it is not about a specific request has been done well for customer ID whatever… that’s logging, no tracing.

So OpenTracing and its different implementations like Jaeger or Zipkin are the way we can implement tracing today in a really easy way, and this is not something that you could only do in your code-based development language, you can do it with our zero-code tools to develop cloud-native applications like TIBCO BusinessWorks Container Edition and that’s what I’d like to show you today. So, let the match, begin…

First thing I’d like to do is to show you the scenario we’re going to implement, and this is going to be the one shown in the image below:

OpenTracing in TIBCO BusinessWorks Container Edition: Tracing with Jaeger Explained

You are going to have two REST service that is going to call one to each other, and we’re going to export all the traces to Jaeger external component and later we can use its UI to analyze the flow in a graphical and easy way.

So, the first thing we need to do is to develop the services that as you can see in the pictures below are going to be quite easy because this is not the main purpose of our scenario.

Once, we have our docker images based on those applications we can start, but before we launch our applications, we need to launch our Jaeger system you can read all info about how to do it in the link below:

But at the end we only to run the following command:

docker run -d --name jaeger -e COLLECTOR_ZIPKIN_HTTP_PORT=9411  -p 5775:5775/udp  -p 6831:6831/udp  -p 6832:6832/udp  -p 5778:5778  -p 16686:16686  -p 14268:14268  -p 9411:9411  jaegertracing/all-in-one:1.8

And now, we’re ready to launch our applications and the only things we need to do in our developments because as you could see we didn’t do anything strange in our development and it was quite straightforward is to add the following environment variables when we launch our container

BW_JAVA_OPTS=”-Dbw.engine.opentracing.enable=true” -e JAEGER_AGENT_HOST=jaeger -e JAEGER_AGENT_PORT=6831 -e JAEGER_SAMPLER_MANAGER_HOST_PORT=jaeger:5778

And… that’s it, we launch our containers with the following commands and wait until applications are up & running

docker run -ti -p 5000:5000 — name provider -e BW_PROFILE=Docker -e PROVIDER_PORT=5000 -e BW_LOGLEVEL=ERROR — link jaeger -e BW_JAVA_OPTS=”-Dbw.engine.opentracing.enable=true” -e JAEGER_AGENT_HOST=jaeger -e JAEGER_AGENT_PORT=6831 -e JAEGER_SAMPLER_MANAGER_HOST_PORT=jaeger:5778 provider:1.0
OpenTracing in TIBCO BusinessWorks Container Edition: Tracing with Jaeger Explained
docker run — name consumer -ti -p 6000:6000 -e BW_PROFILE=Docker — link jaeger — link provider -e BW_JAVA_OPTS=”-Dbw.engine.opentracing.enable=true” -e JAEGER_AGENT_HOST=jaeger -e JAEGER_AGENT_PORT=6831 -e JAEGER_SAMPLER_MANAGER_HOST_PORT=jaeger:5778 -e CONSUMER_PORT=6000 -e PROVIDER_HOST=provider consumer:1.0
OpenTracing in TIBCO BusinessWorks Container Edition: Tracing with Jaeger Explained

Once they’re running, let’s generate some requests! To do that I’m going to use a SOAPUI project to generate some stable load for 60 secs, as you can see in the image below:

OpenTracing in TIBCO BusinessWorks Container Edition: Tracing with Jaeger Explained

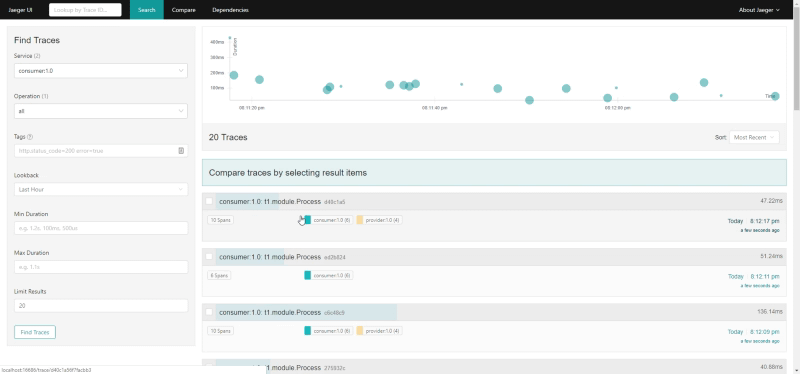
And now we’re going to go to the following URL to see the Jaeger UI and we can see the following thing as soon as you click in the Search button

OpenTracing in TIBCO BusinessWorks Container Edition: Tracing with Jaeger Explained

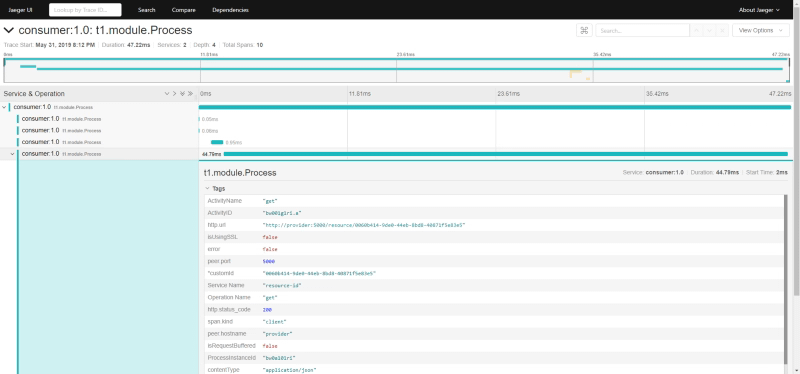
And then if we zoom in some specific trace:

OpenTracing in TIBCO BusinessWorks Container Edition: Tracing with Jaeger Explained

That’s pretty amazing but that’s not all, because you can see if you search in the UI about the data of this traces, you can see technical data from your BusinessWorks Container Edition flows as you can see in the picture below:

OpenTracing in TIBCO BusinessWorks Container Edition: Tracing with Jaeger Explained

But… what if you want to add your custom tags to those traces? You can do it as well!! Let me explain to you how.

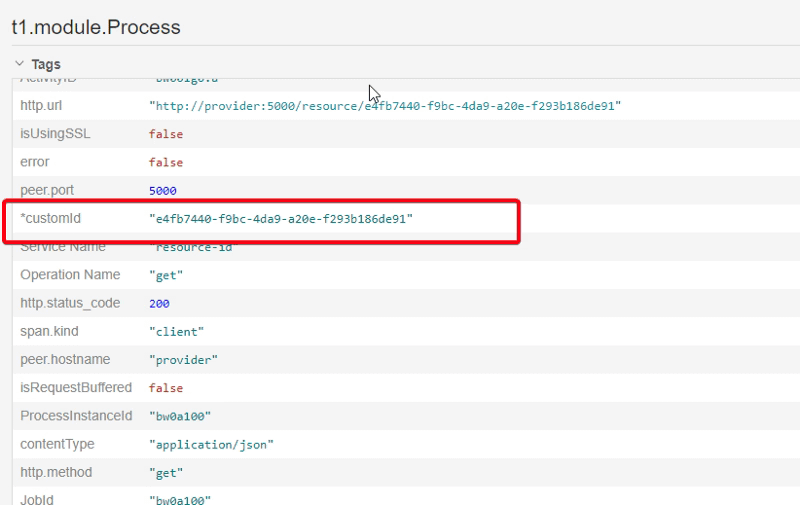
Since BusinessWorks Container Edition 2.4.4 you are going to find a new tab in all your activities named “Tags” where you can add the custom tags that you want this activity to include, for example, a custom id that is going to be propagated through the whole process we can define it as you can see here.

OpenTracing in TIBCO BusinessWorks Container Edition: Tracing with Jaeger Explained

And if you take a look at the data we have in the system, you can see all of these traces has this data:

OpenTracing in TIBCO BusinessWorks Container Edition: Tracing with Jaeger Explained

You can take a look at the code in the following GitHub repository:

Kubernetes Liveness and Readiness Probes for TIBCO BusinessWorks (BWCE)

Kubernetes Liveness and Readiness Probes for TIBCO BusinessWorks (BWCE)

Introduction

Probes are how we’re able to say to Kubernetes that everything inside the pod is working as expected. Kubernetes has no way to know what’s happening inside at the fine-grained and has no way to know for each container if it is healthy or not, that’s why they need help from the container itself.

Imagine that you’re Kubernetes controller and you have like eight different pods , one with Java batch application, another with some Redis instance, other with nodejs application, other with a Flogo microservice (Note: Haven’t you heard about Flogo yet? Take some minutes to know about one of the next new things you can use now to build your cloud-native applications) , another with a Oracle database, other with some jetty web server and finally another with a BusinessWorks Container Edition application. How can you tell that every single component is working fine?

First, you can think that you can do it with the entrypoint component of your Dockerfile as you only specify one command to run inside each container, so check if that process is running, and that means that everything is healthy? Ok… fair enough…

But, is this true always? A running process at the OS/container level means that everything is working fine? Let’s think about the Oracle database for a minute, imagine that you have an issue with the shared memory and it keeps in an initializing status forever, K8S is going to check the command, it is going to find that is running and says to the whole cluster: Ok! Don’t worry! Database is working perfectly, go ahead and send your queries to it!!

Kubernetes Liveness and Readiness Probes for TIBCO BusinessWorks (BWCE)
Photo by Rod Long on Unsplash

This could happen with similar components like a web server or even with an application itself, but it is too common when you have servers that can handle deployments on it, like BusinessWorks Container Edition itself. And that’ why this is very important for us as developers and even more important for us as administrators. So, let’s start!
The first thing we’re going to do is to build a BusinessWorks Container Edition Application, as this is not the main purpose of this article, we’re going to use the same ones I’ve created for the BusinessWorks Container Edition — Istio Integration that you could find here.

So, this is a quite simple application that exposes a SOAP Web Service. All applications in BusinessWorks Container Edition (as well as in BusinessWorks Enterprise Edition) has its own status, so you can ask them if they’re Running or not, that something the BusinessWorks Container internal “engine” (NOTE: We’re going to use the word engine to simplify when we’re talking about the internals of BWCE. In detail, the component that knows the status of the application is the internal AppNode the container starts, but let’s keep it simple for now)

Kubernetes Probes

In Kubernetes, exists the “probe” concept to perform health check to your container. This is performed by configuring liveness probes or readiness probes.

  • Liveness probe: Kubernetes uses liveness probes to know when to restart a Container. For example, liveness probes could catch a deadlock, where an application is running, but unable to make progress.
  • Readiness probe: Kubernetes uses readiness probes to know when a Container is ready to start accepting traffic. A Pod is considered ready when all of its Containers are ready. One use of this signal is to control which Pods are used as backends for Services. When a Pod is not ready, it is removed from Service load balance

Even when there are two types of probes for BusinessWorks Container Edition both are handling the same way, the idea is the following one: As long as the application is Running, you can start sending traffic and when it is not running we need to restart the container, so that makes it simpler for us.

Implementing Probes

Each BusinessWorks Container Edition application that is started has an out of the box way to know if it is healthy or not. This is done by a special endpoint published by the engine itself:

http://localhost:7777/_ping/

So, if we have a normal BusinessWorks Container Edition application deployed on our Kubernetes cluster as we had for the Istio integration we have logs similar to these ones:

Kubernetes Liveness and Readiness Probes for TIBCO BusinessWorks (BWCE)
Staring traces of a BusinessWorks Container Edition Application

As you can see logs says that the application is started. So, as we can’t launch a curl request from the inside the container (as we haven’t exposed the port 7777 to the outside yet and curl is not installed in the base image), the first thing we’re going to do is to expose it to the rest of the cluster.

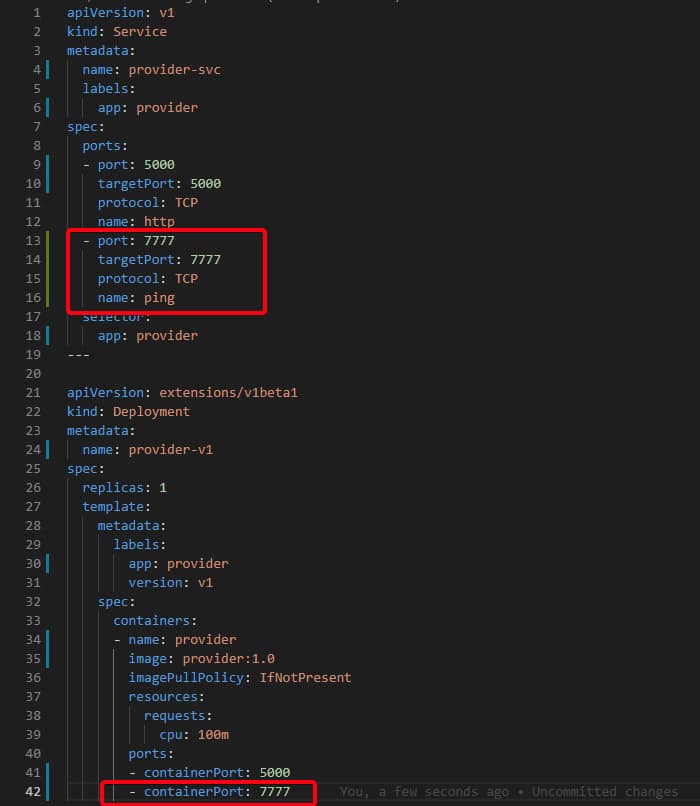
To do that we change our Deployment.yml file that we have used to this one:

Kubernetes Liveness and Readiness Probes for TIBCO BusinessWorks (BWCE)
Deployment.yml file with the 7777 port exposed

Now, we can go to any container in the cluster that has “curl” installed or any other way to launch a request like this one with the HTTP 200 code and the message “Application is running”.

Kubernetes Liveness and Readiness Probes for TIBCO BusinessWorks (BWCE)
Successful execution of _ping endpoint

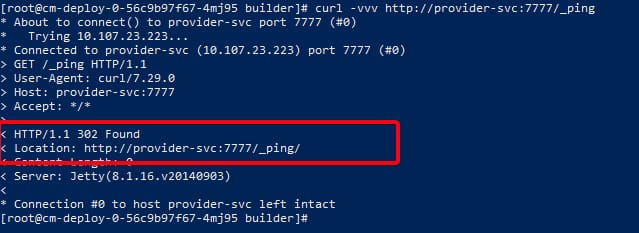
NOTE: If you forget the last / and try to invoke _ping instead of _ping/ you’re going to get an HTTP 302 Found code with the final location as you can see here:

Kubernetes Liveness and Readiness Probes for TIBCO BusinessWorks (BWCE)
HTTP 302 code execution were pointing to _ping instead of _ping/

Ok, let’s see what happens if now we stop the application. To do that we’re going to go inside the container and use the OSGi console.

To do that once you’re inside the container you execute the following command:

ssh -p 1122 equinox@localhost

It is going to ask for credentials and use the default password ‘equinox’. After that is going to give you the chance to create a new user and you can use whatever credentials work for you. In my example, I’m going to use admin / adminadmin (NOTE: Minimum length for a password is eight (8) characters.

Kubernetes Liveness and Readiness Probes for TIBCO BusinessWorks (BWCE)

And now, we’re in. And this allows us the option to execute several commands, as this is not the main topic for today I’m going to skip all the explanation but you can take a look at this link with all the info about this console.

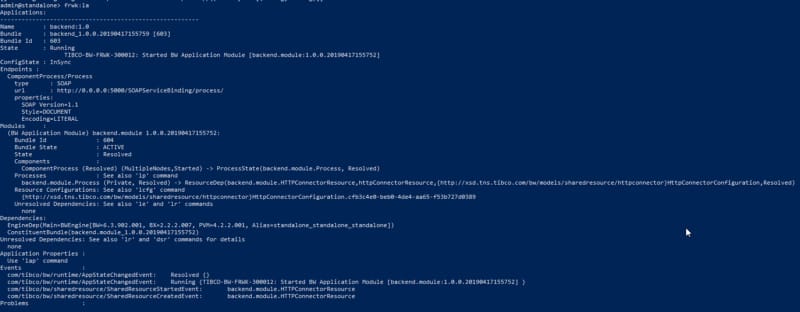
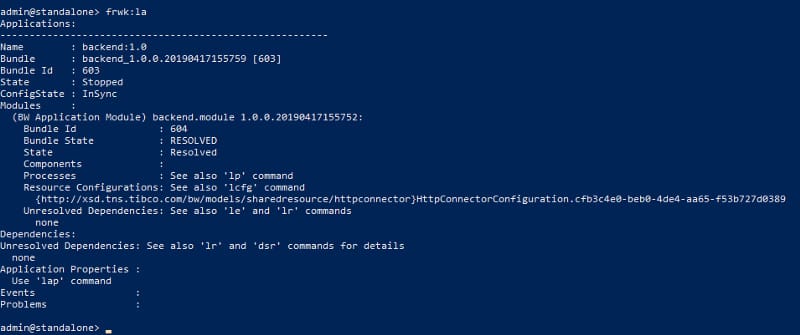
If we execute frwk:la is going to show the applications deployed, in our case the only one, as it should be in BusinessWorks Container Edition application:

Kubernetes Liveness and Readiness Probes for TIBCO BusinessWorks (BWCE)

To stop it, we are going to execute the following command to list all the OSGi bundle we have at the moment running in the system:

frwk:lb

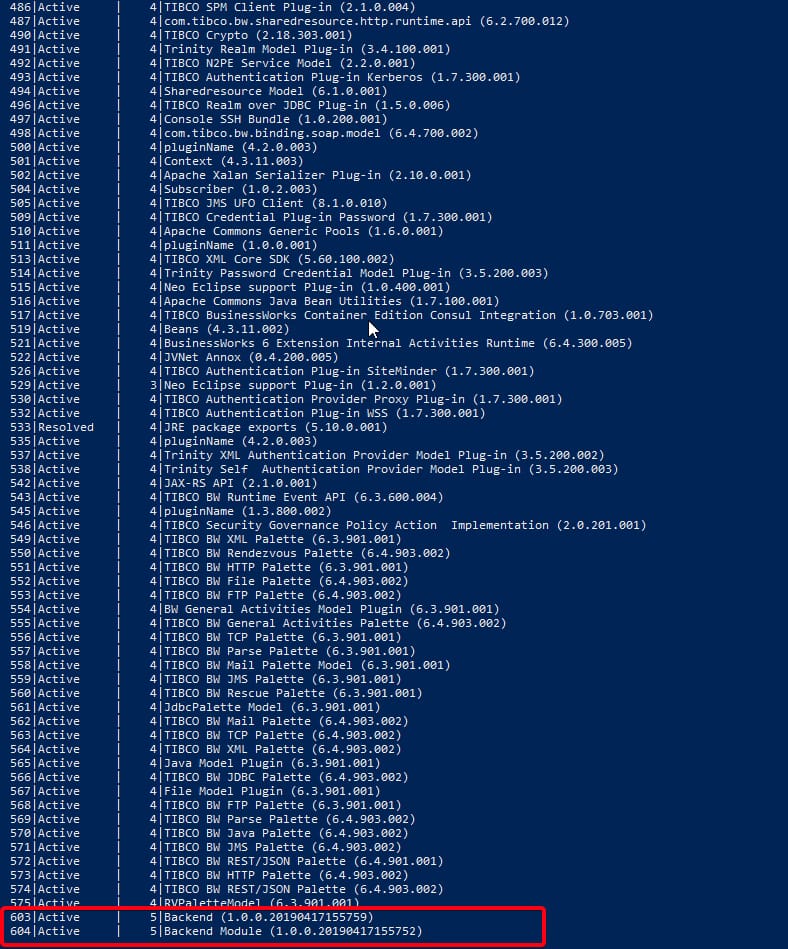
Now, we find the bundles that belong to our application (at least two bundles (1 per BW Module and another for the Application)

Kubernetes Liveness and Readiness Probes for TIBCO BusinessWorks (BWCE)
Showing bundles inside the BusinessWorks Container Application

And now we can stop it using felix:stop <ID>, so in my case, I need to execute the following commands:

stop “603”

stop “604”

Kubernetes Liveness and Readiness Probes for TIBCO BusinessWorks (BWCE)
Commands to stop the bundles that belong to the application

And now the application is stopped

Kubernetes Liveness and Readiness Probes for TIBCO BusinessWorks (BWCE)
OSGi console showing the application as Stopped

So, if now we try to launch the same curl command as we executed before, we’re getting the following output:

Kubernetes Liveness and Readiness Probes for TIBCO BusinessWorks (BWCE)
Failed execution of ping endpoint when Application is stopped

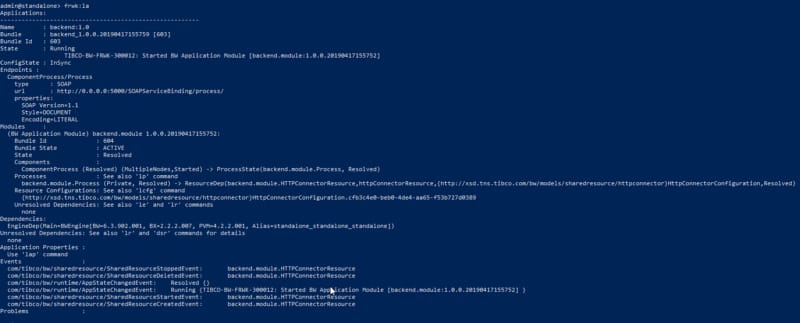
As you can see an HTTP 500 Error which means something is not fine. If now we try to start again the application using the start bundle command (equivalent to the stop bundle command that we used before) for both bundles of the application, you are going to see that the application says is running again:

Kubernetes Liveness and Readiness Probes for TIBCO BusinessWorks (BWCE)

And the command has the HTTP 200 output as it should have and the message “Application us running”

Kubernetes Liveness and Readiness Probes for TIBCO BusinessWorks (BWCE)

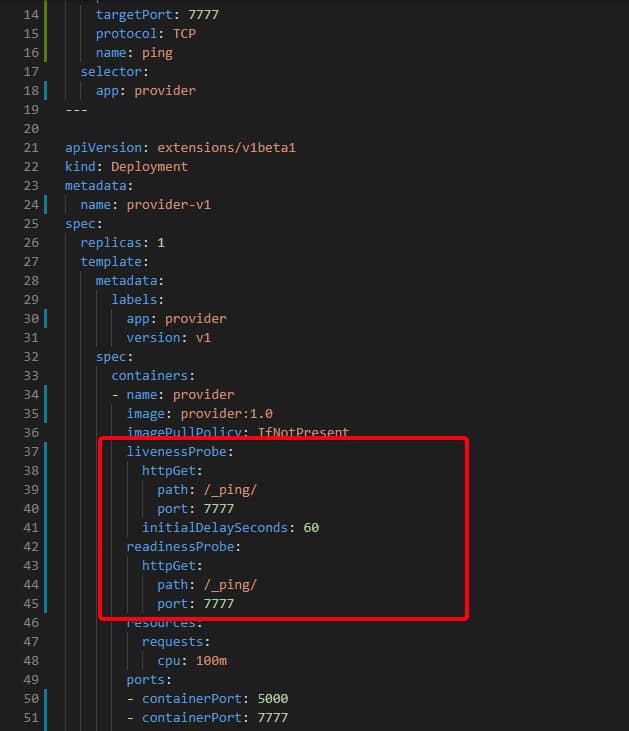
So, now, after knowing how the _ping/ endpoint works we only need to add it to our deployment.yml file from Kubernetes. So we modified again our deployment file to be something like this:

Kubernetes Liveness and Readiness Probes for TIBCO BusinessWorks (BWCE)

NOTE: It’s quite important the presence of initialDelaySeconds parameter to make sure the application has the option to start before start executing the probe. In case you don’t put this value you can get a Reboot Loop in your container.

NOTE: Example shows port 7777 as an exported port but this is only needed for the steps we’ve done before and you will not be needed in a real production environment.

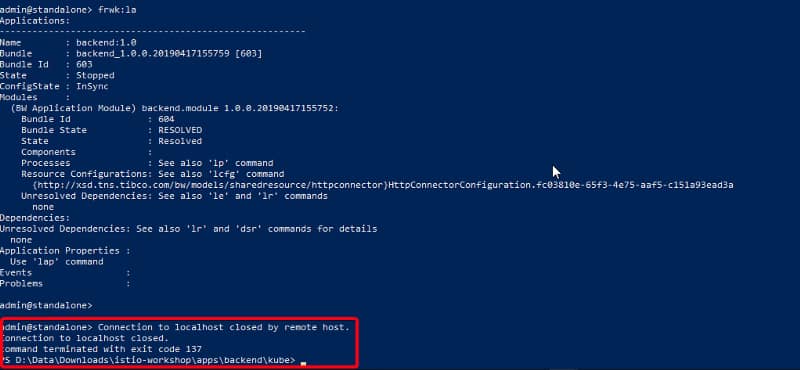
So now we deploy again the YML file and once we get the application running we’re going to try the same approach, but now as we have the probes defined as soon as I stop the application containers has going to be restarted. Let’s see!

Kubernetes Liveness and Readiness Probes for TIBCO BusinessWorks (BWCE)

As you can see in the picture above after the application is Stopped the container has been restarted and because of that, we’ve got expelled from inside the container.

So, that’s all, I hope that helps you to set up your probes and in case you need more details, please take a look at the Kubernetes documentation about httpGet probes to see all the configuration and option that you can apply to them.