Kubernetes Service Discovery for Prometheus: Dynamic Scraping the Right Way

Kubernetes Service Discovery for Prometheus: Dynamic Scraping the Right Way

In previous posts, we described how to set up Prometheus to work with your TIBCO BusinessWorks Container Edition apps, and you can read more about it here.

In that post, we described that there were several ways to update Prometheus about the services that ready to monitor. And we choose the most simple at that moment that was the static_config configuration which means:

Don’t worry Prometheus, I’ll let you know the IP you need to monitor and you don’t need to worry about anything else.

And this is useful for a quick test in a local environment when you want to test quickly your Prometheus set up or you want to work in the Grafana part to design the best possible dashboard to handle your need.

But, this is not too useful for a real production environment, even more, when we’re talking about a Kubernetes cluster when services are going up & down continuously over time. So, to solve this situation Prometheus allows us to define a different kind of ways to perform this “service discovery” approach. In the official documentation for Prometheus, we can read a lot about the different service discovery techniques but at a high level these are the main service discovery techniques available:

  • azure_sd_configs: Azure Service Discovery
  • consul_sd_configs: Consul Service Discovery
  • dns_sd_configs: DNS Service Discovery
  • ec2_sd_configs: EC2 Service Discovery
  • openstack_sd_configs: OpenStack Service Discovery
  • file_sd_configs: File Service Discovery
  • gce_sd_configs: GCE Service Discovery
  • kubernetes_sd_configs: Kubernetes Service Discovery
  • marathon_sd_configs: Marathon Service Discovery
  • nerve_sd_configs: AirBnB’s Nerve Service Discovery
  • serverset_sd_configs: Zookeeper Serverset Service Discovery
  • triton_sd_configs: Triton Service Discovery
  • static_config: Static IP/DNS for the configuration. No Service Discovery.

And even, it all these options are not enough for you and need something more specific you have an API available to extend the Prometheus capabilities and create your own Service Discovery technique. You can find more info about it here:

But this is not our case, for us, the Kubernetes Service Discovery is the right choice for our approach. So, we’re going to change the static configuration we had in the previous post:

- job_name: 'bwdockermonitoring'
  honor_labels: true
  static_configs:
    - targets: ['phenix-test-project-svc.default.svc.cluster.local:9095']
      labels:
        group: 'prod'

For this Kubernetes configuration

- job_name: 'bwce-metrics'
  scrape_interval: 5s
  metrics_path: /metrics/
  scheme: http
  kubernetes_sd_configs:
  - role: endpoints
    namespaces:
      names:
      - default
  relabel_configs:
  - source_labels: [__meta_kubernetes_service_label_app]
    separator: ;
    regex: (.*)
    replacement: $1
    action: keep
  - source_labels: [__meta_kubernetes_endpoint_port_name]
    separator: ;
    regex: prom
    replacement: $1
    action: keep
  - source_labels: [__meta_kubernetes_namespace]
    separator: ;
    regex: (.*)
    target_label: namespace
    replacement: $1
    action: replace
  - source_labels: [__meta_kubernetes_pod_name]
    separator: ;
    regex: (.*)
    target_label: pod
    replacement: $1
    action: replace
  - source_labels: [__meta_kubernetes_service_name]
    separator: ;
    regex: (.*)
    target_label: service
    replacement: $1
    action: replace
  - source_labels: [__meta_kubernetes_service_name]
    separator: ;
    regex: (.*)
    target_label: job
    replacement: 1
    action: replace
  - separator: ;
    regex: (.*)
    target_label: endpoint
    replacement: $1
    action: replace

As you can see this is quite more complex than the previous configuration but it is not as complex as you can think at first glance, let’s review it by different parts.

- role: endpoints
    namespaces:
      names:
      - default

It says that we’re going to use role for endpoints that are created under the default namespace and we’re going to specify the changes we need to do to find the metrics endpoints for Prometheus.

scrape_interval: 5s
 metrics_path: /metrics/
 scheme: http

This says that we’re going to execute the scrape process in a 5 seconds interval, using http on the path /metrics/

And then, we have a relabel_config section:

- source_labels: [__meta_kubernetes_service_label_app]
    separator: ;
    regex: (.*)
    replacement: $1
    action: keep
  - source_labels: [__meta_kubernetes_endpoint_port_name]
    separator: ;
    regex: prom
    replacement: $1
    action: keep

That means that we’d like to keep that label for prometheus:

- source_labels: [__meta_kubernetes_namespace]
    separator: ;
    regex: (.*)
    target_label: namespace
    replacement: $1
    action: replace
  - source_labels: [__meta_kubernetes_pod_name]
    separator: ;
    regex: (.*)
    target_label: pod
    replacement: $1
    action: replace
  - source_labels: [__meta_kubernetes_service_name]
    separator: ;
    regex: (.*)
    target_label: service
    replacement: $1
    action: replace
  - source_labels: [__meta_kubernetes_service_name]
    separator: ;
    regex: (.*)
    target_label: job
    replacement: 1
    action: replace
  - separator: ;
    regex: (.*)
    target_label: endpoint
    replacement: $1
    action: replace

That means that we want to do a replace of the label value and we can do several things:

  • Rename the label name using the target_label to set the name of the final label that we’re going to create based on the source_labels.
  • Replace the value using the regex parameter to define the regular expression for the original value and the replacement parameter that is going to express the changes that we want to do to this value.

So, now after applying this configuration when we deploy a new application in our Kubernetes cluster, like the project that we can see here:

Automatically we’re going to see an additional target on our job-name configuration “bwce-metrics”

📚 Want to dive deeper into Kubernetes? This article is part of our comprehensive Kubernetes Architecture Patterns guide, where you’ll find all fundamental and advanced concepts explained step by step.

OpenTracing in TIBCO BusinessWorks Container Edition: Tracing with Jaeger Explained

OpenTracing in TIBCO BusinessWorks Container Edition: Tracing with Jaeger Explained

The past month during the KubeCon 2019 Europe in Barcelona OpenTracing announces its merge with OpenCensus project to create a new standard named OpenTelemetry that is going to be live in September 2019.

So, I think that would be awesome to take a look at the capabilities regarding OpenTracing we have available in TIBCO BusinessWorks Container Edition

Today’s world is too complex in terms of how our architectures are defined and managed. New concepts in the last years like containers, microservices, service mesh, give us the option to reach a new level of flexibility, performance, and productivity but also comes with a cost of management we need to deal with.

Years ago architectures were simpler, service was a concept that was starting out, but even then a few issues begin to arise regarding monitoring, tracing, logging and so on. So, in those days everything was solved with a Development Framework that all our services were going to include because all of our services were developed by the same team, same technology, and in that framework, we can make sure things were handled properly.

Now, we rely on standards to do this kind of things, and for example, for Tracing, we rely on OpenTracing. I don’t want to spend time talking about what OpenTracing is where they have a full medium account talking themselves much better than I could ever do, so please take some minutes to read about it.

The only statement I want to do here is the following one:

Tracing is not Logging, and please be sure you understand that.

Tracing is about sampling, it’s like how flows are performing and if everything is worked but it is not about a specific request has been done well for customer ID whatever… that’s logging, no tracing.

So OpenTracing and its different implementations like Jaeger or Zipkin are the way we can implement tracing today in a really easy way, and this is not something that you could only do in your code-based development language, you can do it with our zero-code tools to develop cloud-native applications like TIBCO BusinessWorks Container Edition and that’s what I’d like to show you today. So, let the match, begin…

First thing I’d like to do is to show you the scenario we’re going to implement, and this is going to be the one shown in the image below:

OpenTracing in TIBCO BusinessWorks Container Edition: Tracing with Jaeger Explained

You are going to have two REST service that is going to call one to each other, and we’re going to export all the traces to Jaeger external component and later we can use its UI to analyze the flow in a graphical and easy way.

So, the first thing we need to do is to develop the services that as you can see in the pictures below are going to be quite easy because this is not the main purpose of our scenario.

Once, we have our docker images based on those applications we can start, but before we launch our applications, we need to launch our Jaeger system you can read all info about how to do it in the link below:

But at the end we only to run the following command:

docker run -d --name jaeger -e COLLECTOR_ZIPKIN_HTTP_PORT=9411  -p 5775:5775/udp  -p 6831:6831/udp  -p 6832:6832/udp  -p 5778:5778  -p 16686:16686  -p 14268:14268  -p 9411:9411  jaegertracing/all-in-one:1.8

And now, we’re ready to launch our applications and the only things we need to do in our developments because as you could see we didn’t do anything strange in our development and it was quite straightforward is to add the following environment variables when we launch our container

BW_JAVA_OPTS=”-Dbw.engine.opentracing.enable=true” -e JAEGER_AGENT_HOST=jaeger -e JAEGER_AGENT_PORT=6831 -e JAEGER_SAMPLER_MANAGER_HOST_PORT=jaeger:5778

And… that’s it, we launch our containers with the following commands and wait until applications are up & running

docker run -ti -p 5000:5000 — name provider -e BW_PROFILE=Docker -e PROVIDER_PORT=5000 -e BW_LOGLEVEL=ERROR — link jaeger -e BW_JAVA_OPTS=”-Dbw.engine.opentracing.enable=true” -e JAEGER_AGENT_HOST=jaeger -e JAEGER_AGENT_PORT=6831 -e JAEGER_SAMPLER_MANAGER_HOST_PORT=jaeger:5778 provider:1.0
OpenTracing in TIBCO BusinessWorks Container Edition: Tracing with Jaeger Explained
docker run — name consumer -ti -p 6000:6000 -e BW_PROFILE=Docker — link jaeger — link provider -e BW_JAVA_OPTS=”-Dbw.engine.opentracing.enable=true” -e JAEGER_AGENT_HOST=jaeger -e JAEGER_AGENT_PORT=6831 -e JAEGER_SAMPLER_MANAGER_HOST_PORT=jaeger:5778 -e CONSUMER_PORT=6000 -e PROVIDER_HOST=provider consumer:1.0
OpenTracing in TIBCO BusinessWorks Container Edition: Tracing with Jaeger Explained

Once they’re running, let’s generate some requests! To do that I’m going to use a SOAPUI project to generate some stable load for 60 secs, as you can see in the image below:

OpenTracing in TIBCO BusinessWorks Container Edition: Tracing with Jaeger Explained

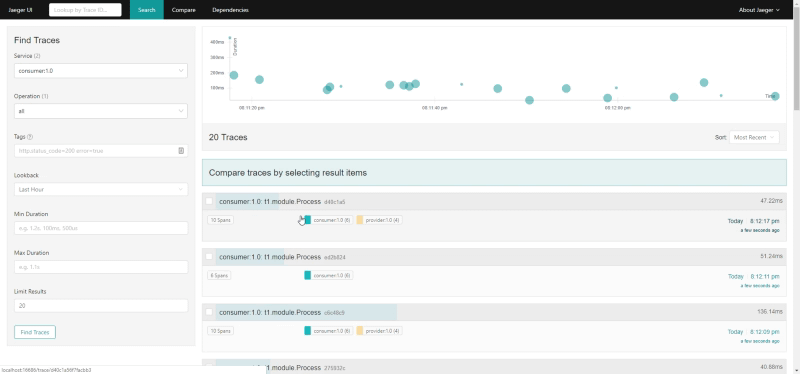
And now we’re going to go to the following URL to see the Jaeger UI and we can see the following thing as soon as you click in the Search button

OpenTracing in TIBCO BusinessWorks Container Edition: Tracing with Jaeger Explained

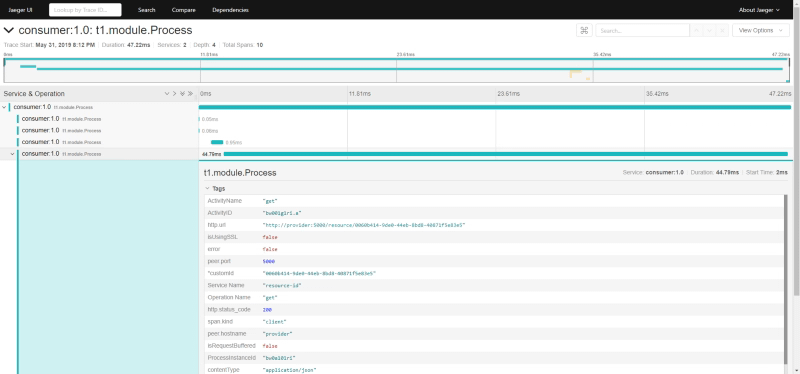
And then if we zoom in some specific trace:

OpenTracing in TIBCO BusinessWorks Container Edition: Tracing with Jaeger Explained

That’s pretty amazing but that’s not all, because you can see if you search in the UI about the data of this traces, you can see technical data from your BusinessWorks Container Edition flows as you can see in the picture below:

OpenTracing in TIBCO BusinessWorks Container Edition: Tracing with Jaeger Explained

But… what if you want to add your custom tags to those traces? You can do it as well!! Let me explain to you how.

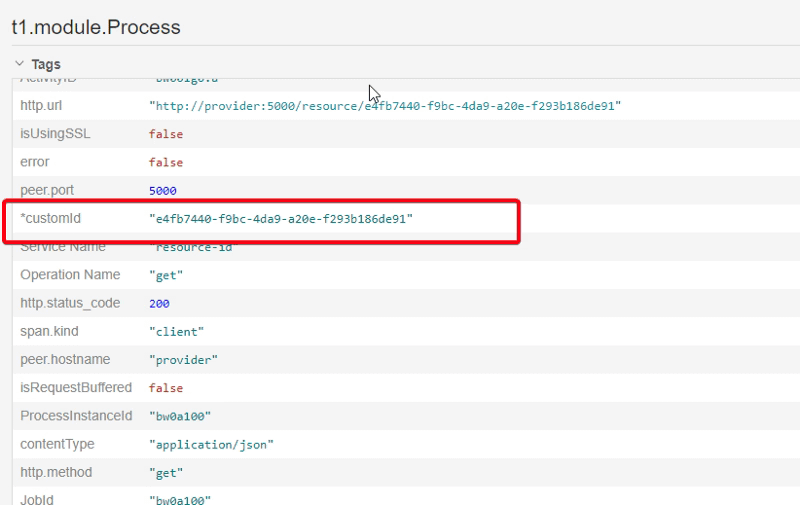
Since BusinessWorks Container Edition 2.4.4 you are going to find a new tab in all your activities named “Tags” where you can add the custom tags that you want this activity to include, for example, a custom id that is going to be propagated through the whole process we can define it as you can see here.

OpenTracing in TIBCO BusinessWorks Container Edition: Tracing with Jaeger Explained

And if you take a look at the data we have in the system, you can see all of these traces has this data:

OpenTracing in TIBCO BusinessWorks Container Edition: Tracing with Jaeger Explained

You can take a look at the code in the following GitHub repository: