#TIBFAQS Enabling Remote Debugging for TIBCO BusinessWorks Application on Kubernetes

#TIBFAQS Enabling Remote Debugging for TIBCO BusinessWorks Application on Kubernetes

Provide more agility to your troubleshooting efforts by debugging exactly where the error is happening using Remote Debugging techniques

#TIBFAQS Enabling Remote Debugging for TIBCO BusinessWorks Application on Kubernetes
Photo by Markus Winkler on Unsplash

Container revolution has provided a lot of benefits, as we have been discussed in-depth in other articles, and at the same time, it has also provided some new challenges that we need to tackle.

This article is part of my comprehensive TIBCO Integration Platform Guide where you can find more patterns and best practices for TIBCO integration platforms.

All agility that we have now in the hands of our developers needs to be also extended to the maintenance work and fixing things. We need to be agile as well. We know some of the main issues that we have regarding this: It works on my environment, with the data set that I have, I couldn’t see the issue, or I couldn’t reproduce the error, are just sentences that we listen to over and over and delay the resolution of some errors or improvements even when the solution is simple we struggle in getting a real scenario to test.

And here is where Remote Debugging comes in. Remote Debugging is, just as its own name clearly states, to be able to debug something that is not local that is remote. It has been focused since its conception in Mobile Development because it doesn’t matter how good the simulator is. You will always need to test in a real device to make sure everything is working properly.

So this is the same concept but applicable to a container, so that means that I have a TIBCO BusinessWorks application running on Kubernetes. We want to debug it as it has been running locally, as shown in the image before. To be able to do that, we need to follow these steps:

Enabling the Remote Debugging in the pod

The first step is to enable the remote debug option in the application and to do that, we need to use the internal API that the BusinessWorks provides, and to do that, we need to execute from inside the container:

curl -XPOST http://localhost:8090/bw/bwengine.json/debug/?interface=0.0.0.0&port=5554&engineName=Main

In case that we do not have any tool like curl or wget to hit a URL inside the container, you can always use the port-forward strategy to make the 8090 port from the pod accessible to enable the debug port using a command similar to the one below:

kubectl port-forward hello-world-test-78b6f9b4b-25hss 8090:8090

And then, we can hit it from our local machine to enable remote debugging

Make the Debug Port accessible to the Studio

To do the remote debugging, we need to be able to connect our local TIBCO BusinessStudio to this specific pod that is executing the load and, to do that, we need to have access to the Debug port. To get this, we have mainly two options that are the ones shown in the subsections below: Expose the port at the pod level and port-forwarding option.

Expose the port at the Pod Level

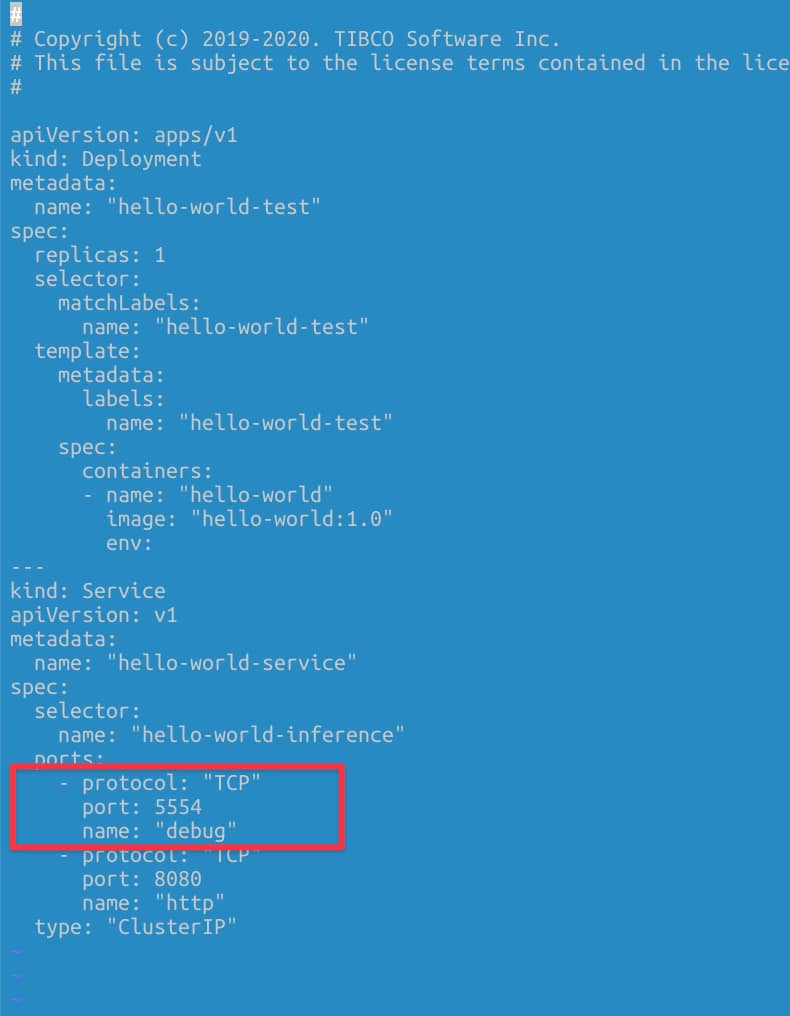
We need to have the debug port opened in our pod. To do that, we need to define another port that is not in use by the application, and it is not the default administration port (8090) to the one to be exposed. For example, in my case, I will use 5554 as the debug port, and to do that, I define another port to be accessed.
#TIBFAQS Enabling Remote Debugging for TIBCO BusinessWorks Application on Kubernetes
Definition of the debug port as a Service

Port-Forwarding Option

Another option if we do not want to expose the debug port all the time, even if this is not going to be used unless we’re executing the remote debug, we have another option to do a port-forward to the debug port in our local.

kubectl port-forward hello-world-test-78b6f9b4b-cctgh 5554:5554

Connection to the TIBCO Business Studio

Now that we have everything ready, we need to connect our local TIBCO Business Studio to the pod, and to do that, we need to follow these steps:

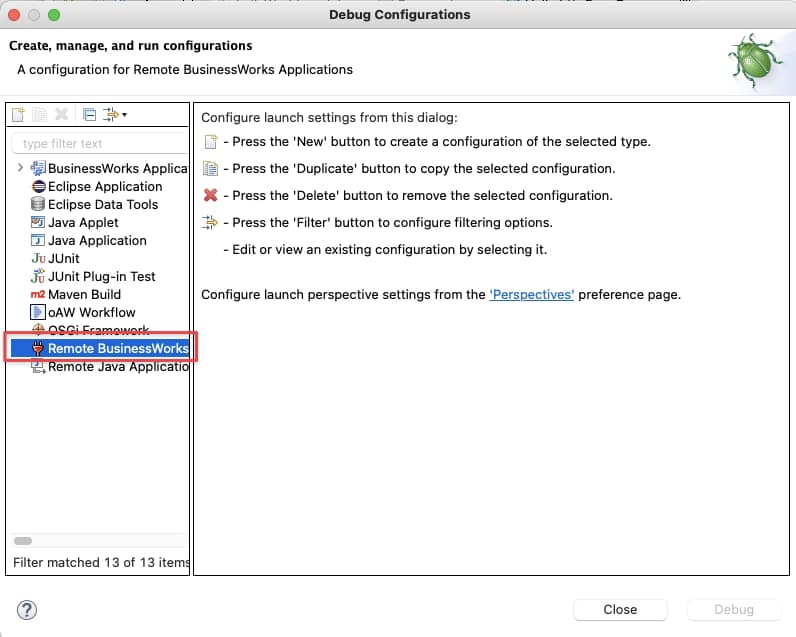
Run → Debug Configurations, and we select the Remote BusinessWorks
#TIBFAQS Enabling Remote Debugging for TIBCO BusinessWorks Application on Kubernetes
Selection of the Remote BusinessWorks application option in the Debug Configuration

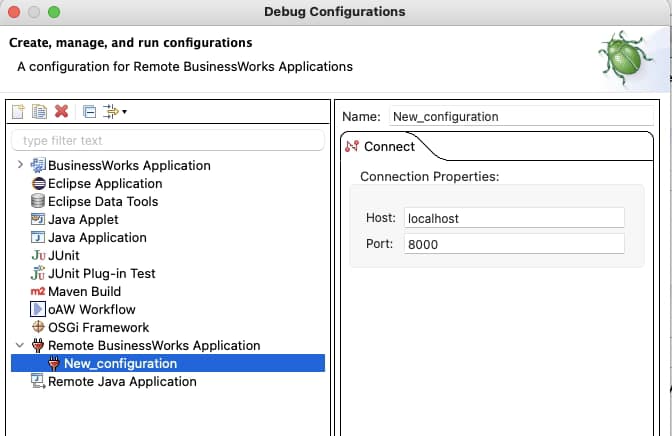
And now we need to provide the connection details. For this case, we will use the localhost and port 5554 and click on the Debug button.
#TIBFAQS Enabling Remote Debugging for TIBCO BusinessWorks Application on Kubernetes
Setting the connection properties for the Remote Debugging

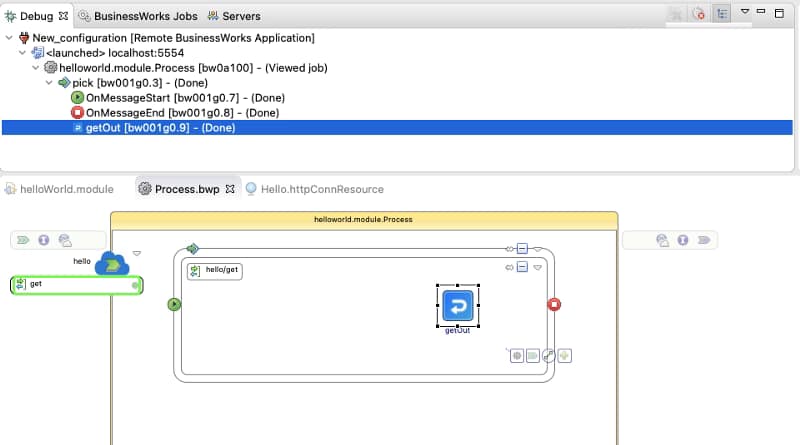
After that moment, we will establish a connection between both environments: the pod running on our Kubernetes cluster and our local TIBCO BusinessStudio. And as soon as we hit the container, we can see the execution in our local environment:
#TIBFAQS Enabling Remote Debugging for TIBCO BusinessWorks Application on Kubernetes
Remote Debugging execution from our TIBCO BusinesStudio instance

Summary

I hope you find this interesting, and if you are one of those facing this issue now, you have information not to be stopped by this one. If you would like to submit your questions feel free to use one of the following options:

  • Twitter: You can send me a mention at @alexandrev on Twitter or a DM or even just using the hashtag #TIBFAQS that I will monitor.
  • Email: You can send me an email to alexandre.vazquez at gmail.com with your question.
  • Instagram: You can send me a DM on Instagram at @alexandrev
#TIBFAQS Enabling Remote Debugging for TIBCO BusinessWorks Application on Kubernetes

How to Check TIBCO BusinessWorks Configuration at Runtime (OSGi lcfg Command)

How to Check TIBCO BusinessWorks Configuration at Runtime (OSGi lcfg Command)

Discover how the OSGI lcfg command can help you be sure which is the configuration at runtime.

Knowing the TIBCO BW configuration at runtime is became critical as you always need to know if the latest changes has been applied or just want to check the specific value for a Module Property as part of your development.

This article is part of my comprehensive TIBCO Integration Platform Guide where you can find more patterns and best practices for TIBCO integration platforms.

When we are talking about applications deployed on the cloud one of the key things is Configuration Management. Especially if we include into the mix things like Kubernetes, Containers, External Configuration Management System things got tricky.

Usual configuration when we are talking about a Kubernetes environment for configuration management is the use of Config Maps or Spring Cloud Config.

When you can upload the configuration in a separate step as deploying the application, you can get into a situation where you are not sure about what is the running configuration that a BusinessWorks application has.

To check TIBCO BW configuration there is an easy way to know exactly the current values:

  • We just need to get inside the container to be able to access the internal OSGI console that allows us to execute administrative commands.
  • We have spoken other times about that API but in case you would like to take a deeper look you just need to check this link:
  • And one of the commands is lcfg that allows knowing which configuration is being used by the application that is running:
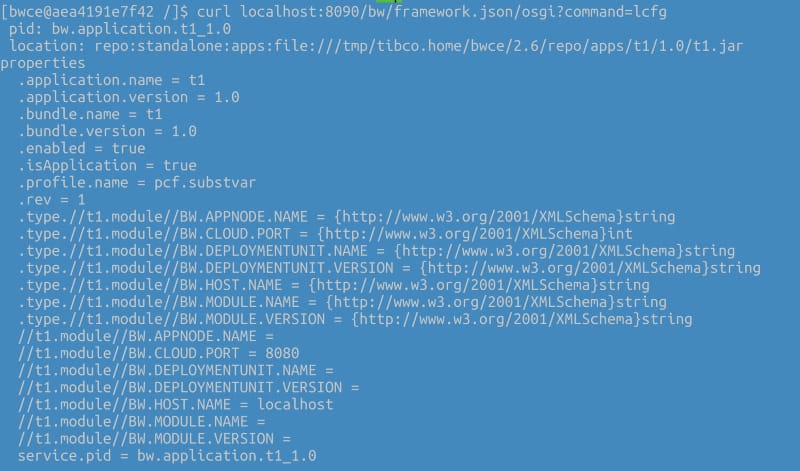
curl localhost:8090/bw/framework.json/osgi?command=lcfg

With an output similar to this:

How to Check TIBCO BusinessWorks Configuration at Runtime (OSGi lcfg Command)
Sample output for the lcfg command of a Running BusinessWorks Container Application

Summary

I hope you find this interesting, and if you are one of those facing this issue now, you have information not to be stopped by this one. If you would like to submit your questions feel free to use one of the following options:

  • Twitter: You can send me a mention at @alexandrev on Twitter or a DM or even just using the hashtag #TIBFAQs that I will monitor.
  • Email: You can send me an email to alexandre.vazquez at gmail.com with your question.
  • Instagram: You can send me a DM on Instagram at @alexandrev
How to Check TIBCO BusinessWorks Configuration at Runtime (OSGi lcfg Command)

How to Fix TIBCO BusinessWorks Impaired Status (Root Causes & Troubleshooting Guide)

How to Fix TIBCO BusinessWorks Impaired Status (Root Causes & Troubleshooting Guide)

Learn the main reasons behind an Impaired status and how you can perform troubleshooting to identify and solve the error.

#TIBFAQS: TIBCO BW Impaired Status: How to solve it?
Photo by Charles Deluvio on Unsplash

This is another post of the #TIBFAQS series. To remind you what all this about is, you can submit your questions regarding TIBCO developing issues or doubts and try to provide an answer here to try to help the community of TIBCO developers out there.

This article is part of my comprehensive TIBCO Integration Platform Guide where you can find more patterns and best practices for TIBCO integration platforms.

So, today I am going to start with one of the most common issues when we work with BusinessWorks, and it is when I am going to deploy my application or test it locally, and I get this log trace and nothing after that: TIBCO BW Impaired Status.

How to Fix TIBCO BusinessWorks Impaired Status (Root Causes & Troubleshooting Guide)
Impaired status error message

This is one of the usual situations for a BusinessWorks junior developer and one of the reasons you have more time spent doing troubleshooting. Let’s get some tricks today, so this message will never again stop you in your journey to production.

What is the cause of this error?

This error means that the BusinessWorks runtime is not able to meet all the dependencies among the components to be able to start. As you probably know, BusinessWorks each of the applications’ components is managed independently, and they are referencing each other.

For example, the Application depends on the Application Module and the Shared Module. The Application module can have a dependency on a JMS Connection and so on.

Situations that can raise this error

Let’s take a look now at the situation that can raise this error and solve it.

1.- Missing module or incompatible versions

One usual situation that can lead to this problem is missing modules or incompatible versions of the modules. In that case, the referencable component will wait for a module or a specific version of a module to be started. Still, this module is missing, or it is starting another version.

2.- Not valid shared connections

Another option can be if some of the components are required to establish the connection with other technologies such as JDBC connections, JMS connections, KAFKA connections, or another one of the more than 200 connectors available.

3.- Missing Starter component in the Module Descriptors

The last of the usual suspects here is when you have a Stater component in the Module Descriptors, but this process is not available inside the EAR file that you are deploying. That dependency is never satisfied, and that leads to unlimited Impaired status.

How to detect what component is missing?

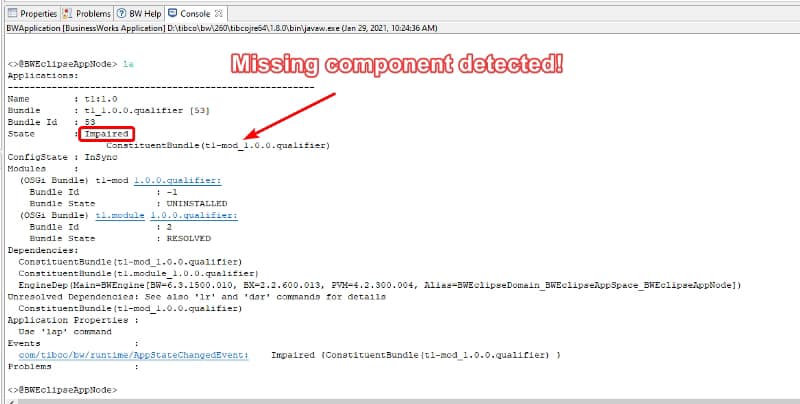
To help you in the process of detecting in which situation you are, you have an incredible tool at your disposal which is the command la from the OSGi Console Interface.

This command helps us list the applications deployed in this specific AppNode or container and give us the details of them, including the reason for an Impaired situation.

How to Fix TIBCO BusinessWorks Impaired Status (Root Causes & Troubleshooting Guide)

How to run the OSGi console depends on your deployment model, but you can read all the information about it in the link below:

Summary

I hope you find this interesting to solve your TIBCO BW Impaired status on your apps, and if you are one of those facing this issue now, you have information not to be stopped by this one. If you would like to submit your questions feel free to use one of the following options:

  • Twitter: You can send me a mention at @alexandrev on Twitter or a DM or even just use the hashtag #TIBFAQs that I will monitor.
  • Email: You can send me an email to alexandre.vazquez at gmail.com with your question.
  • Instagram: You can send me a DM on Instagram at @alexandrev
How to Fix TIBCO BusinessWorks Impaired Status (Root Causes & Troubleshooting Guide)

How to Fix “Failed to Read Profile from /tmp/tmp/pcf.substvar” in TIBCO BWCE

How to Fix “Failed to Read Profile from /tmp/tmp/pcf.substvar” in TIBCO BWCE

This is another post of the #TIBFAQS series and only to remind you what all this about is that you can submit your questions regarding TIBCO developing issues or doubts and I try to provide an answer here to try to help the community of TIBCO developers out there.

This article is part of my comprehensive TIBCO Integration Platform Guide where you can find more patterns and best practices for TIBCO integration platforms.

So, today I am going to start with one of the I think most common issues when we work with BusinessWorks Container Edition and we are deploying into our target environment and it is a trace similar to this one:

How to Fix “Failed to Read Profile from /tmp/tmp/pcf.substvar” in TIBCO BWCE
Error trace regarding I am not able to read the profile

What is the cause of this error?

This error means that the BusinessWorks runtime is not able to read and process the properties file to start the application. So that means that your error is regarding the configuration of the application and not the application itself. So, the good news here: your code seems to be fine at this point.

As probably you know all the TIBCO BW applications use for a very long time an XML file to have the configuration values to start with. This is the file that in the case of BusinessWokrks Container Edition is stored at /tmp/tmp/pcf.substvar and it is populated for several sources depending on how to manage your configuration.

As you know you have several options to manage your configuration in Cloud base environments: Environment variables, Config Maps, Configuration Management Systems such as Spring Cloud Config or Consul.. So it is important that you have a clear understanding of what are you using.

So the error is that the file has something in its content that is not valid, because it is wrong or because it is not able to understand it.

Situations that can raise this error

Let’s take a look now at the situation that can raise this error and how we can solve it.

1.- Incompatible BW-runtime vs EAR versions

Usually, EAR files are compatible with different BusinessWorks runtimes, but this is true when the runtime is more current than the EAR. So I mean, if I generate my application with BWCE 2.5.0 I can run it with runtime 2.5.0, or 2.5.3 or 2.6.0 without any issue, but if I try to run it with an older version like 2.4.2 I can get this error because the EAR file has some “new things” that the runtime is not able to understand.

So it is important to validate that the runtime version that you are using is the expected one and updated it if that is not the case.

2.- XML special characters that need to be escaped

This situation is only true in versions before 2.5.0, but in case you are running an older version, you can also get this error because your property value has an XML character that needs to be escaped. Characters like ‘<’ or ‘&’ and the most used ones to generate this error. If you are using a more updated version you don’t need to escape it because they are automatically escaped.

So depending on the version that you are using update your property’s value accordingly.

Summary

I hope you find this interesting and if you are one of those facing this issue now you have information to not be stopped by this one. If you would like to submit your questions feel free to use one of the following options:

  • Twitter: You can send me a mention at @alexandrev on Twitter or a DM or even just using the hashtag #TIBFAQs that I will monitor.
  • Email: You can send me an email to alexandre.vazquez at gmail.com with your question.
  • Instagram: You can send me a DM on Instagram at @alexandrev
How to Fix “Failed to Read Profile from /tmp/tmp/pcf.substvar” in TIBCO BWCE
#TIBFAQS: Failed to read profile from [/tmp/tmp/pcf.substvar]

TIBCO Development FAQs, Solutions & Best Practices

TIBCO Development FAQs, Solutions & Best Practices

Improve your knowledge about TIBCO technology and also solve the issues that you are facing in your daily development tasks

TIBFAQS is here! This new year I would like to start several initiatives, and I hope you can walk with me during this journey. As you may know, I am a TIBCO Architect, so in my daily activities, I got a lot of questions and inquiries about how to do different things with TIBCO technology from TIBCO BusinessWorks to TIBCO EMS or TIBCO Spotfire.

This article is part of my comprehensive TIBCO Integration Platform Guide where you can find more patterns and best practices for TIBCO integration platforms.

I have noticed that some of these questions are similar from one customer to another, so I would like to use this platform to share all this knowledge to benefit in our daily activities and use the technology most efficiently.

1.- How is this going to work?

I will use some of the common topics that I am aware of in terms of TIBCO development questions and create a periodic article covering it with detail and with a sample application showing the problem and the solution. All the code will be available in my GitHub repository to use for your own reference.

https://github.com/alexandrev

2.- Can I send you my questions?

Yes, sure!! That should be amazing! As I said, I would like to create an engaging community around these posts so we all can benefit from there. So I would like to see your questions and to send them to me you can do it in the following ways:

  • Twitter: You can send me a mention at @alexandrev on Twitter or a DM or even just using the hashtag #TIBFAQs that I will monitor.
  • Email: You can send me an email to alexandre.vazquez at gmail.com with your question.
  • Instagram: You can send me a DM on Instagram at @alexandrev

3.- Where is this going to start?

This will start in late January. The idea is to have at least an article in a bi-weekly periodicity, but that will depend a lot on this initiative’s engagement. The more you share and talk about this initiative to your peers, and the more questions you send to me, the more articles I will create.

4.- What is next?

Since today you can start sending your questions and sharing your feedback about this initiative, and you can follow this blog to wait for the articles to come! Let’s do it together!

TIBCO Development FAQs, Solutions & Best Practices
Photo by Brett Jordan on Unsplash

Why Visual Diff Is Essential for Low-Code Development and Team Collaboration

Why Visual Diff Is Essential for Low-Code Development and Team Collaboration

Helping you excel using low code in distributed teams and parallel programming

Most enterprises are exploring low-code/no-code development now that the most important thing is to achieve agility on the technology artifacts from different perspectives (development, deployment, and operation).

This article is part of my comprehensive TIBCO Integration Platform Guide where you can find more patterns and best practices for TIBCO integration platforms.

The benefits of this way of working make this almost a no-brainer decision for most companies. We already covered them in a previous article. Take a look if you have not read it yet.

But we know that all new things come with their own challenges that we need to address and master in order to unleash the full benefits that these new paradigms or technologies are providing. Much like with cloud-native architecture, we need to be able to adapt.

Sometimes it is not the culture that we need to change. Sometimes the technology and the tools also need to evolve to address those challenges and help us on that journey. And this is how Visual Diff came into life.

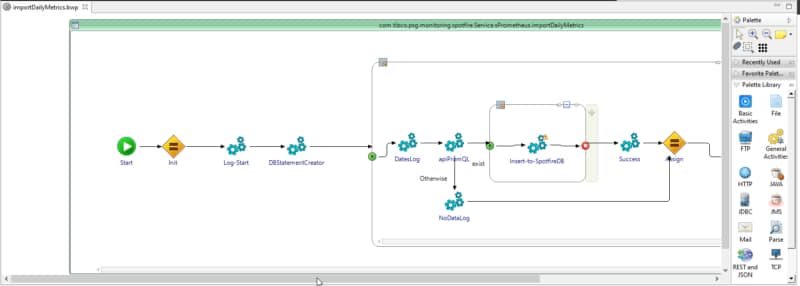
When you develop using a low-code approach, all the development process is easier. You need to combine different blocks that do the logic you need, and everything is simpler than a bunch of code lines.

Example of low-code development
Low-code development approach using TIBCO BusinessWorks.

But we also need to manage all these artifacts in a repository whereby all of them are focused on source code development. That means that when you are working with those tools at the end, you are not working with a “low-code approach” but rather a source code approach. Things like merging different branches and looking to the version history to know the changes are complex.

And they are complex because they are performed by the repository itself, which is focused on the file changes and the source code that changes. But one of the great benefits of low-code development is that the developer doesn’t need to be aware of the source code generated as part of the visual, faster activity. So, how can we solve that? What can we use to solve that?

Low-code technologies need to advance to take the lead here. For example, this is what TIBCO BusinessWorks has done with the release of their Visual Diff capability.

So, you still have your integration with your source code repository. You can do all the processes and activities you usually need to do in this kind of parallel distributed development. Still, you can also see all those activities from a “low-code” perspective.

That means that when I am taking a look at the version history, I can see the visual artifacts that have been modified. The activities added or deleted are shown there in a meaningful way for low-code development. That closes the loop about how low-code developments can take all the advantages of the modern source code repositories and their flows (GitFlow, GitHub Flow, One Flow, etc.) as well as the advantages of the low-code perspective.

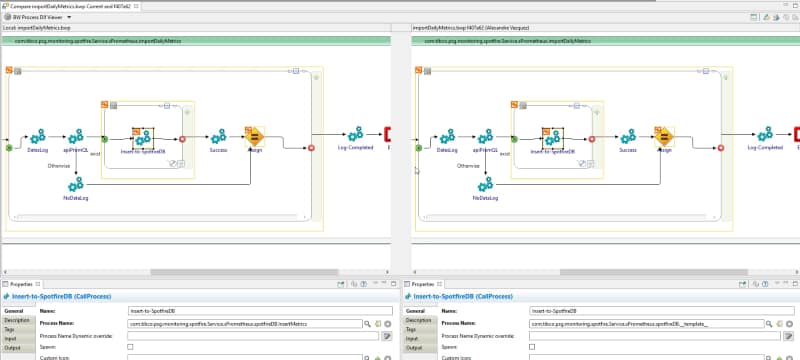
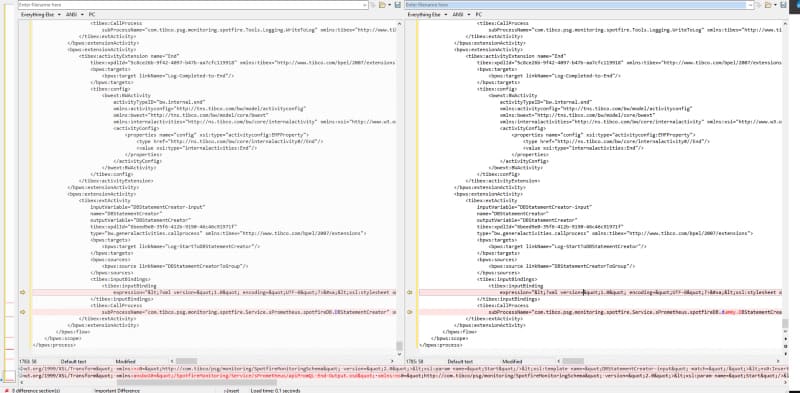
Let’s say there are two options with which you can see how an application has been changed. One is the traditional approach and the other uses the Visual Diff:

Visual Diff of your processes
Option A: Visual Diff of your processes
Same processes but with a Text Comparision approach
Option B: Same processes but with a Text Comparison approach

So, based on this evidence, what do you think is easier to understand? Even if you are a true coder as I am, we cannot deny the ease and benefits of the low-code approach for massive and standard development in the enterprise world.


Summary

No matter how fast we are developing with all the accelerators and frameworks that we have, a well-defined low-code application will be faster than any of us. It is the same battle that we had in the past with the Graphical Interfaces or mouse control versus the keyboard.

We accept that there is a personal preference to choose one or the other, but when we need to decide what is more effective and need to rely on the facts, we cannot be blind to what is in front of us.

I hope you have enjoyed this article. Have a nice day!

Kubernetes Batch Processing with TIBCO BusinessWorks: Jobs, Patterns, and Use Cases

Kubernetes Batch Processing with TIBCO BusinessWorks: Jobs, Patterns, and Use Cases
Table Of Contents

Add a header to begin generating the table of contents

We all know that in the rise of the cloud-native development and architectures, we’ve seen Kubernetes based platforms as the new standard all focusing on new developments following the new paradigms and best practices: Microservices, Event-Driven Architectures new shiny protocols like GraphQL or gRPC, and so on and so forth.

This article is part of my comprehensive TIBCO Integration Platform Guide where you can find more patterns and best practices for TIBCO integration platforms.

!– /wp:paragraph –>

Prometheus Monitoring in TIBCO Cloud Integration

Prometheus Monitoring in TIBCO Cloud Integration

In previous posts, I’ve explained how to integrate TIBCO BusinessWorks 6.x / BusinessWorks Container Edition (BWCE) applications with Prometheus, one of the most popular monitoring systems for cloud layers. Prometheus is one of the most widely used solutions to monitor your microservices inside a Kubernetes cluster. In this post, I will explain steps to leverage Prometheus for integrating with applications running on TIBCO Cloud Integration (TCI).

TCI is TIBCO’s iPaaS and primarily hides the application management complexity of an app from users. You need your packaged application (a.k.a EAR) and manifest.json — both generated by the product to simply deploy the application.

Isn’t it magical? Yes, it is! As explained in my previous post related to Prometheus integration with BWCE, which allows you to customize your base images, TCI allows integration with Prometheus in a slightly different manner. Let’s walk through the steps.

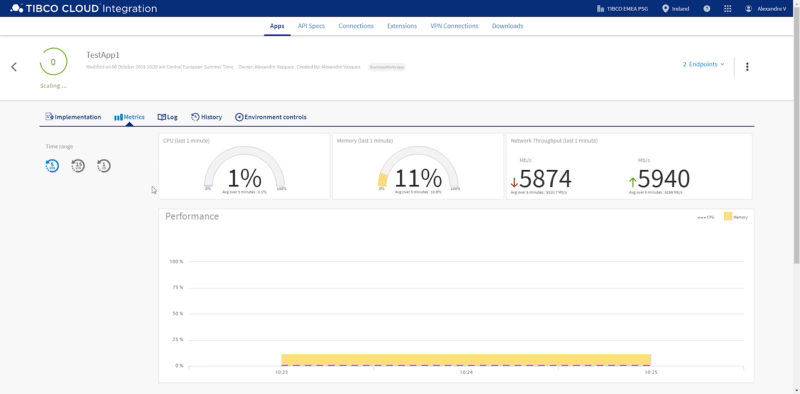
TCI has its own embedded monitoring tools (shown below) to provide insights into Memory and CPU utilization, plus network throughput, which is very useful.

While the monitoring metrics provided out-of-the-box by TCI are sufficient for most scenarios, there are hybrid connectivity use-cases (application running on-prem and microservices running on your own cluster that could be on a private or public cloud) that might require a unified single-pane view of monitoring.

Step one is to import the Prometheus plugin from the current GitHub location into your BusinessStudio workspace. To do that, you just need to clone the GitHub Repository available here: https://github.com/TIBCOSoftware/bw-tooling OR https://github.com/alexandrev/bw-tooling

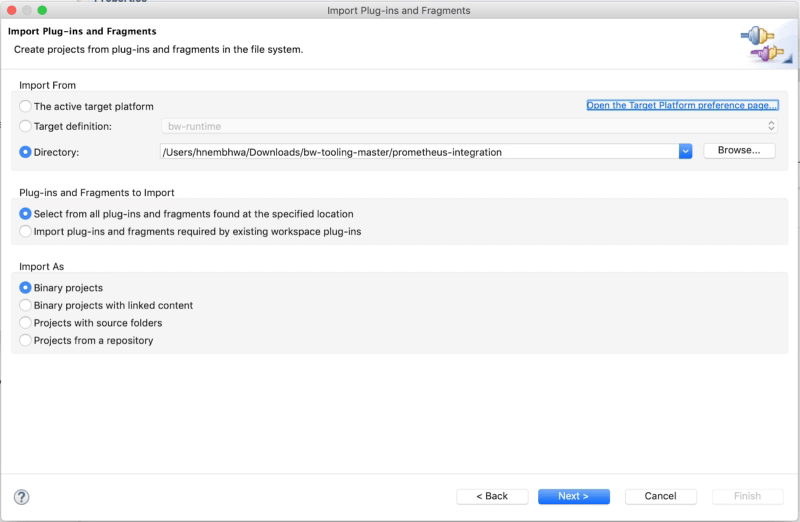
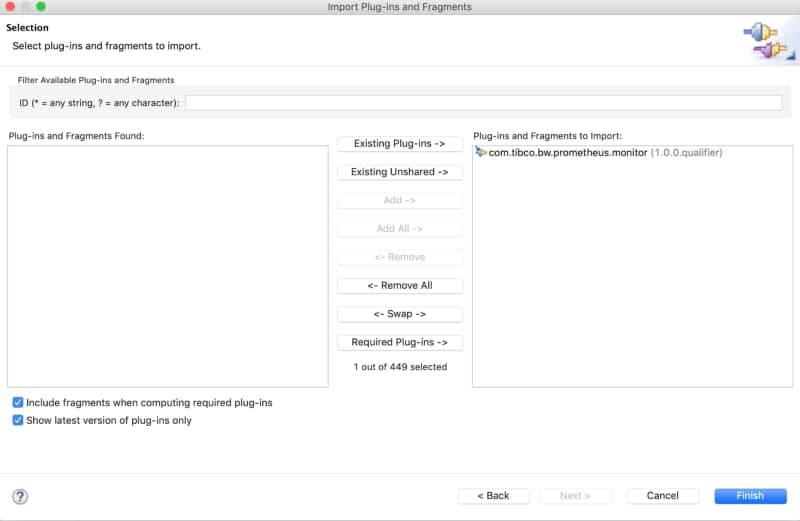
Import the Prometheus plugin by choosing Import → Plug-ins and Fragments option and specifying the directory downloaded from the above mentioned GitHub location. (shown below)

Prometheus Monitoring in TIBCO Cloud Integration

Step two involves adding the Prometheus module previously imported to the specific application as shown below:

Prometheus Monitoring in TIBCO Cloud Integration

Step three is just to build the EAR file along with manifest.json.

NOTE: If the EAR doesn’t get generated once you add the Prometheus plugin, please follow the below steps:

  • Export the project with the Prometheus module to a zip file.
  • Remove the Prometheus project from the workspace.
  • Import the project from the zip file generated before.

Before you deploy the BW application on TCI, we need to enable an additional port on TCI to scrape the Prometheus metrics.

Step four Updating manifest.json file.

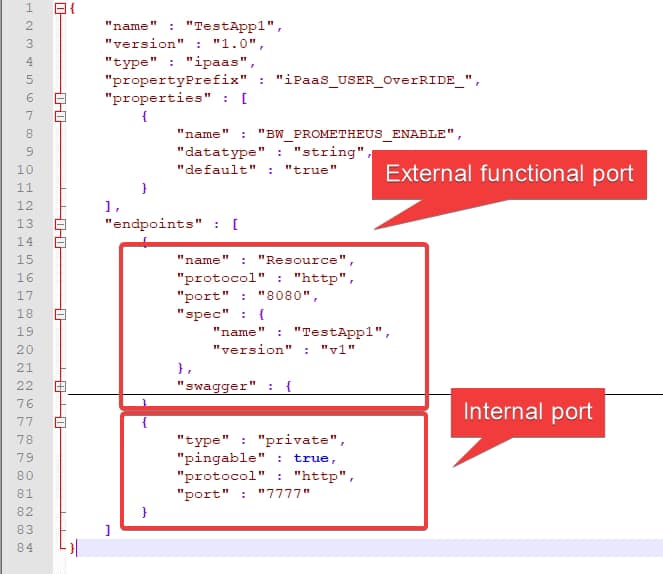
By default, a TCI app using the manifest.json file only exposes one port to be consumed from outside (related to functional services) and the other to be used internally for health checks.

Prometheus Monitoring in TIBCO Cloud Integration

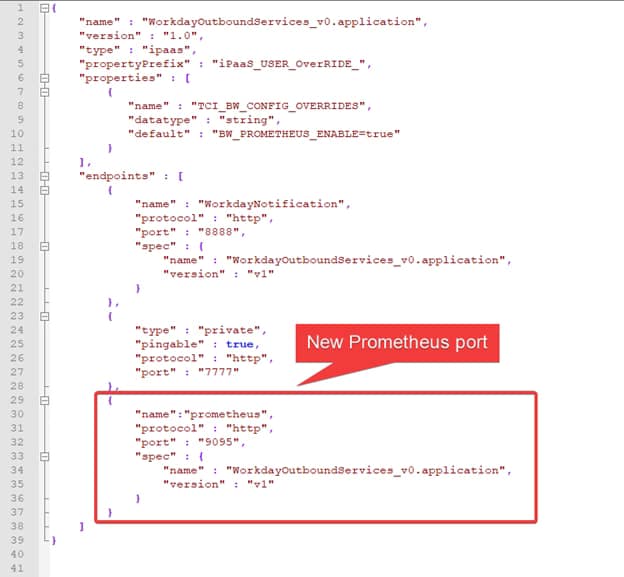
For Prometheus integration with TCI, we need an additional port listening on 9095, so Prometheus server can access the metrics endpoints to scrape the required metrics for our TCI application.

Note: This document does not cover the details on setting the Prometheus server (it is NOT needed for this PoC) but you can find the relevant information on https://prometheus.io/docs/prometheus/latest/installation/

We need to slightly modify the generated manifest.json file (of BW app) to expose an additional port, 9095 (shown below) .

Prometheus Monitoring in TIBCO Cloud Integration

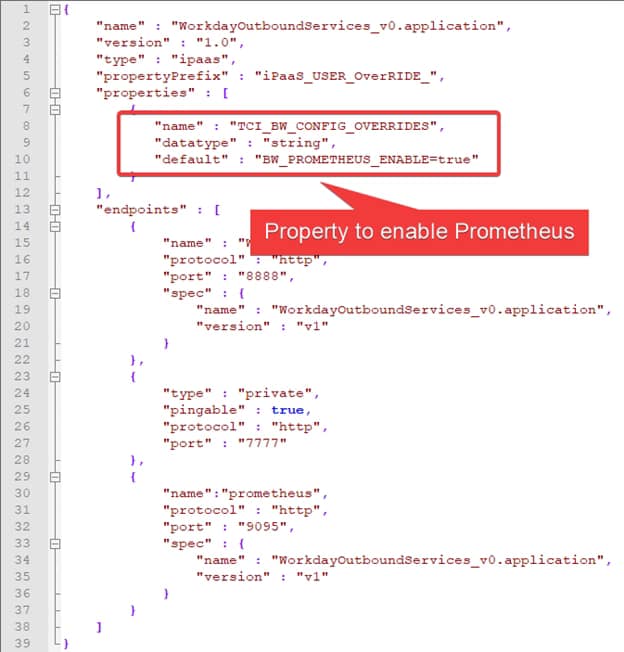
Also, to tell TCI that we want to enable Prometheus endpoint we need to set a property in the manifest.json file. The property is TCI_BW_CONFIG_OVERRIDES and provide the following value: BW_PROMETHEUS_ENABLE=true, as shown below:

Prometheus Monitoring in TIBCO Cloud Integration

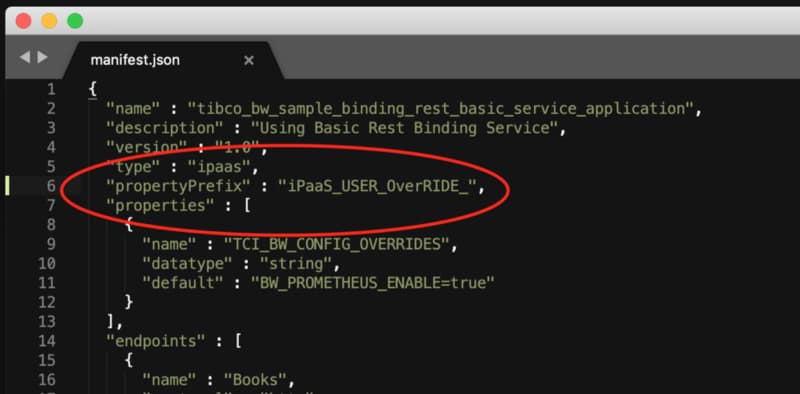
We also need to add an additional line (propertyPrefix) in the manifest.json file as shown below.

Prometheus Monitoring in TIBCO Cloud Integration

Now, we are ready to deploy the BW app on TCI and once it is deployed we can see there are two endpoints

Prometheus Monitoring in TIBCO Cloud Integration

If we expand the Endpoints options on the right (shown above), you can see that one of them is named “prometheus” and that’s our Prometheus metrics endpoint:

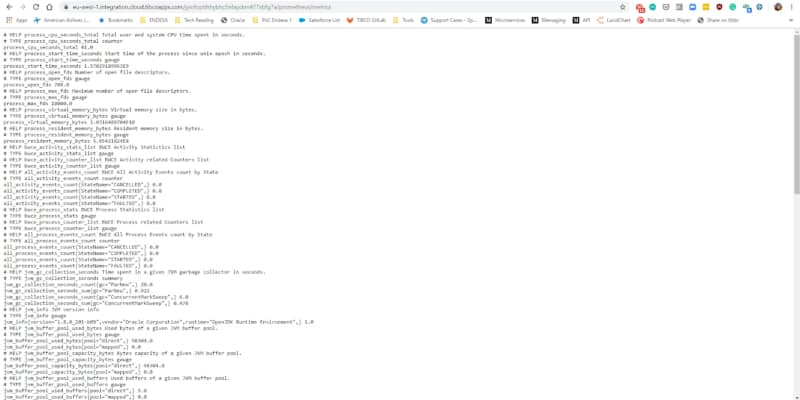
Just copy the prometheus URL and append it with /metrics (URL in the below snapshot) — this will display the Prometheus metrics for the specific BW app deployed on TCI.

Note: appending with /metrics is not compulsory, the as-is URL for Prometheus endpoint will also work.

Prometheus Monitoring in TIBCO Cloud Integration

In the list you will find the following kind of metrics to be able to create the most incredible dashboards and analysis based on that kind of information:

  • JVM metrics around memory used, GC performance and thread pools counts
  • CPU usage by the application
  • Process and Activity execution counts by Status (Started, Completed, Failed, Scheduled..)
  • Duration by Activity and Process.

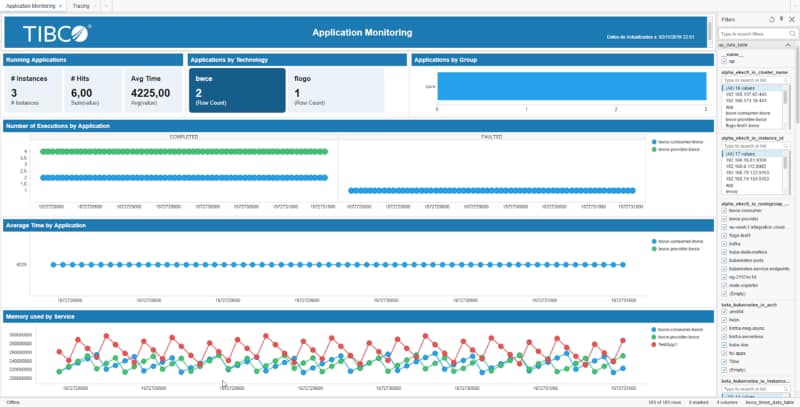
With all this available the information you can create dashboards similar to the one shown below, in this case using Spotfire as the Dashboard tool:

Prometheus Monitoring in TIBCO Cloud Integration

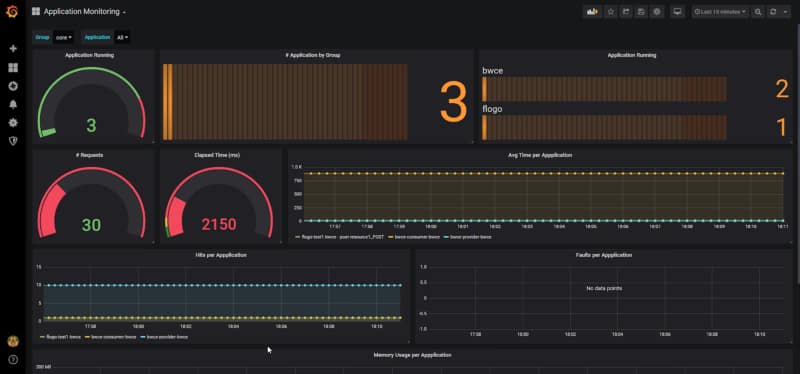
But you can also integrate those metrics with Grafana or any other tool that could read data from Prometheus time-series database.

Prometheus Monitoring in TIBCO Cloud Integration