Learn some tricks to analyze and optimize the usage that you are doing of the TSDB and save money on your cloud deployment.
In previous posts, we discussed how the storage layer worked for Prometheus and how effective it was. But in the current times, we are of cloud computing we know that each technical optimization is also a cost optimization as well and that is why we need to be very diligent about any option that we use regarding optimization.
We know that usually when we monitor using Prometheus we have so many exporters available at our disposal and also that each of them exposes a lot of very relevant metrics that we need to track everything we need to. But also, we should be aware that there are also metrics that we don’t need at this moment or we don’t plan to use it. So, if we are not planning to use, why do we want to waste disk space storing them?
So, let’s start taking a look at one of the exporters we have in our system. In my case, I would like to use a BusinessWorks Container Application that exposes metrics about its utilization. If you check their metrics endpoint you could see something like this:
# HELP jvm_info JVM version info
# TYPE jvm_info gauge
jvm_info{version="1.8.0_221-b27",vendor="Oracle Corporation",runtime="Java(TM) SE Runtime Environment",} 1.0
# HELP jvm_memory_bytes_used Used bytes of a given JVM memory area.
# TYPE jvm_memory_bytes_used gauge
jvm_memory_bytes_used{area="heap",} 1.0318492E8
jvm_memory_bytes_used{area="nonheap",} 1.52094712E8
# HELP jvm_memory_bytes_committed Committed (bytes) of a given JVM memory area.
# TYPE jvm_memory_bytes_committed gauge
jvm_memory_bytes_committed{area="heap",} 1.35266304E8
jvm_memory_bytes_committed{area="nonheap",} 1.71302912E8
# HELP jvm_memory_bytes_max Max (bytes) of a given JVM memory area.
# TYPE jvm_memory_bytes_max gauge
jvm_memory_bytes_max{area="heap",} 1.073741824E9
jvm_memory_bytes_max{area="nonheap",} -1.0
# HELP jvm_memory_bytes_init Initial bytes of a given JVM memory area.
# TYPE jvm_memory_bytes_init gauge
jvm_memory_bytes_init{area="heap",} 1.34217728E8
jvm_memory_bytes_init{area="nonheap",} 2555904.0
# HELP jvm_memory_pool_bytes_used Used bytes of a given JVM memory pool.
# TYPE jvm_memory_pool_bytes_used gauge
jvm_memory_pool_bytes_used{pool="Code Cache",} 3.3337536E7
jvm_memory_pool_bytes_used{pool="Metaspace",} 1.04914136E8
jvm_memory_pool_bytes_used{pool="Compressed Class Space",} 1.384304E7
jvm_memory_pool_bytes_used{pool="G1 Eden Space",} 3.3554432E7
jvm_memory_pool_bytes_used{pool="G1 Survivor Space",} 1048576.0
jvm_memory_pool_bytes_used{pool="G1 Old Gen",} 6.8581912E7
# HELP jvm_memory_pool_bytes_committed Committed bytes of a given JVM memory pool.
# TYPE jvm_memory_pool_bytes_committed gauge
jvm_memory_pool_bytes_committed{pool="Code Cache",} 3.3619968E7
jvm_memory_pool_bytes_committed{pool="Metaspace",} 1.19697408E8
jvm_memory_pool_bytes_committed{pool="Compressed Class Space",} 1.7985536E7
jvm_memory_pool_bytes_committed{pool="G1 Eden Space",} 4.6137344E7
jvm_memory_pool_bytes_committed{pool="G1 Survivor Space",} 1048576.0
jvm_memory_pool_bytes_committed{pool="G1 Old Gen",} 8.8080384E7
# HELP jvm_memory_pool_bytes_max Max bytes of a given JVM memory pool.
# TYPE jvm_memory_pool_bytes_max gauge
jvm_memory_pool_bytes_max{pool="Code Cache",} 2.5165824E8
jvm_memory_pool_bytes_max{pool="Metaspace",} -1.0
jvm_memory_pool_bytes_max{pool="Compressed Class Space",} 1.073741824E9
jvm_memory_pool_bytes_max{pool="G1 Eden Space",} -1.0
jvm_memory_pool_bytes_max{pool="G1 Survivor Space",} -1.0
jvm_memory_pool_bytes_max{pool="G1 Old Gen",} 1.073741824E9
# HELP jvm_memory_pool_bytes_init Initial bytes of a given JVM memory pool.
# TYPE jvm_memory_pool_bytes_init gauge
jvm_memory_pool_bytes_init{pool="Code Cache",} 2555904.0
jvm_memory_pool_bytes_init{pool="Metaspace",} 0.0
jvm_memory_pool_bytes_init{pool="Compressed Class Space",} 0.0
jvm_memory_pool_bytes_init{pool="G1 Eden Space",} 7340032.0
jvm_memory_pool_bytes_init{pool="G1 Survivor Space",} 0.0
jvm_memory_pool_bytes_init{pool="G1 Old Gen",} 1.26877696E8
# HELP jvm_buffer_pool_used_bytes Used bytes of a given JVM buffer pool.
# TYPE jvm_buffer_pool_used_bytes gauge
jvm_buffer_pool_used_bytes{pool="direct",} 148590.0
jvm_buffer_pool_used_bytes{pool="mapped",} 0.0
# HELP jvm_buffer_pool_capacity_bytes Bytes capacity of a given JVM buffer pool.
# TYPE jvm_buffer_pool_capacity_bytes gauge
jvm_buffer_pool_capacity_bytes{pool="direct",} 148590.0
jvm_buffer_pool_capacity_bytes{pool="mapped",} 0.0
# HELP jvm_buffer_pool_used_buffers Used buffers of a given JVM buffer pool.
# TYPE jvm_buffer_pool_used_buffers gauge
jvm_buffer_pool_used_buffers{pool="direct",} 19.0
jvm_buffer_pool_used_buffers{pool="mapped",} 0.0
# HELP jvm_classes_loaded The number of classes that are currently loaded in the JVM
# TYPE jvm_classes_loaded gauge
jvm_classes_loaded 16993.0
# HELP jvm_classes_loaded_total The total number of classes that have been loaded since the JVM has started execution
# TYPE jvm_classes_loaded_total counter
jvm_classes_loaded_total 17041.0
# HELP jvm_classes_unloaded_total The total number of classes that have been unloaded since the JVM has started execution
# TYPE jvm_classes_unloaded_total counter
jvm_classes_unloaded_total 48.0
# HELP bwce_activity_stats_list BWCE Activity Statictics list
# TYPE bwce_activity_stats_list gauge
# HELP bwce_activity_counter_list BWCE Activity related Counters list
# TYPE bwce_activity_counter_list gauge
# HELP all_activity_events_count BWCE All Activity Events count by State
# TYPE all_activity_events_count counter
all_activity_events_count{StateName="CANCELLED",} 0.0
all_activity_events_count{StateName="COMPLETED",} 0.0
all_activity_events_count{StateName="STARTED",} 0.0
all_activity_events_count{StateName="FAULTED",} 0.0
# HELP activity_events_count BWCE All Activity Events count by Process, Activity State
# TYPE activity_events_count counter
# HELP activity_total_evaltime_count BWCE Activity EvalTime  by Process and Activity
# TYPE activity_total_evaltime_count counter
# HELP activity_total_duration_count BWCE Activity DurationTime by Process and Activity
# TYPE activity_total_duration_count counter
# HELP bwpartner_instance:total_request Total Request for the partner invocation which mapped from the activities
# TYPE bwpartner_instance:total_request counter
# HELP bwpartner_instance:total_duration_ms Total Duration for the partner invocation which mapped from the activities (execution or latency)
# TYPE bwpartner_instance:total_duration_ms counter
# HELP bwce_process_stats BWCE Process Statistics list
# TYPE bwce_process_stats gauge
# HELP bwce_process_counter_list BWCE Process related Counters list
# TYPE bwce_process_counter_list gauge
# HELP all_process_events_count BWCE All Process Events count by State
# TYPE all_process_events_count counter
all_process_events_count{StateName="CANCELLED",} 0.0
all_process_events_count{StateName="COMPLETED",} 0.0
all_process_events_count{StateName="STARTED",} 0.0
all_process_events_count{StateName="FAULTED",} 0.0
# HELP process_events_count BWCE Process Events count by Operation
# TYPE process_events_count counter
# HELP process_duration_seconds_total BWCE Process Events duration by Operation in seconds
# TYPE process_duration_seconds_total counter
# HELP process_duration_milliseconds_total BWCE Process Events duration by Operation in milliseconds
# TYPE process_duration_milliseconds_total counter
# HELP bwdefinitions:partner BWCE Process Events count by Operation
# TYPE bwdefinitions:partner counter
bwdefinitions:partner{ProcessName="t1.module.item.getTransactionData",ActivityName="FTLPublisher",ServiceName="GetCustomer360",OperationName="GetDataOperation",PartnerService="TransactionService",PartnerOperation="GetTransactionsOperation",Location="internal",PartnerMiddleware="MW",} 1.0
bwdefinitions:partner{ProcessName=" t1.module.item.auditProcess",ActivityName="KafkaSendMessage",ServiceName="GetCustomer360",OperationName="GetDataOperation",PartnerService="AuditService",PartnerOperation="AuditOperation",Location="internal",PartnerMiddleware="MW",} 1.0
bwdefinitions:partner{ProcessName="t1.module.item.getCustomerData",ActivityName="JMSRequestReply",ServiceName="GetCustomer360",OperationName="GetDataOperation",PartnerService="CustomerService",PartnerOperation="GetCustomerDetailsOperation",Location="internal",PartnerMiddleware="MW",} 1.0
# HELP bwdefinitions:binding BW Design Time Repository - binding/transport definition
# TYPE bwdefinitions:binding counter
bwdefinitions:binding{ServiceName="GetCustomer360",OperationName="GetDataOperation",ServiceInterface="GetCustomer360:GetDataOperation",Binding="/customer",Transport="HTTP",} 1.0
# HELP bwdefinitions:service BW Design Time Repository - Service definition
# TYPE bwdefinitions:service counter
bwdefinitions:service{ProcessName="t1.module.sub.item.getCustomerData",ServiceName="GetCustomer360",OperationName="GetDataOperation",ServiceInstance="GetCustomer360:GetDataOperation",} 1.0
bwdefinitions:service{ProcessName="t1.module.sub.item.auditProcess",ServiceName="GetCustomer360",OperationName="GetDataOperation",ServiceInstance="GetCustomer360:GetDataOperation",} 1.0
bwdefinitions:service{ProcessName="t1.module.sub.orchestratorSubFlow",ServiceName="GetCustomer360",OperationName="GetDataOperation",ServiceInstance="GetCustomer360:GetDataOperation",} 1.0
bwdefinitions:service{ProcessName="t1.module.Process",ServiceName="GetCustomer360",OperationName="GetDataOperation",ServiceInstance="GetCustomer360:GetDataOperation",} 1.0
# HELP bwdefinitions:gateway BW Design Time Repository - Gateway definition
# TYPE bwdefinitions:gateway counter
bwdefinitions:gateway{ServiceName="GetCustomer360",OperationName="GetDataOperation",ServiceInstance="GetCustomer360:GetDataOperation",Endpoint="bwce-demo-mon-orchestrator-bwce",InteractionType="ISTIO",} 1.0
# HELP process_cpu_seconds_total Total user and system CPU time spent in seconds.
# TYPE process_cpu_seconds_total counter
process_cpu_seconds_total 1956.86
# HELP process_start_time_seconds Start time of the process since unix epoch in seconds.
# TYPE process_start_time_seconds gauge
process_start_time_seconds 1.604712447107E9
# HELP process_open_fds Number of open file descriptors.
# TYPE process_open_fds gauge
process_open_fds 763.0
# HELP process_max_fds Maximum number of open file descriptors.
# TYPE process_max_fds gauge
process_max_fds 1048576.0
# HELP process_virtual_memory_bytes Virtual memory size in bytes.
# TYPE process_virtual_memory_bytes gauge
process_virtual_memory_bytes 3.046207488E9
# HELP process_resident_memory_bytes Resident memory size in bytes.
# TYPE process_resident_memory_bytes gauge
process_resident_memory_bytes 4.2151936E8
# HELP jvm_gc_collection_seconds Time spent in a given JVM garbage collector in seconds.
# TYPE jvm_gc_collection_seconds summary
jvm_gc_collection_seconds_count{gc="G1 Young Generation",} 540.0
jvm_gc_collection_seconds_sum{gc="G1 Young Generation",} 4.754
jvm_gc_collection_seconds_count{gc="G1 Old Generation",} 2.0
jvm_gc_collection_seconds_sum{gc="G1 Old Generation",} 0.563
# HELP jvm_threads_current Current thread count of a JVM
# TYPE jvm_threads_current gauge
jvm_threads_current 98.0
# HELP jvm_threads_daemon Daemon thread count of a JVM
# TYPE jvm_threads_daemon gauge
jvm_threads_daemon 43.0
# HELP jvm_threads_peak Peak thread count of a JVM
# TYPE jvm_threads_peak gauge
jvm_threads_peak 98.0
# HELP jvm_threads_started_total Started thread count of a JVM
# TYPE jvm_threads_started_total counter
jvm_threads_started_total 109.0
# HELP jvm_threads_deadlocked Cycles of JVM-threads that are in deadlock waiting to acquire object monitors or ownable synchronizers
# TYPE jvm_threads_deadlocked gauge
jvm_threads_deadlocked 0.0
# HELP jvm_threads_deadlocked_monitor Cycles of JVM-threads that are in deadlock waiting to acquire object monitors
# TYPE jvm_threads_deadlocked_monitor gauge
jvm_threads_deadlocked_monitor 0.0
As you can see a lot of metrics but I have to be honest I am not using most of them in my dashboards and to generate my alerts. I can use the metrics regarding the application performance for each of the BusinessWorks process and its activities, also the JVM memory performance and number of threads but things like how the JVM GC is working for each of the layers of the JVM (G1 Young Generation, G1 Old Generation) I’m not using them at all.
So, If I show the same metric endpoint highlighting the things that I am not using it would be something like this:
# HELP jvm_info JVM version info
# TYPE jvm_info gauge
jvm_info{version="1.8.0_221-b27",vendor="Oracle Corporation",runtime="Java(TM) SE Runtime Environment",} 1.0
# HELP jvm_memory_bytes_used Used bytes of a given JVM memory area.
# TYPE jvm_memory_bytes_used gauge
jvm_memory_bytes_used{area="heap",} 1.0318492E8
jvm_memory_bytes_used{area="nonheap",} 1.52094712E8
# HELP jvm_memory_bytes_committed Committed (bytes) of a given JVM memory area.
# TYPE jvm_memory_bytes_committed gauge
jvm_memory_bytes_committed{area="heap",} 1.35266304E8
jvm_memory_bytes_committed{area="nonheap",} 1.71302912E8
# HELP jvm_memory_bytes_max Max (bytes) of a given JVM memory area.
# TYPE jvm_memory_bytes_max gauge
jvm_memory_bytes_max{area="heap",} 1.073741824E9
jvm_memory_bytes_max{area="nonheap",} -1.0
# HELP jvm_memory_bytes_init Initial bytes of a given JVM memory area.
# TYPE jvm_memory_bytes_init gauge
jvm_memory_bytes_init{area="heap",} 1.34217728E8
jvm_memory_bytes_init{area="nonheap",} 2555904.0
# HELP jvm_memory_pool_bytes_used Used bytes of a given JVM memory pool.
# TYPE jvm_memory_pool_bytes_used gauge
jvm_memory_pool_bytes_used{pool="Code Cache",} 3.3337536E7
jvm_memory_pool_bytes_used{pool="Metaspace",} 1.04914136E8
jvm_memory_pool_bytes_used{pool="Compressed Class Space",} 1.384304E7
jvm_memory_pool_bytes_used{pool="G1 Eden Space",} 3.3554432E7
jvm_memory_pool_bytes_used{pool="G1 Survivor Space",} 1048576.0
jvm_memory_pool_bytes_used{pool="G1 Old Gen",} 6.8581912E7
# HELP jvm_memory_pool_bytes_committed Committed bytes of a given JVM memory pool.
# TYPE jvm_memory_pool_bytes_committed gauge
jvm_memory_pool_bytes_committed{pool="Code Cache",} 3.3619968E7
jvm_memory_pool_bytes_committed{pool="Metaspace",} 1.19697408E8
jvm_memory_pool_bytes_committed{pool="Compressed Class Space",} 1.7985536E7
jvm_memory_pool_bytes_committed{pool="G1 Eden Space",} 4.6137344E7
jvm_memory_pool_bytes_committed{pool="G1 Survivor Space",} 1048576.0
jvm_memory_pool_bytes_committed{pool="G1 Old Gen",} 8.8080384E7
# HELP jvm_memory_pool_bytes_max Max bytes of a given JVM memory pool.
# TYPE jvm_memory_pool_bytes_max gauge
jvm_memory_pool_bytes_max{pool="Code Cache",} 2.5165824E8
jvm_memory_pool_bytes_max{pool="Metaspace",} -1.0
jvm_memory_pool_bytes_max{pool="Compressed Class Space",} 1.073741824E9
jvm_memory_pool_bytes_max{pool="G1 Eden Space",} -1.0
jvm_memory_pool_bytes_max{pool="G1 Survivor Space",} -1.0
jvm_memory_pool_bytes_max{pool="G1 Old Gen",} 1.073741824E9
# HELP jvm_memory_pool_bytes_init Initial bytes of a given JVM memory pool.
# TYPE jvm_memory_pool_bytes_init gauge
jvm_memory_pool_bytes_init{pool="Code Cache",} 2555904.0
jvm_memory_pool_bytes_init{pool="Metaspace",} 0.0
jvm_memory_pool_bytes_init{pool="Compressed Class Space",} 0.0
jvm_memory_pool_bytes_init{pool="G1 Eden Space",} 7340032.0
jvm_memory_pool_bytes_init{pool="G1 Survivor Space",} 0.0
jvm_memory_pool_bytes_init{pool="G1 Old Gen",} 1.26877696E8
# HELP jvm_buffer_pool_used_bytes Used bytes of a given JVM buffer pool.
# TYPE jvm_buffer_pool_used_bytes gauge
jvm_buffer_pool_used_bytes{pool="direct",} 148590.0
jvm_buffer_pool_used_bytes{pool="mapped",} 0.0
# HELP jvm_buffer_pool_capacity_bytes Bytes capacity of a given JVM buffer pool.
# TYPE jvm_buffer_pool_capacity_bytes gauge
jvm_buffer_pool_capacity_bytes{pool="direct",} 148590.0
jvm_buffer_pool_capacity_bytes{pool="mapped",} 0.0
# HELP jvm_buffer_pool_used_buffers Used buffers of a given JVM buffer pool.
# TYPE jvm_buffer_pool_used_buffers gauge
jvm_buffer_pool_used_buffers{pool="direct",} 19.0
jvm_buffer_pool_used_buffers{pool="mapped",} 0.0
# HELP jvm_classes_loaded The number of classes that are currently loaded in the JVM
# TYPE jvm_classes_loaded gauge
jvm_classes_loaded 16993.0
# HELP jvm_classes_loaded_total The total number of classes that have been loaded since the JVM has started execution
# TYPE jvm_classes_loaded_total counter
jvm_classes_loaded_total 17041.0
# HELP jvm_classes_unloaded_total The total number of classes that have been unloaded since the JVM has started execution
# TYPE jvm_classes_unloaded_total counter
jvm_classes_unloaded_total 48.0
# HELP bwce_activity_stats_list BWCE Activity Statictics list
# TYPE bwce_activity_stats_list gauge
# HELP bwce_activity_counter_list BWCE Activity related Counters list
# TYPE bwce_activity_counter_list gauge
# HELP all_activity_events_count BWCE All Activity Events count by State
# TYPE all_activity_events_count counter
all_activity_events_count{StateName="CANCELLED",} 0.0
all_activity_events_count{StateName="COMPLETED",} 0.0
all_activity_events_count{StateName="STARTED",} 0.0
all_activity_events_count{StateName="FAULTED",} 0.0
# HELP activity_events_count BWCE All Activity Events count by Process, Activity State
# TYPE activity_events_count counter
# HELP activity_total_evaltime_count BWCE Activity EvalTime  by Process and Activity
# TYPE activity_total_evaltime_count counter
# HELP activity_total_duration_count BWCE Activity DurationTime by Process and Activity
# TYPE activity_total_duration_count counter
# HELP bwpartner_instance:total_request Total Request for the partner invocation which mapped from the activities
# TYPE bwpartner_instance:total_request counter
# HELP bwpartner_instance:total_duration_ms Total Duration for the partner invocation which mapped from the activities (execution or latency)
# TYPE bwpartner_instance:total_duration_ms counter
# HELP bwce_process_stats BWCE Process Statistics list
# TYPE bwce_process_stats gauge
# HELP bwce_process_counter_list BWCE Process related Counters list
# TYPE bwce_process_counter_list gauge
# HELP all_process_events_count BWCE All Process Events count by State
# TYPE all_process_events_count counter
all_process_events_count{StateName="CANCELLED",} 0.0
all_process_events_count{StateName="COMPLETED",} 0.0
all_process_events_count{StateName="STARTED",} 0.0
all_process_events_count{StateName="FAULTED",} 0.0
# HELP process_events_count BWCE Process Events count by Operation
# TYPE process_events_count counter
# HELP process_duration_seconds_total BWCE Process Events duration by Operation in seconds
# TYPE process_duration_seconds_total counter
# HELP process_duration_milliseconds_total BWCE Process Events duration by Operation in milliseconds
# TYPE process_duration_milliseconds_total counter
# HELP bwdefinitions:partner BWCE Process Events count by Operation
# TYPE bwdefinitions:partner counter
bwdefinitions:partner{ProcessName="t1.module.item.getTransactionData",ActivityName="FTLPublisher",ServiceName="GetCustomer360",OperationName="GetDataOperation",PartnerService="TransactionService",PartnerOperation="GetTransactionsOperation",Location="internal",PartnerMiddleware="MW",} 1.0
bwdefinitions:partner{ProcessName=" t1.module.item.auditProcess",ActivityName="KafkaSendMessage",ServiceName="GetCustomer360",OperationName="GetDataOperation",PartnerService="AuditService",PartnerOperation="AuditOperation",Location="internal",PartnerMiddleware="MW",} 1.0
bwdefinitions:partner{ProcessName="t1.module.item.getCustomerData",ActivityName="JMSRequestReply",ServiceName="GetCustomer360",OperationName="GetDataOperation",PartnerService="CustomerService",PartnerOperation="GetCustomerDetailsOperation",Location="internal",PartnerMiddleware="MW",} 1.0
# HELP bwdefinitions:binding BW Design Time Repository - binding/transport definition
# TYPE bwdefinitions:binding counter
bwdefinitions:binding{ServiceName="GetCustomer360",OperationName="GetDataOperation",ServiceInterface="GetCustomer360:GetDataOperation",Binding="/customer",Transport="HTTP",} 1.0
# HELP bwdefinitions:service BW Design Time Repository - Service definition
# TYPE bwdefinitions:service counter
bwdefinitions:service{ProcessName="t1.module.sub.item.getCustomerData",ServiceName="GetCustomer360",OperationName="GetDataOperation",ServiceInstance="GetCustomer360:GetDataOperation",} 1.0
bwdefinitions:service{ProcessName="t1.module.sub.item.auditProcess",ServiceName="GetCustomer360",OperationName="GetDataOperation",ServiceInstance="GetCustomer360:GetDataOperation",} 1.0
bwdefinitions:service{ProcessName="t1.module.sub.orchestratorSubFlow",ServiceName="GetCustomer360",OperationName="GetDataOperation",ServiceInstance="GetCustomer360:GetDataOperation",} 1.0
bwdefinitions:service{ProcessName="t1.module.Process",ServiceName="GetCustomer360",OperationName="GetDataOperation",ServiceInstance="GetCustomer360:GetDataOperation",} 1.0
# HELP bwdefinitions:gateway BW Design Time Repository - Gateway definition
# TYPE bwdefinitions:gateway counter
bwdefinitions:gateway{ServiceName="GetCustomer360",OperationName="GetDataOperation",ServiceInstance="GetCustomer360:GetDataOperation",Endpoint="bwce-demo-mon-orchestrator-bwce",InteractionType="ISTIO",} 1.0
# HELP process_cpu_seconds_total Total user and system CPU time spent in seconds.
# TYPE process_cpu_seconds_total counter
process_cpu_seconds_total 1956.86
# HELP process_start_time_seconds Start time of the process since unix epoch in seconds.
# TYPE process_start_time_seconds gauge
process_start_time_seconds 1.604712447107E9
# HELP process_open_fds Number of open file descriptors.
# TYPE process_open_fds gauge
process_open_fds 763.0
# HELP process_max_fds Maximum number of open file descriptors.
# TYPE process_max_fds gauge
process_max_fds 1048576.0
# HELP process_virtual_memory_bytes Virtual memory size in bytes.
# TYPE process_virtual_memory_bytes gauge
process_virtual_memory_bytes 3.046207488E9
# HELP process_resident_memory_bytes Resident memory size in bytes.
# TYPE process_resident_memory_bytes gauge
process_resident_memory_bytes 4.2151936E8
# HELP jvm_gc_collection_seconds Time spent in a given JVM garbage collector in seconds.
# TYPE jvm_gc_collection_seconds summary
jvm_gc_collection_seconds_count{gc="G1 Young Generation",} 540.0
jvm_gc_collection_seconds_sum{gc="G1 Young Generation",} 4.754
jvm_gc_collection_seconds_count{gc="G1 Old Generation",} 2.0
jvm_gc_collection_seconds_sum{gc="G1 Old Generation",} 0.563
# HELP jvm_threads_current Current thread count of a JVM
# TYPE jvm_threads_current gauge
jvm_threads_current 98.0
# HELP jvm_threads_daemon Daemon thread count of a JVM
# TYPE jvm_threads_daemon gauge
jvm_threads_daemon 43.0
# HELP jvm_threads_peak Peak thread count of a JVM
# TYPE jvm_threads_peak gauge
jvm_threads_peak 98.0
# HELP jvm_threads_started_total Started thread count of a JVM
# TYPE jvm_threads_started_total counter
jvm_threads_started_total 109.0
# HELP jvm_threads_deadlocked Cycles of JVM-threads that are in deadlock waiting to acquire object monitors or ownable synchronizers
# TYPE jvm_threads_deadlocked gauge
jvm_threads_deadlocked 0.0
# HELP jvm_threads_deadlocked_monitor Cycles of JVM-threads that are in deadlock waiting to acquire object monitors
# TYPE jvm_threads_deadlocked_monitor gauge
jvm_threads_deadlocked_monitor 0.0
So, it can be a 50% of the metric endpoint response the part that I’m not using, so, why I am using disk space that I am paying for to storing it? And this is just for a “critical exporter”, one that I try to use as much information as possible, but think about how many exporters do you have and how much information you use for each of them.
Ok, so now the purpose and the motivation of this post are clear, but what we can do about it?
Discovering the REST API
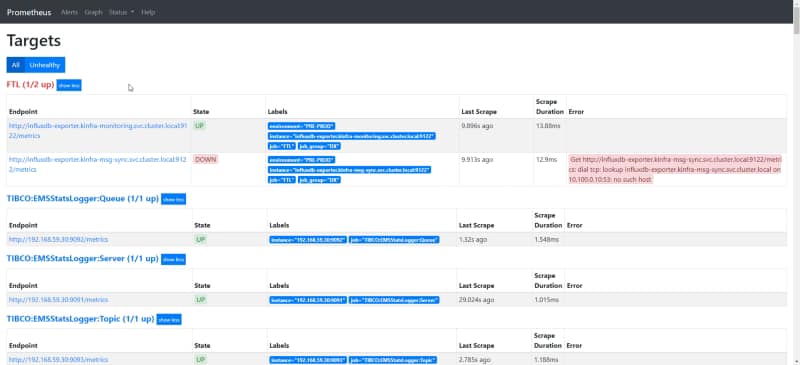
Prometheus has an awesome REST API to expose all the information that you can wish about. If you have ever use the Graphical Interface for Prometheus (shown below) you are using the REST API because this is why is behind it.
We have all the documentation regarding the REST API in the Prometheus official documentation:
https://prometheus.io/docs/prometheus/latest/querying/api/
But what is this API providing us in terms of the time-series database TSDB that Prometheus is using?
TSDB Admin APIs
We have a specific API to manage the performance of the TSDB database but in order to be able to use it, we need to enable the Admin API. And that is done by providing the following flag where we are launching the Prometheus server --web.enable-admin-api.
If we are using the Prometheus Operator Helm Chart to deploy this we need to use the following item in our values.yaml
## EnableAdminAPI enables Prometheus the administrative HTTP API which includes functionality such as deleting time series.
## This is disabled by default.
## ref: https://prometheus.io/docs/prometheus/latest/querying/api/#tsdb-admin-apis
##    enableAdminAPI: true
We have a lot of options enable when we enable this administrative API but today we are going to focus on a single REST operation that is the “stats”. This is the only method related to TSDB that it doesn’t require to enable the Admin API. This operation, as we can read in the Prometheus documentation, returns the following items:
headStats: This provides the following data about the head block of the TSDB:
- numSeries: The number of series.
- chunkCount: The number of chunks.
- minTime: The current minimum timestamp in milliseconds.
- maxTime: The current maximum timestamp in milliseconds.
seriesCountByMetricName: This will provide a list of metrics names and their series count.
labelValueCountByLabelName: This will provide a list of the label names and their value count.
memoryInBytesByLabelName This will provide a list of the label names and memory used in bytes. Memory usage is calculated by adding the length of all values for a given label name.
seriesCountByLabelPair This will provide a list of label value pairs and their series count.
To access to that API we need to hit the following endpoint:
GET /api/v1/status/tsdbSo, when I am doing that in my Prometheus deployment I get something similar to this:
{
   "status":"success",
   "data":{
      "seriesCountByMetricName":[
         {
            "name":"apiserver_request_duration_seconds_bucket",
            "value":34884
         },
         {
            "name":"apiserver_request_latencies_bucket",
            "value":7344
         },
         {
            "name":"etcd_request_duration_seconds_bucket",
            "value":6000
         },
         {
            "name":"apiserver_response_sizes_bucket",
            "value":3888
         },
         {
            "name":"apiserver_request_latencies_summary",
            "value":2754
         },
         {
            "name":"etcd_request_latencies_summary",
            "value":1500
         },
         {
            "name":"apiserver_request_count",
            "value":1216
         },
         {
            "name":"apiserver_request_total",
            "value":1216
         },
         {
            "name":"container_tasks_state",
            "value":1140
         },
         {
            "name":"apiserver_request_latencies_count",
            "value":918
         }
      ],
      "labelValueCountByLabelName":[
         {
            "name":"__name__",
            "value":2374
         },
         {
            "name":"id",
            "value":210
         },
         {
            "name":"mountpoint",
            "value":208
         },
         {
            "name":"le",
            "value":195
         },
         {
            "name":"type",
            "value":185
         },
         {
            "name":"name",
            "value":181
         },
         {
            "name":"resource",
            "value":170
         },
         {
            "name":"secret",
            "value":168
         },
         {
            "name":"image",
            "value":107
         },
         {
            "name":"container_id",
            "value":97
         }
      ],
      "memoryInBytesByLabelName":[
         {
            "name":"__name__",
            "value":97729
         },
         {
            "name":"id",
            "value":21450
         },
         {
            "name":"mountpoint",
            "value":18123
         },
         {
            "name":"name",
            "value":13831
         },
         {
            "name":"image",
            "value":8005
         },
         {
            "name":"container_id",
            "value":7081
         },
         {
            "name":"image_id",
            "value":6872
         },
         {
            "name":"secret",
            "value":5054
         },
         {
            "name":"type",
            "value":4613
         },
         {
            "name":"resource",
            "value":3459
         }
      ],
      "seriesCountByLabelValuePair":[
         {
            "name":"namespace=default",
            "value":72064
         },
         {
            "name":"service=kubernetes",
            "value":70921
         },
         {
            "name":"endpoint=https",
            "value":70917
         },
         {
            "name":"job=apiserver",
            "value":70917
         },
         {
            "name":"component=apiserver",
            "value":57992
         },
         {
            "name":"instance=192.168.185.199:443",
            "value":40343
         },
         {
            "name":"__name__=apiserver_request_duration_seconds_bucket",
            "value":34884
         },
         {
            "name":"version=v1",
            "value":31152
         },
         {
            "name":"instance=192.168.112.31:443",
            "value":30574
         },
         {
            "name":"scope=cluster",
            "value":29713
         }
      ]
   }
}
We can also check the same information if we use the new and experimental React User Interface on the following endpoint:
/new/tsdb-status
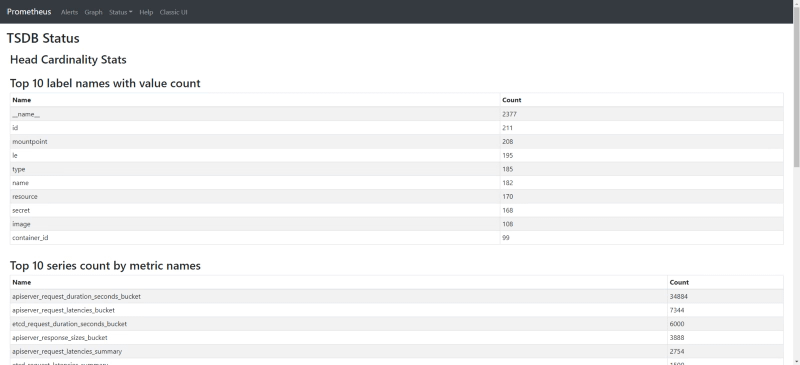
So, with that, you will get the Top 10 series and labels that are inside your time-series database, so in case, some of them are not useful you can just get rid of them using the normal approaches to drop a series or a label. This is great, but what if all the ones shown here are relevant, what can we do about it?
Mmmm, maybe we can use PromQL to monitor this (dogfodding approach). So if we would like to extract the same information but using PromQL we can do it with the following query:
topk(10, count by (__name__)({__name__=~".+"}))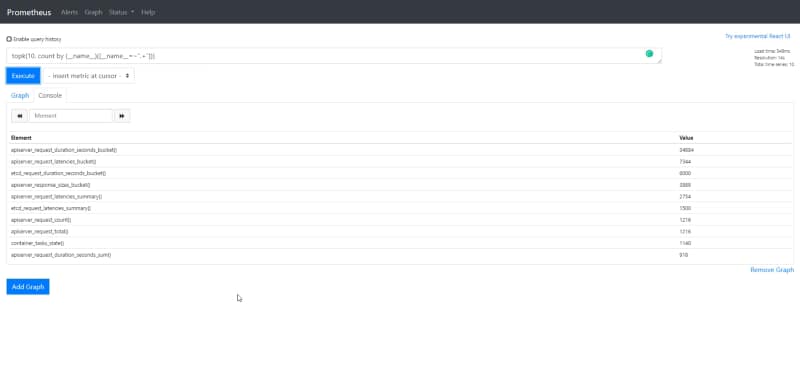
And now we have all the power at my hands. For example, let’s take a look not at the 10 more relevant but the 100 more relevants or any other filter that we need to apply. For example, let’s see the metrics regarding with the JVM that we discussed at the beginning. And we will do that with the following PromQL query:
topk(100, count by (__name__)({__name__=~"jvm.+"}))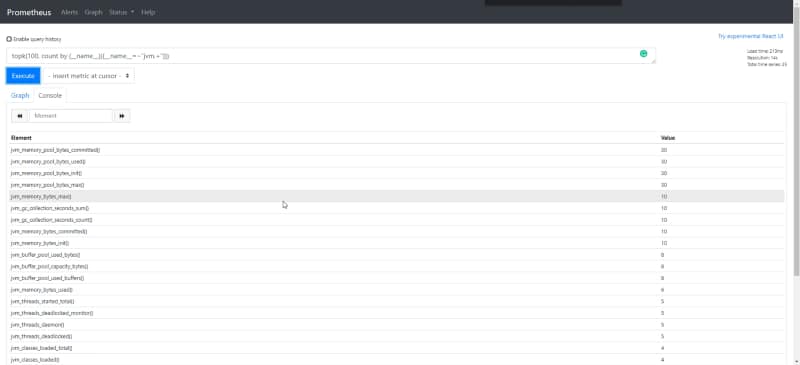
So we can see that we have at least 150 series regarding to metrics that I am not using at all. But let’s do it even better, let’s take a look at the same but group by job names:
topk(10, count by (job,__name__)({__name__=~".+"}))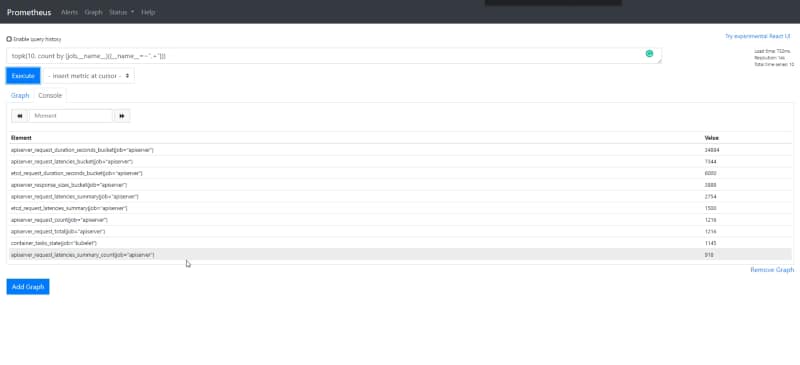
📚 Want to dive deeper into Kubernetes? This article is part of our comprehensive Kubernetes Architecture Patterns guide, where you’ll find all fundamental and advanced concepts explained step by step.

